. 2023 Aug;4(8):1193-1209.
doi: 10.1038/s43018-023-00607-x. Epub 2023 Aug 7.

Different niches for stem cells carrying the same oncogenic driver affect pathogenesis and therapy response in myeloproliferative neoplasms

Affiliations

Different niches for stem cells carrying the same oncogenic driver affect pathogenesis and therapy response in myeloproliferative neoplasms

Elodie Grockowiak et al. Nat Cancer. 2023 Aug.

Abstract

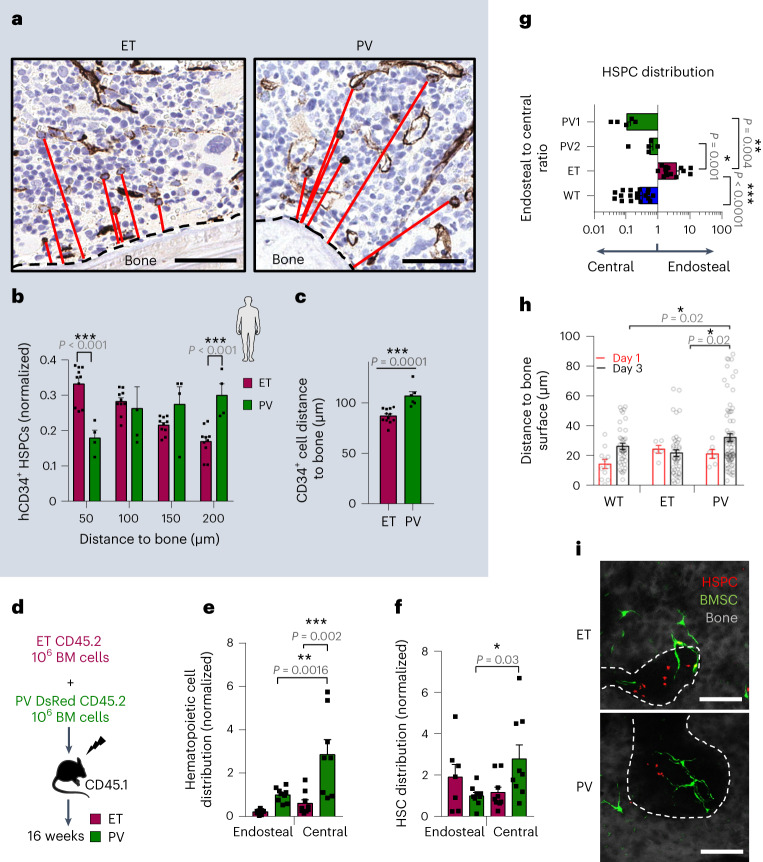
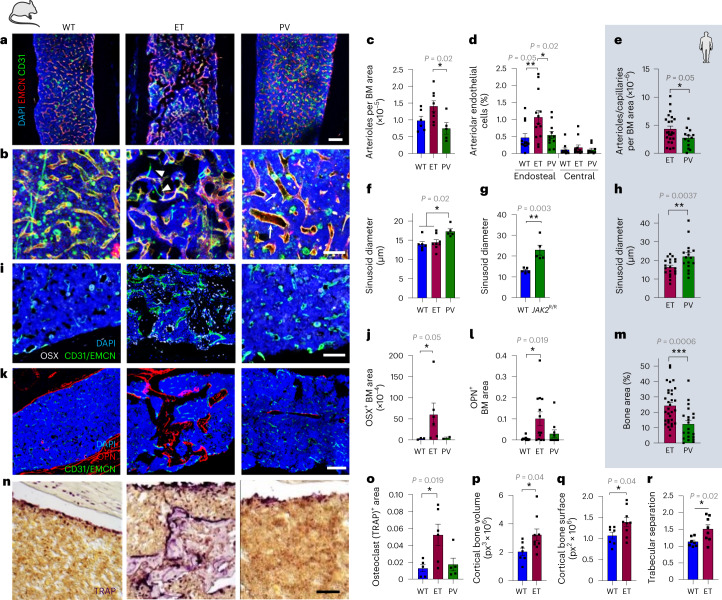
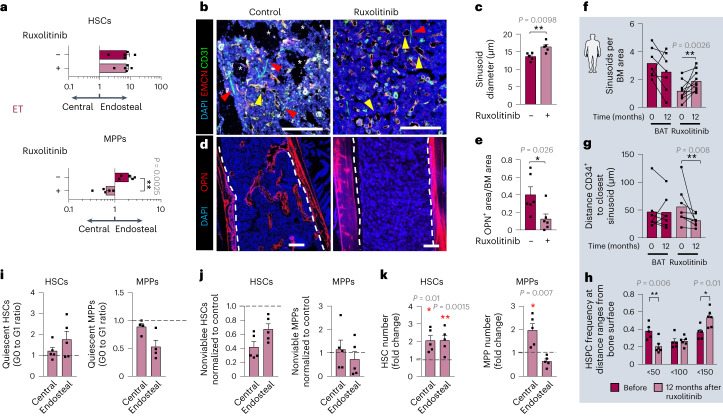
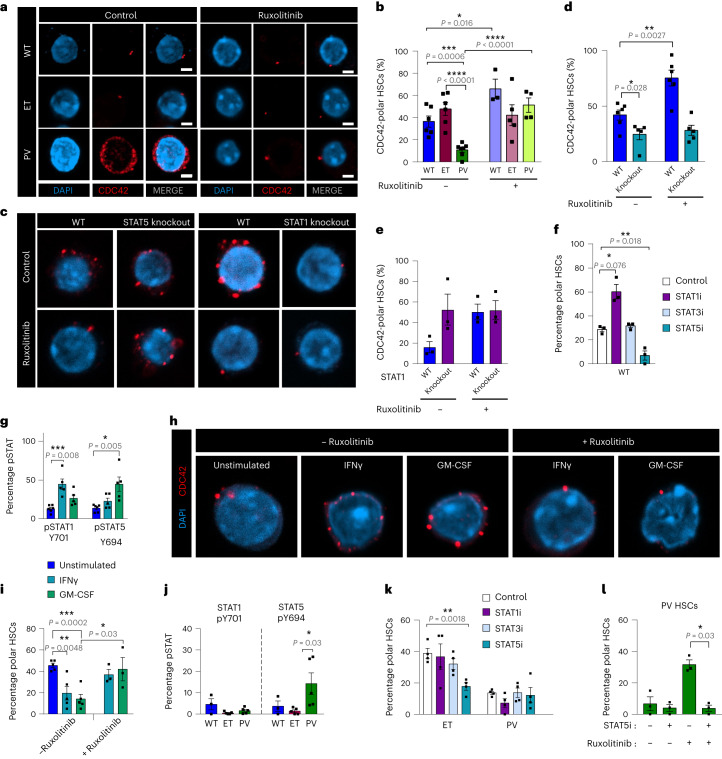
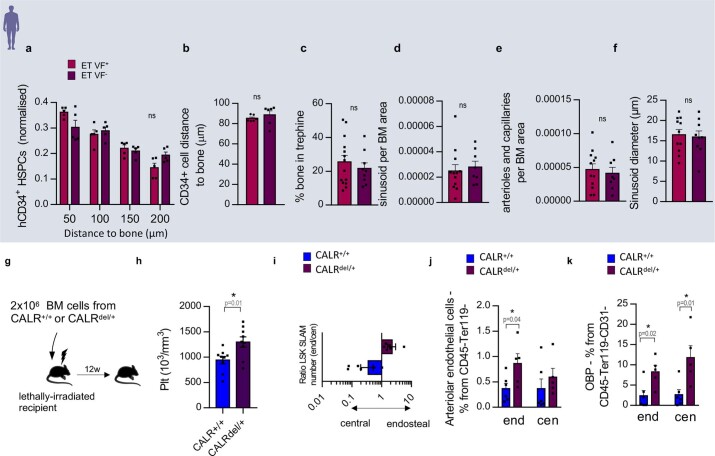
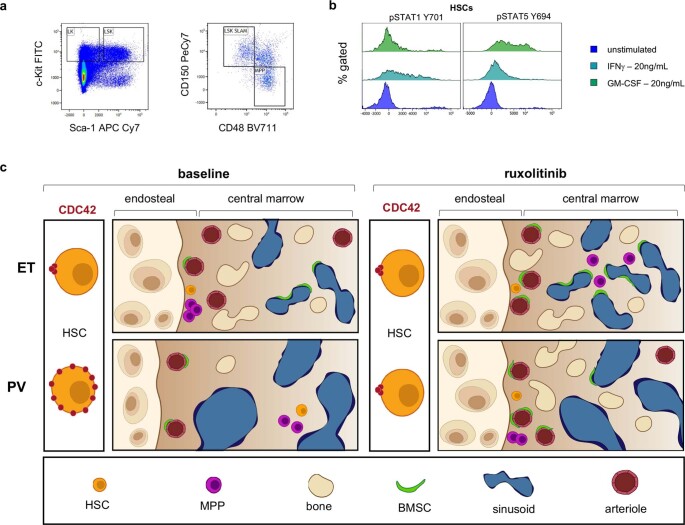
Aging facilitates the expansion of hematopoietic stem cells (HSCs) carrying clonal hematopoiesis-related somatic mutations and the development of myeloid malignancies, such as myeloproliferative neoplasms (MPNs). While cooperating mutations can cause transformation, it is unclear whether distinct bone marrow (BM) HSC-niches can influence the growth and therapy response of HSCs carrying the same oncogenic driver. Here we found different BM niches for HSCs in MPN subtypes. JAK-STAT signaling differentially regulates CDC42-dependent HSC polarity, niche interaction and mutant cell expansion. Asymmetric HSC distribution causes differential BM niche remodeling: sinusoidal dilation in polycythemia vera and endosteal niche expansion in essential thrombocythemia. MPN development accelerates in a prematurely aged BM microenvironment, suggesting that the specialized niche can modulate mutant cell expansion. Finally, dissimilar HSC-niche interactions underpin variable clinical response to JAK inhibitor. Therefore, HSC-niche interactions influence the expansion rate and therapy response of cells carrying the same clonal hematopoiesis oncogenic driver.


Conflict of interest statement

C.N.H. reports funded research from Novartis; speaker fees from Novartis, Janssen, CTI, Celgene and Medscape; and advisory board membership for Incyte, CTI, Sierra Oncology, Novartis, Celgene, Roche, AOP Pharma, Geron and AstraZeneca. A.G. reports speaker fees from Novartis and Bristol Myers Squibb. The other authors declare no competing interests.

Figures

Fig. 1
Fig. 1. Different niches for HSPCs carrying the same oncogenic driver in MPN subtypes.
a, Immunohistochemistry for CD34 and hematoxylin showing CD34+ hHSPCs and their shortest distance to the bone surface (red line) in BM sections from JAK2V617F-mutant human ET or PV. Scale bar, 30 µm. b, hHSPC frequency at distance ranges (in micrometers) from bone surface in ET (n = 12 patients) or PV (n = 6 patients). c, Mean distance between hHSPCs and the bone surface in ET (n = 12 patients) or PV (n = 6 patients). df, Competitive transplant with ET-like and PV-like BM cells. d, Outline of competitive transplantation: BM cells from CD45.2 ET-like mouse and DsRed PV-like mouse were transplanted together in irradiated CD45.1 recipients. e,f, BM distribution of ET-like or PV-like hematopoietic cells (CD45+) (e) and LinSca1+cKit+ (LSK) mHSPCs (f) in recipient mice (n = 9 mice). g, BM distribution (endosteal:central ratio) of WT, PV-like or ET-like mHSPCs after noncompetitive transplantation of BM cells. PV1, Scl-CreERT2;JAK2V617F, n = 5 mice. PV2, Mx1-Cre:JAK2V617F, n = 5 mice. ET, iVav-Cre;JAK2V617F, n = 14 mice. WT, n = 18 mice. h, Distance to bone surface measured longitudinally through intravital imaging 1–3 days after transplantation of WT, ET-like or PV-like DsRed HSCs (n = 6 independent experiments). HSPCs at day 1, WT (n = 11 cells), ET (n = 5 cells), PV (n = 6 cells). HSPCs at day 3, WT (n = 40 cells), ET (n = 45 cells), PV (n = 74 cells). i, Representative BM Z-stacks 3 days after transplantation into Nes-GFP mice (with genetically labeled HSC-niche-forming cells). Bone surface is depicted with a dashed line. Scale bar, 100 µm. n = 6 independent experiments. In b,c a two-sided Student’s t-test was used. In eh a two-sided one-way analysis of variance (ANOVA) was used. In b,c,eg each square dot is an organism. In h each dot is a cell. Data are shown as the mean ± s.e.m. *P < 0.05; **P < 0.01; ***P < 0.001. Source data
Fig. 2
Fig. 2. Asymmetric HSC-niche interactions cause differential vascular and stromal remodeling in MPN subtypes.
ad,f,g,il,nr, Analysis of WT mice transplanted with WT (n = 10 mice), ET-like (n = 12 mice) or PV-like (n = 10 mice) BM cells (white background). e,h,m, Analysis of patients with MPN BM trephines (blue background). a,b, Immunofluorescence of CD31+ (green) or endomucin (EMCN)+ (red) blood vessels, representative image in a and quantification in b. Nuclei were counterstained with 4′,6-diamidino-2-phenylindole (DAPI) (blue). c, Arterioles (small caliper CD31highEMNClo vessels) per BM area. WT (n = 6 mice), ET (n = 8 mice), PV (n = 5 mice). d, Frequency of Sca1hiCD31hi arteriolar endothelial cells among CD45Ter119 cells. WT (n = 12 mice), ET (n = 13 mice), PV (n = 11 mice). e, Arterioles or capillaries per BM area in patients’ trephines. ET (n = 23 patients), PV (n = 13 patients). f,g, Sinusoid diameter in transgenic (f) or knockin (g) models of MPN (compared with WT mice). f, WT (n = 6 mice), ET (n = 8 mice), PV (n = 5 mice). g, WT (n = 5 mice), JAK2R/R (n = 5 mice). h, Sinusoid diameter in BM trephines from ET (n = 20 patients) or PV (n = 16 patients). il, Immunofluorescence (i,k) and quantification (j,l) of OSX+ osteoprogenitors (i, white) and OPN+ osteoblasts (k, red). Scale bar in a and k, 200 µm. j, WT (n = 3 mice), ET (n = 6 mice), PV (n = 2 mice). l, WT (n = 10 mice), ET (n = 13 mice), PV (n = 10 mice). m, Human BM trephine area occupied by bone (in percent). ET (n = 32 patients), PV (n = 21 patients). n,o, Representative staining (n) and quantification (o) of tartrate-resistant acid phosphatase (TRAP)+ osteoclast area. o, WT (n = 5 mice), ET (n = 6 mice), PV (n = 5 mice). Scale bar in b, l and n, 100 µm. pr, Bone histomorphometry (µCT) analysis of WT (n = 7 mice) and ET-like (n = 9 mice) mice. p, Cortical bone volume. q, Cortical bone surface. r, Trabecular separation. Each square dot represents a mouse or individual. Data are shown as the mean ± s.e.m. *P < 0.05; **P < 0.01; ***P < 0.001. In c,d,f,j,l a two-sided, one-way ANOVA was used. In e,g,h,m,pr a two-sided Student’s t-test was used. Source data
Fig. 3
Fig. 3. Human HSCs from ET and PV differentially remodel their niche in PDX.
ag, Analysis of PDX mice (MISTRG recipient mice) transplanted with ET (n = 8 mice) or PV (n = 6 mice) CD34+ hHSPCs intrafemorally, or sham-treated (n = 7 mice). Primary cells were isolated from independent ET (n = 3) and PV (n = 3) donors. a, Inverse correlation of the frequencies of human and mouse hematopoietic cells in PDX BM (n = 28). The regression linear line is represented by a red dashed line. b, Spleen weight in the ET (n = 8 mice), PV (n = 6 mice) or control (n = 7 mice) PDX model. c, BM distribution of CD34+CD38 hHSCs (ET, n = 5 mice; PV, n = 4 mice). d,e, Immunofluorescence of CD31+ (green) and EMCN+ (red) blood vessels (d) and quantification of sinusoid diameter (e). Asterisk in d′ represents bone formation. f,g, Immunofluorescence of OPN+ osteoblasts (turquoise blue) and EMCN+ (red) blood vessels (f), and quantification of OPN+ bone area (g); control, n = 7 mice; ET, n = 7 mice; PV, n = 6 mice. Arrowheads in d′ indicate sinusoids; arrowheads in f indicate OPN+ area (bone formation). Scale bar in d, d and f, 200 µm. h,i, Analysis of ET (n = 16 patients) or PV (n = 6 patients) human BM trephines (blue background). Mean distance between CD34+ hHSPC and the closest arteriole or capillary (h) or sinusoid (i). Each dot represents one individual. Each square dot represents a mouse or individual. Data are shown as the mean ± s.e.m. *P < 0.05; **P < 0.01; ***P < 0.001; ****P < 0.0001. In a a two-sided Spearman correlation test was used. In b,e,g a two-sided, one-way ANOVA was used. In c,h,i a two-sided Student’s t-test was used. Source data
Fig. 4
Fig. 4. ET relocation to the central niche worsens disease development.
ad, Analysis of the endosteal and central BM of β3-AR knockout mice (n = 5 mice) or WT (n = 7 animals) mice 8 weeks after transplantation with BM cells from iVav-Cre;Jak2V617F ET-like mice. a, Frequency of PDGFRα+Sca1 BMSCs among CD45Ter119CD31 stromal cells. WT, n = 7 mice; β3-AR knockout, n = 5 mice. b, LSK CD48CD150+ HSCs in the endosteal or central BM. WT, n = 7 mice; β3-AR knockout, n = 5 mice. c, Cell cycle analysis showing reduced frequency of quiescent (G0) HSCs in the central BM of β3-AR knockout (n = 6) or WT (n = 5) mice. The gating strategy is shown in Extended Data Fig. 1a. d, LSK CD48+CD150 MPPs in the endosteal or central BM. WT, n = 5 mice; β3-AR knockout, n = 6 mice. ej, Analysis of the endosteal and central BM of β3-AR knockout mice (n = 6 mice, unless indicated otherwise) or WT mice 16 weeks after transplantation with BM cells from iVav-Cre;Jak2V617F;VWF-TdTomato ET-like mice, to detect megakaryocyte-committed cells through VWF expression. e,f, Immunofluorescence of Ki67 (green), VWF-tdTomato (VWF, red), cKit (blue). e′, e and f′, f represent high magnification insets of the endosteal (e′, f′) and central (e, f) BM. The red arrowhead indicates megakaryocytes; the white arrowhead indicates proliferative megakaryocyte progenitors. Scale bar, 100 µm. g, Number of VWF+ megakaryocyte-committed cells. WT, n = 5 mice; β3-AR knockout, n = 4 mice. h, Number of LSK+CD150+CD41+ granulocyte-macrophage, erythrocyte and megakaryocyte progenitors. WT, n = 5 mice; β3-AR knockout, n = 5 mice. i, Frequency of VWF+cKit+Ki67+ proliferative megakaryocyte progenitors. WT, n = 4 mice; β3-AR knockout, n = 4 mice. j, Circulating platelets measured by blood counter 1–4 months after transplantation. WT, n = 6 mice; β3-AR knockout, n = 6 mice. In ad,gi each square dot is a mouse. The gating strategy is shown in Extended Data Figs. 1 and 2. Data are shown as the mean ± s.e.m. *P < 0.05; **P < 0.01; ***P < 0.001. In a,b,d,gi a two-sided one-way ANOVA was used. In c,j a two-sided Student’s t-test was used. Source data
Fig. 5
Fig. 5. JAK inhibition restores the endosteal niche and HSC quiescence in PV.
a, Distance between HSPCs and the bone surface measured through intravital microscopy (Extended Data Fig. 1m) 3 days after ruxolinitib treatment (70 mg kg−1, once daily, normalized to vehicle-treated control mice). PV, n = 144 cells; ET, n = 146 cells. HSPCs were pooled from three independent experiments. bg,km, WT mice were lethally irradiated, transplanted with BM cells from PV-like mice and treated with ruxolitinib (70 mg kg−1, once daily, three times weekly) or vehicle for 5 weeks (outline shown in Extended Data Fig. 5a). b, BM distribution of LSK CD48CD150+ HSCs (top) or LSK CD48+CD150 MPPs (bottom) in PV-like mice. Data are the ratio between endosteal and central BM cells; control, n = 10 mice; ruxolitinib, n = 10 mice. The gating strategy is shown in Extended Data Fig. 1a. c,d, Immunofluorescence of CD31+ (green) and EMCN+ (red) blood vessels. c, Representative images. Nuclei were counterstained with DAPI (blue). Asterisks represent area occupied by bone; yellow arrowheads indicate sinusoids; and red arrowheads depict arterioles. Scale bar, 100 µm. d, Quantification of arterioles per mouse BM area; control, n = 5 mice; ruxolitinib, n = 4 mice. e, Frequency of Sca1hiCD31hi arteriolar endothelial cells among CD45Ter119 stromal cells; control, n = 11 mice; ruxolitinib, n = 11 mice. f,g, Immunofluorescence (f) and quantification (g) of OPN+ osteoblasts (red). Nuclei were counterstained with DAPI (blue); control, n = 5 mice; ruxolitinib, n = 5 mice. Scale bar, 100 µm. Dashed line depicts the interface between bone and BM. hj, Longitudinal analysis of paired BM trephines from patients with PV before or 12 months after treatment with ruxolitinib or BAT. h, Arterioles or capillaries per human BM area; BAT, n = 3 samples; ruxolitinib, n = 11 samples. i, Shortest distance between CD34+ hHSPCs and arterioles or capillaries. BAT, n = 4 samples; ruxolitinib, n = 11 samples. j, BM area occupied by bone; BAT, n = 3 samples; ruxolitinib, n = 12 samples. k, Ratio (G0 to G1) of quiescent HSCs (left) and MPPs (right) in the endosteal or central BM; control, n = 5 mice; ruxolitinib, n = 5 mice. NS, not significant. l, Frequency of nonviable (sub-G0) HSCs (left) and MPPs (right); control, n = 5 mice; ruxolitinib, n = 5 mice. m, Fold change of HSCs (left) and MPPs (right) after ruxolitinib treatment; control, n = 9 mice; ruxolitinib, n = 9 mice. The black horizontal dashed line in k, l and m marks the normalized control. In a,b,d,e,gm each square dot is a mouse or individual. Data are shown as the mean ± s.e.m. *P < 0.05; **P < 0.01; ***P < 0.001; ****P < 0.0001. In a,b,d,g,km a two-sided Student’s t-test was used. In hj a paired two-sided Student’s t-test was used. In e a two-sided, one-way ANOVA was used. Source data
Fig. 6
Fig. 6. JAK inhibitor expands central BM MPPs in ET.
ae,ik, WT mice were lethally irradiated, transplanted with BM cells from ET-like mice and treated with ruxolitinib (70 mg kg−1, once daily, three times weekly) or vehicle for 5 weeks (outline shown in Extended Data Fig. 5a). a, BM distribution of LSK CD48CD150+ HSCs (top) or LSK CD48+CD150 MPPs (bottom). Data are the ratio between endosteal and central BM cells; control, n = 5 mice; ruxolitinib, n = 5 mice. The gating strategy is shown in Extended Data Fig. 1a. b,c, Immunofluorescence of CD31+ (green) and EMCN+ (red) blood vessels. b, Representative images. Nuclei were counterstained with DAPI (blue). Asterisks represent area occupied by bone; yellow arrowheads indicate sinusoids; and red arrowheads depict arterioles. Scale bar, 100 µm. c, Quantification of sinusoid diameter; control: n = 5 mice; ruxolitinib, n = 4 mice. d,e, Immunofluorescence (d) and quantification (e) of OPN+ osteoblasts (red). Nuclei were counterstained with DAPI (blue); control, n = 5 mice; ruxolitinib, n = 5 mice. Scale bar, 100 µm. Dashed line depicts the interface between bone and BM. fh, Longitudinal analysis of paired BM trephines from patients with ET before or 12 months after treatment with ruxolitinib or BAT. f, Sinusoids per BM area; BAT, n = 7 samples; ruxolitinib, n = 10 samples. g, Shortest distance between CD34+ hHSPCs and sinusoids; BAT, n = 7 samples; ruxolitinib, n = 8 samples. h, Frequencies of CD34+ hHSPCs at distance ranges from the bone surface before (n = 5 samples) or 12 months after ruxolitinib treatment (n = 6 samples). i, Ratio (G0 to G1) of quiescent HSCs (left, n = 5 mice) and MPPs (right, n = 4 mice) in the endosteal or central BM. j, Frequency of nonviable (sub-G0) HSCs (left, n = 5 mice) and MPPs (right, n = 5 mice). k, Fold change of HSCs (left, n = 5 mice) and MPPs (right, n = 5 mice) after ruxolitinib treatment. The black horizontal dashed line in i, j and k marks the normalized control. Each square dot is a mouse or individual. Data are shown as the mean ± s.e.m. *P < 0.05; **P < 0.01. In a,c,e,fh,ik a two-sided Student’s t-test was used. Source data
Fig. 7
Fig. 7. CDC42 polarity regulates the location and proliferation of MPN HSCs.
a, Gene set enrichment analysis of 187 CDC42-interacting proteins (Extended Data Fig. 7) in an hHSC RNA-seq dataset, including PV and ET. bd, CDC42 immunofluorescence (red) and frequencies of CDC42-polar LSK CD48CD150+ HSCs from WT or MPN mice. b, Fluorescence-activated cell-sorted HSCs from 10–13 or 25-week-old WT, ET-like or PV-like mice were cultured for 16 h on fibronectin-coated imaging slides, stained for CDC42 and imaged. 10–13-week-old mice: WT, n = 8; ET, n = 4; PV, n = 4; 25-week-old mice: WT, n = 4; ET, n = 3; PV, n = 2. n is the number of independent experiments. c, Fluorescence-activated cell-sorted HSCs from 10–13-week-old WT, ET-like and PV-like mice were treated in vitro for 16 h with the CDC42 inhibitor CASIN (1 µm) or vehicle, stained for CDC42 and imaged. Without CASIN: WT, n = 6; ET, n = 6; PV, n = 7. With CASIN: WT, n = 6; ET, n = 4; PV, n = 6. n is the number of independent experiments. d, Representative images of the HSCs in Fig. 7c. e,f, HSCs were sorted from DsRed ET-like or PV-like donor mice and injected intravenously into lethally irradiated Nes-GFP recipients subsequently treated with CASIN (10 mg kg−1 per day) and analyzed by intravital imaging after 3 days (n = 3 independent experiments). e, Distance between HSPCs and the bone surface in CASIN-treated recipients, normalized to vehicle-treated control from three different experiments. PV, n = 153 cells; ET, n = 147 cells. f, Z-stacks of Nes-GFP+ skull BM 3 days after transplantation and CASIN treatment. HSPCs (red), GFP+ (green) niche cells and the bone signal (dashed line) from secondary-harmonic generation from collagen (gray) are shown. Scale bar, 100 µm. g, Outline of the experiment. BM cells from ET-like or PV-like mouse were transplanted in irradiated WT recipients subsequently treated for 5 weeks with CASIN (5 mg kg−1 per day) or vehicle, starting 4 weeks after transplant. hq, Transplant of PV-like (hl) or ET-like (mq) BM cells in WT recipient mice treated chronically with the CDC42 inhibitor CASIN. hj, Control, n = 5 and 6; CASIN, n = 5. k,l, Control, n = 11; CASIN, n = 13. mq, Control, n = 4–7; CASIN, n = 5. n is the number of independent experiments. h,m, BM HSC distribution expressed as the ratio of endosteal to central HSCs in PV-like (h) or ET-like (m) mice treated with CASIN or vehicle. i,n, Frequency of quiescent (G0 to G1 ratio) HSCs in the endosteal or central BM of PV-like (i) or ET-like (n) mice. j,o, Fold change of HSCs in the endosteal or central BM of PV-like (j) or ET-like (o) mice after CASIN treatment. The black horizontal dashed line in i, j, n and o marks the normalized control. k,p, WBCs before and 4 or 5 weeks after CASIN treatment of PV-like (k) or ET-like (p) mice. l,q, Circulating platelets before and 4 or 5 weeks after CASIN treatment of PV-like (l) or ET-like (q) mice. rw, WT mice were lethally irradiated, transplanted with BM cells from ET-like mice and treated 12 weeks after transplantation (at secondary myelofibrosis stage) with ruxolitinib (70 mg kg−1, once daily, three times weekly), CASIN (5 mg kg−1 per day) or vehicle for 5 weeks. r,s, Reticulin fibers staining (r) and fibrosis grade (s). Control, n = 4 mice; ruxolitinib, n = 5 mice; CASIN, n = 4 mice. Scale bar, 200 µm. t,u, Trichrome Masson staining (t) and osteosclerosis quantification (u). Control, n = 4 mice; ruxolitinib, n = 5 mice; CASIN, n = 4 mice. Scale bar, 200 µm. v, Frequency of PDGFRαSca1CD51+osteoblast precursors among CD45Ter119CD31 stromal cells in myelofibrotic mice treated with ruxolitinib (n = 5 mice), CASIN (n = 4 mice) or vehicle (n = 5 mice). w, Spleen weight in myelofibrotic mice treated with ruxolitinib (n = 5 mice), CASIN (n = 4 mice) or vehicle (n = 5 mice). In b,c,e,hq,sw data are shown as the mean ± s.e.m. Each square dot is a mouse. *P < 0.05; **P < 0.01; ***P < 0.001; ****P < 0.0001. A two-sided Student’s t-test was used. Source data
Fig. 8
Fig. 8. JAK–STAT signaling differentially regulates HSC polarity in MPN subtypes.
af, CDC42 immunofluorescence (a,c, red) and frequencies of CDC42 polarity in LSK CD48CD150+ HSCs (bf). Scale bar, 2 µm. b, HSCs were sorted from WT (n = 3–6), ET-like (n = 5 or 6) or PV-like (n = 4–7) 10–13-week-old mice and cultured for 16 h with ruxolitinib (1 µM) or vehicle. n is the number of independent experiments. d, HSCs were sorted from 20-week-old STAT5 conditional knockout (n = 5) or WT (n = 5) mice. e, HSCs were sorted from 30-week-old STAT1 conditional knockout (n = 3) or WT (n = 3) mice. f, HSCs were sorted from 10–13-week-old WT mice and cultured for 16 h with STAT1 (NSC 118218 phosphate, 10 µM), STAT3 (BP-1-102, 5 µM) or STAT5 (AC-4-130, 5 µM) inhibitor, or vehicle (n = 3 mice). g, Frequency of pSTAT1+ (Y701) or pSTAT5+ (Y694) HSCs 15 min after in vitro stimulation with IFNγ (20 ng ml−1, n = 5 mice), GM-CSF (20 ng ml−1, n = 5 mice) or vehicle (n = 6 mice). h,i, CDC42 immunofluorescence (h, red) and frequencies of CDC42-polar HSCs (n = 3–5 mice) (i). Fluorescence-activated cell-sorted HSCs were cultured for 16 h with IFNγ (20 ng ml−1) or GM-CSF (20 ng ml−1), with or without ruxolitinib (1 µM), and stained for CDC42. j, Frequency of pSTAT1+ (Y701) or pSTAT5+ (Y694) HSCs isolated from WT (n = 3), ET-like (n = 5) or PV-like (n = 5) mice. k, Frequencies of CDC42-polar HSCs from 10–13-week-old ET-like or PV-like mice after 16-h culture with STAT1 (NSC 118218 phosphate, 10 µM), STAT3 (BP-1-102, 5 µM) or STAT5 (AC-4-130, 5 µM) inhibitors, or vehicle (n = 4 mice). l, Frequencies of CDC42-polar HSCs from PV-like mice after 16-h culture with vehicle, STAT5 inhibitor (AC-4-130, 5 µM), ruxolitinib (1 µM) or a combination of both (n = 3 mice). In b,df,g,il Data are shown as the mean ± s.e.m. Each square dot is a mouse. *P < 0.05, **P < 0.01, ***P < 0.001, ****P < 0.0001. In b a two-sided one-way ANOVA was used. In df,g,il a Student’s t-test was used. Source data
Extended Data Fig. 1
Extended Data Fig. 1. Different niches for HSPCs, but not their downstream progeny, in MPN subtypes.
a, Gating strategy for the mouse hematopoietic populations. Lin-Sca1+cKit+ (LSK) hematopoietic stem and progenitor cells (HSPCs), LSK CD150+CD48- hematopoietic stem cells (HSCs), LSK CD150-CD48+ multipotent progenitors (MPPs), Lin-cKit+Sca1- CD34+CD16/32-Granulocyte/macrophage/megakaryocyte /erythrocyte progenitor (CMP), Lin-cKit+Sca1-CD34+CD16/32+ granulocyte-monocyte progenitors (GMP), Lin-cKit+ Sca1-CD34-CD16/32- megakaryocyte-erythroid progenitors (MEP), Lin-ckit-Sca1-CD150+VWF+ megakaryocyte progenitors (MkP), B220-CD11b+Ly6G+ granulocytes, B220-CD11b+Ly6G- monocytes, CD71+TER119- pro-erythrocytes (ProEry), TER119hiCD71+FSC-Ahi EryA erythroblasts (EryA), TER119hiCD71+FSC-Alo EryB erythroblasts (EryB), TER119hiCD71- EryC erythroblasts (EryC), B220+ B lymphocytes (LYM). b-l, Frequencies of the hematopoietic populations gated on (a) in the endosteal (end) or central (cen) BM of WT mice transplanted with WT, ET-like or PV-like BM cells, 16w after transplantation (n=8-10 mice). b, Granulocyte/macrophage/megakaryocyte/erythrocyte progenitor (GM-E-MkP). c, Granulocyte-monocyte progenitors (GMP). d, Megakaryocyte-erythroid progenitors (MEP). e, Megakaryocyte progenitors (MkP). f, EryA erythroblasts (EryA). g, EryB erythroblasts (EryB). h, EryC erythroblasts (EryC). i, Pro-erythrocytes (ProEry). j, Granulocytes. k, Monocytes. l, Lymphocytes. b-l, Data are means±SEM. Each square dot is a mouse. Two-sided One-way ANOVA, *p<0.05; **p<0.01; ***p<0.001. m, Outline of intravital imaging. Labelled mHSCs were injected into Nes-GFP mice (with genetically labelled HSC niche-forming cells45) previously irradiated, to achieve sufficient BM homing, and visualized 1 and 3 days later through combined confocal and 2-photon microscopy. Source data
Extended Data Fig. 2
Extended Data Fig. 2. Asymmetric HSC-niche interactions cause differential vascular and stromal remodeling in MPN subtypes.
a, Gating strategy used for mouse stromal cell populations. CD45Ter119Sca1+CD31+ arteriolar endothelial cells (AEC), CD45Ter119EMCNloCD31lo sinusoidal endothelial cells (SEC), CD45Ter119CD31 PDGFRα+Sca1 mesenchymal stem cells (MSCs), CD45 Ter119CD31PDGFRα-Sca1CD51+ osteoblast precursors (OBPs). b, e, o, Immunohistochemistry for CD34 and hematoxylin counterstaining in BM trephines from ET or PV patients at baseline. Scale bar, 100μm (b, o), 1 mm (e). b, Analysis of the BM vasculature in ET or PV patients. Red arrowheads depict sinusoids and green arrowheads depict arterioles/capillaries. c, Frequency of EMCNloCD31lo sinusoidal endothelial cells among CD45Ter119 stromal cells in WT (n = 11 mice), ET- (n = 13 mice) or PV-like (n = 11 mice) animals. d, Frequency of PDGFRα-Sca1CD51+ osteoblast precursors among CD45Ter119CD31 stromal cells in WT (n = 6 mice), ET- (n = 6 mice) or PV-like (n = 7 mice) animals. e, Bone area (red dashed line) and tissue area (black dashed line) in ET or PV BM trephine. Scale bar, 1 mm. f, Col1a1 mRNA expression in BM cells from WT (n = 11 mice), ET-like (n = 3 mice) or PV-like (n = 4 mice) animals. g-h, Trichrome Masson staining of BM sections from WT, ET- or PV-like mice. Scale bar, 200μm. i-n, Analysis of PDX mice (MISTRG) transplanted with ET (n = 8 mice) or PV (n = 6 mice) hHSPCs, or sham-treated (n = 7 mice). i, Outline of the experiment. PV or ET patient-derived CD34+ HSPCs were injected intrafemorally in irradiated MISTRG mice and analyzed 16w post-transplant. j, Gating strategy used for human hematopoietic cells. hCD45+ pan-human hematopoietic cells, hCD45+hCD34 mature hematopoietic cells, hCD45+hCD34+ hHSPCs, hCD45+hCD34+hCD38+ HPCs, hCD45+hCD34+hCD38 HSC-enriched cells. k-n, BM distribution of human MPN cells in the PDX mice. The data represents the ratio of the number of cells in the endosteum over the number of cells in the central marrow. k, hCD45+ hematopoietic cells. l, hCD45+hCD34 mature hematopoietic cells. m, hCD45+hCD34+ hHSPCs. n, hCD45+CD34+CD38+ HPCs. ET, n = 8 mice; PV, n = 5 mice. o, Analysis of the distance between hHSPCs and sinusoids (green lines) and between hHSPCs and arterioles/capillaries (red lines). Green asterisks depict sinusoidal lumen. p-q, HSPC frequency at distance ranges (μm) from arterioles/capillaries (p) or sinusoids (q) in MPN human BM trephines. ET, n = 16 patients; PV, n = 14 patients. c-f, k-n, Data are means ± SEM. Each square dot is a mouse. c-f, Two-sided One-way ANOVA. p-q, k-n, Two-sided Student’s t-test. *p < 0.05; **p < 0.01; ***p < 0.001. Source data
Extended Data Fig. 3
Extended Data Fig. 3. JAK2V617F+ and JAK2V617F− ET patients and mice display similar HSPC distribution and microenvironmental alterations.
a, b, Distribution of the minimal distance (a) or mean distance (b) between CD34+ hHSPCs and the bone surface following the analysis of immunohistochemistry for CD34 and hematoxylin counterstaining of BM trephines from JAK2V617F positive (VF+) or negative (VF) human essential thrombocythemia (ET; n = 5-6 patients). c, Percentage of BM trephine occupied by bone in VF+ (n = 14 patients) or VF (n = 9 patients) human ET. d, Sinusoids per BM area in VF+ (n = 12 patients) or VF (n = 8 patients) human ET. e, Number of arterioles/capillaries per BM area in VF+ (n = 12 patients) or VF (n = 8 patients) human ET. f, Mean sinusoid diameter in VF+ (n = 11) or VF- (n = 9) human ET. g, Outline of CALR-mutant ET model. 2×10⁶ BM cells from of ET-like (CALRdel/+) or WT control (CALR+/+) mice were i.v. injected into lethally-irradiated WT recipients (n = 6 mice) that were analyzed 12w later (h-k). h, Circulating platelets in ET-like (CALRdel/+, n = 9) or WT control (CALR+/+, n = 9 mice) chimeric mice. i, BM distribution (endosteal:central ratio) of Lin Sca1+cKit+ (LSK) CD48CD150+ HSCs (n = 6 mice). j, Frequency of Sca1hiCD31hi arteriolar endothelial cells among CD45Ter119 stromal cells. WT, n = 6 mice; ET, n = 5 mice. k, Frequency of CD51+PDGFRα- osteoblast progenitors (OBP) among CD45Ter119CD31 stromal cells. WT, n = 6 mice; ET, n = 5 mice. a-k, Data are means ± SEM. Each square dot is a mouse. Two-sided Student’s t-test, *p < 0.05. Source data
Extended Data Fig. 4
Extended Data Fig. 4. Prematurely aged β3-AR knock-out niche worsens MPN development.
a-i, Analysis of WT mice (n = 9 mice) or β3-AR knock-out mice (n = 6 mice) 8w after transplantation of BM cells from iVav-Cre;JAK2V617F ET-like mice. a, Outline of the experiment. b, Frequency of Sca1hiCD31hi arteriolar endothelial cells among CD45Ter119 stromal BM cells. c, Frequency of EMCNloCD31lo sinusoidal endothelial cells among CD45Ter119 stromal BM cells. d, Spleen weight of WT (n = 9 mice) or β3-AR KO (n = 5 mice) animals. e-h, Analysis of the endosteal and central BM of β3-AR knock-out mice or WT mice 16w after transplantation with BM cells from iVav-Cre;JAK2V617F;Vwf-TdTomato ET-like mice, to detect megakaryocyte-committed cells through Von Willebrand factor (VWF) expression. e, BM CD41+VWF+ megakaryocyte-committed cells (n = 5 mice). f-g, BM frequency of (f) megakaryocyte-committed cKit+VWF+ or (g) -non-committed cKit+VWF HSPCs (n = 4 mice). h, Flow cytometry diagram showing CD150+VWF+ megakaryocyte progenitors among BM LinSca1cKit+ cells. i, Frequency of circulating VWF+ megakaryocyte committed cells 2-4 months after transplantation (n = 6 mice). j-n, Blood counts 1–4 months after transplantation (n = 6 mice). j, Red blood cells. k, Lymphocytes. l, Monocytes. m, Granulocytes. n, Eosinophiles. b-g, i-n, Data are means ± SEM. b-i, Each square dot is a mouse. Two-sided Student’s t-test, *p < 0.05. Source data
Extended Data Fig. 5
Extended Data Fig. 5. Different effects of JAK inhibitor on HSPC-niche interactions in MPN subtypes.
a-d, WT mice were lethally irradiated, transplanted with BM cells from PV-like or ET-like mice and treated 4w post-transplantation with ruxolitinib (70 mg/kg, o.d.,3/w) or vehicle for 5w. (control, n = 7 mice; ruxolitinib, n = 6 mice). a, Outline of the experiment. b, Frequency of EMCNloCD31lo sinusoidal endothelial cells among CD45Ter119 BM cells. c, Frequency of PDGFRα+Sca1 BM mesenchymal stem cells (BMSCs) among CD45Ter119CD31 stromal cells. d, Frequency of PDGFRα-Sca1CD51+ osteoblasts precursors among CD45Ter119CD31 stromal cells in PV-like mice. e-j, Analysis of PV patients’ paired BM trephines at baseline or after 12-month treatment with ruxolitinib or best available therapy (BAT). e, Immunohistochemistry for CD34 and hematoxylin counterstaining in BM trephines from the same PV patient at baseline or 12mo after ruxolitinib treatment. Red arrowheads depict sinusoids and green arrowheads depict arterioles/capillaries. Scale bar, 100μm. f, Sinusoids per BM area (BAT, n = 3 patients; ruxolitinib, n = 11 patients). g, Mean sinusoid diameter (BAT, n = 4 patients; ruxolitinib, n = 9 patients). h, Mean distance between CD34+ HSPCs and the closest sinusoid (BAT, n = 4 patients; ruxolitinib, n = 7 patients). i-j, Distribution of CD34+ HSPC frequency of distance ranges (μm) from the bone surface in paired samples from the same PV patients at baseline or after 12- month treatment with BAT (i, n = 4 patients) or ruxolitinib (j, n = 12 patients). k-o, Immunohistochemistry for CD34 and hematoxylin counterstaining of paired samples from the same ET patients at baseline or after 12-month treatment with ruxolitinib or BAT. k-l, Bone area (red dash line) and tissue area (black dash line) in ET paired BM trephine. Scale bar, 1 mm (k), 100μm (l). m, Arterioles/capillaries per BM area (BAT, n = 9 patients; ruxolitinib, n = 8 patients). n, Bone area (BAT, n = 7 patients; ruxolitinib, n = 7 patients). o, Distance between CD34+ HSPCs and the closest arteriole/capillary (BAT, n = 8 patients; ruxolitinib, n = 7 patients). b-d, f-j, m-o, Data are means ± SEM. Each square dot is a mouse or individual. Two-sided Student’s t-test, *p < 0.05; **p < 0.01; ****p < 0.0001. Source data
Extended Data Fig. 6
Extended Data Fig. 6. Effects of JAK inhibitor on HSPC-niche interactions in WT mice.
a-i, WT mice were lethally irradiated, transplanted with BM cells from WT mice (for comparison with mice transplanted with MPN cells) and treated 4w post transplantation with ruxolitinib (70 mg/kg, o.d., 3/w) or vehicle for 5w. a, Outline of the experiment. b-d, BM distribution of the different cell populations in WT mice following chronic treatment with ruxolitinib (n = 6 mice) or vehicle (n = 5 mice). The data represents the ratio of endosteal and central BM cells. b, LinSca1+cKit+ (LSK) CD48CD150+ HSCs. c, LSK HSPCs. d, LSK CD48+CD150 multipotent progenitors (MPPs). e, Frequency of Sca1hiCD31hi arteriolar endothelial cells among CD45Ter119 BM stromal cells in WT mice treated with ruxolitinib (n = 6 mice) or vehicle (n = 5 mice). f, Immunofluorescence of osteopontin (OPN)+ osteoblasts (green) and endomucin (EMCN)+ blood vessels (red). Scale bar, 200μm. g, Quantification of OPN+ bone area (n = 4 mice). h, Trichrome Masson staining of BM sections. i, Frequency of PDGFRα-Sca1CD51+ osteoblast precursors among CD45Ter119CD31 stromal cells in WT mice treated with ruxolitinib (n = 6 mice) or vehicle (n = 5 mice). b-e, g-i, Data are means ± SEM. Each square dot is a mouse. Student’s t-test; *p < 0.05, **p < 0.01. Source data
Extended Data Fig. 7
Extended Data Fig. 7. Gene set enrichment analysis of CDC42-interating proteins in human MPN.
Top 100 featured genes in polycythemia vera (PV, n = 5) and essential thrombocythemia (ET, n = 10) from hHSC RNAseq dataset. Genes in green boxes are related to activation and signalling downstream of CDC42, while genes in red boxes negatively correlate with CDC42 activity. Source data
Extended Data Fig. 8
Extended Data Fig. 8. JAK-STAT signaling differentially regulates HSC CDC42-polarity in MPN subtypes.
a, Frequencies of CDC42-polar HSCs in WT mice at different age (n = 3 mice). b, 3D representation showing the distribution of CDC42 (orange) and DAPI (blue) on polar or apolar HSCs imaged by confocal microscopy using the super resolution mode. c, Frequency of CDC42-polar HSCs isolated from the endosteal or central BM of WT mice 8w after transplantation of WT BM cells (n = 3 mice). d, CDC42 mean fluorescent intensity (MFI) in HSCs from 10-13w-old WT (n = 7 mice), ET-like (n = 4 mice) or PV-like (n = 3 mice) animals. e, Frequency of CDC42-polar HSCs isolated from 10– 13week-old, WT mice injected before (at 8w-old) with poly I:C (n = 4 mice) or vehicle (n = 4 mice). f-q, Blood counts before and 4-5w after CASIN treatment in PV-like (f-k) or ET-like (l-q) mice. f, l: Red blood cells (RBC). g, m, Hemoglobin (HGB). h, n, Lymphocytes (Lym). i, o, Monocytes (Mon). j, p, Granulocytes (Gra). k, q, Eosinophiles (Eos). f-k, Control, n = 11 mice; CASIN, n = 13 mice. l-q, Control, n = 7 mice; CASIN, n = 5 mice. a, c-q, Data are means ± SEM. Each square dot is a mouse. Two-sided Student’s t-test, *p < 0.05; **p < 0.01. Source data
Extended Data Fig. 9
Extended Data Fig. 9. Increased collagen deposition in PV (compared with ET) model and CDC2-polarity loss dependent on JAK2V617F expression.
a, b, WT mice were lethally irradiated, transplanted with BM cells from PV-like or ET-like mice and treated with ruxolitinib (70 mg/kg, o.d., 3/w), CASIN (5 mg/kg/d, 3/w) or vehicle for 5w, starting 4w post-transplantation. a, Immunofluorescence of collagen III (green). Nuclei were counterstained with DAPI (blue). Scale bar, 100μm. b, Collagen III mean fluorescence intensity. Each square dot is a mouse. PV control, n = 7 mice; PV ruxolitinib, n = 5 mice; PV CASIN, n = 5 mice; ET control, n = 4 mice; ET ruxolitinib, n = 3 mice; ET CASIN, n = 4 mice. c, Frequency of CDC42-polar HSCs isolated from 10– 13w-old knock-in mice harboring one (JARR/+) or two (JARR/R) copies of the JAK2-V617F oncogene. WT, n = 6 mice; JARR/+, n = 6 mice; JARR/R, n = 3 mice. b, c, Data are means ± SEM. Two-sided Student’s t-test, *p < 0.05; **p < 0.01. Source data
Extended Data Fig. 10
Extended Data Fig. 10. Model of different niches for mutant stem cells affecting pathogenesis and therapy response in MPN.
a, Flow cytometry showing the gating strategy and preserved immunophenotype of LinSca1+cKit+ (LSK) CD48CD150+ HSCs after fixation and permeabilization, which allowed reliable quantification of phosphorylated (p) STAT proteins. b, Representative flow cytometry diagram showing the expression of pSTAT1 or pSTAT5 in HSCs after exposure to IFNγ or GM-CSF. c, Model of different niches for mutant stem cells affecting pathogenesis and therapy response in MPN. Essential thrombocythemia (ET) and polycythemia vera (PV) hematopoietic stem cells (HSCs) exhibit opposite JAK-STAT dependent alterations in the distribution of the small Rho-GTPase CDC42. PV HSCs become apolar prematurely, while ET HSCs retain high polarity, leading to different lodgment, proliferation and microenvironmental remodeling in central sinusoidal or endosteal BM niches, respectively. Endosteal arterioles and bone increase in ET, while PV causes sinusoidal vasodilatation. The JAK2 inhibitor ruxolitinib restores endosteal the PV-HSC niche but relocates multipotent progenitors (MPP) to the central BM in ET, which possibly explains the variable clinical response to ruxolitinib in these MPN subtypes. Source data

References

    1. Ahmad H, Jahn N, Jaiswal S. Clonal hematopoiesis and its impact on human health. Annu. Rev. Med. 2023;74:249–260. doi: 10.1146/annurev-med-042921-112347. - DOI - PubMed
    1. James C, et al. A unique clonal JAK2 mutation leading to constitutive signalling causes polycythaemia vera. Nature. 2005;434:1144–1148. doi: 10.1038/nature03546. - DOI - PubMed
    1. Kralovics R, et al. A gain-of-function mutation of JAK2 in myeloproliferative disorders. N. Engl. J. Med. 2005;352:1779–1790. doi: 10.1056/NEJMoa051113. - DOI - PubMed
    1. Levine RL, et al. Activating mutation in the tyrosine kinase JAK2 in polycythemia vera, essential thrombocythemia, and myeloid metaplasia with myelofibrosis. Cancer Cell. 2005;7:387–397. doi: 10.1016/j.ccr.2005.03.023. - DOI - PubMed
    1. Baxter EJ, et al. Acquired mutation of the tyrosine kinase JAK2 in human myeloproliferative disorders. Lancet. 2005;365:1054–1061. doi: 10.1016/S0140-6736(05)71142-9. - DOI - PubMed

Publication types

MeSH terms

LinkOut - more resources