. 2023 Sep;55(9):1462-1470.
doi: 10.1038/s41588-023-01464-1. Epub 2023 Aug 7.

Genome-wide analysis of a model-derived binge eating disorder phenotype identifies risk loci and implicates iron metabolism

Affiliations

Genome-wide analysis of a model-derived binge eating disorder phenotype identifies risk loci and implicates iron metabolism

David Burstein et al. Nat Genet. 2023 Sep.

Abstract

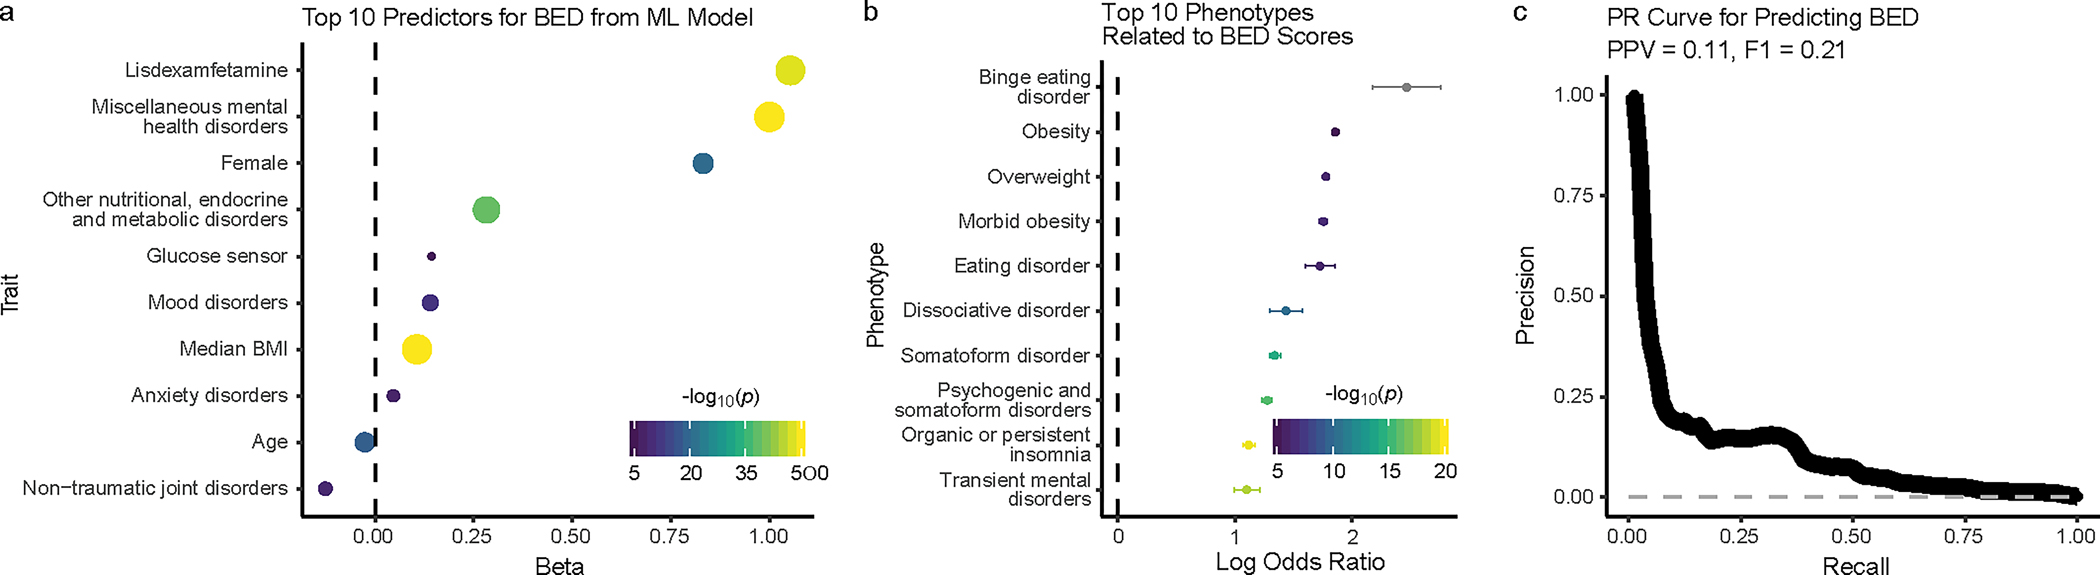
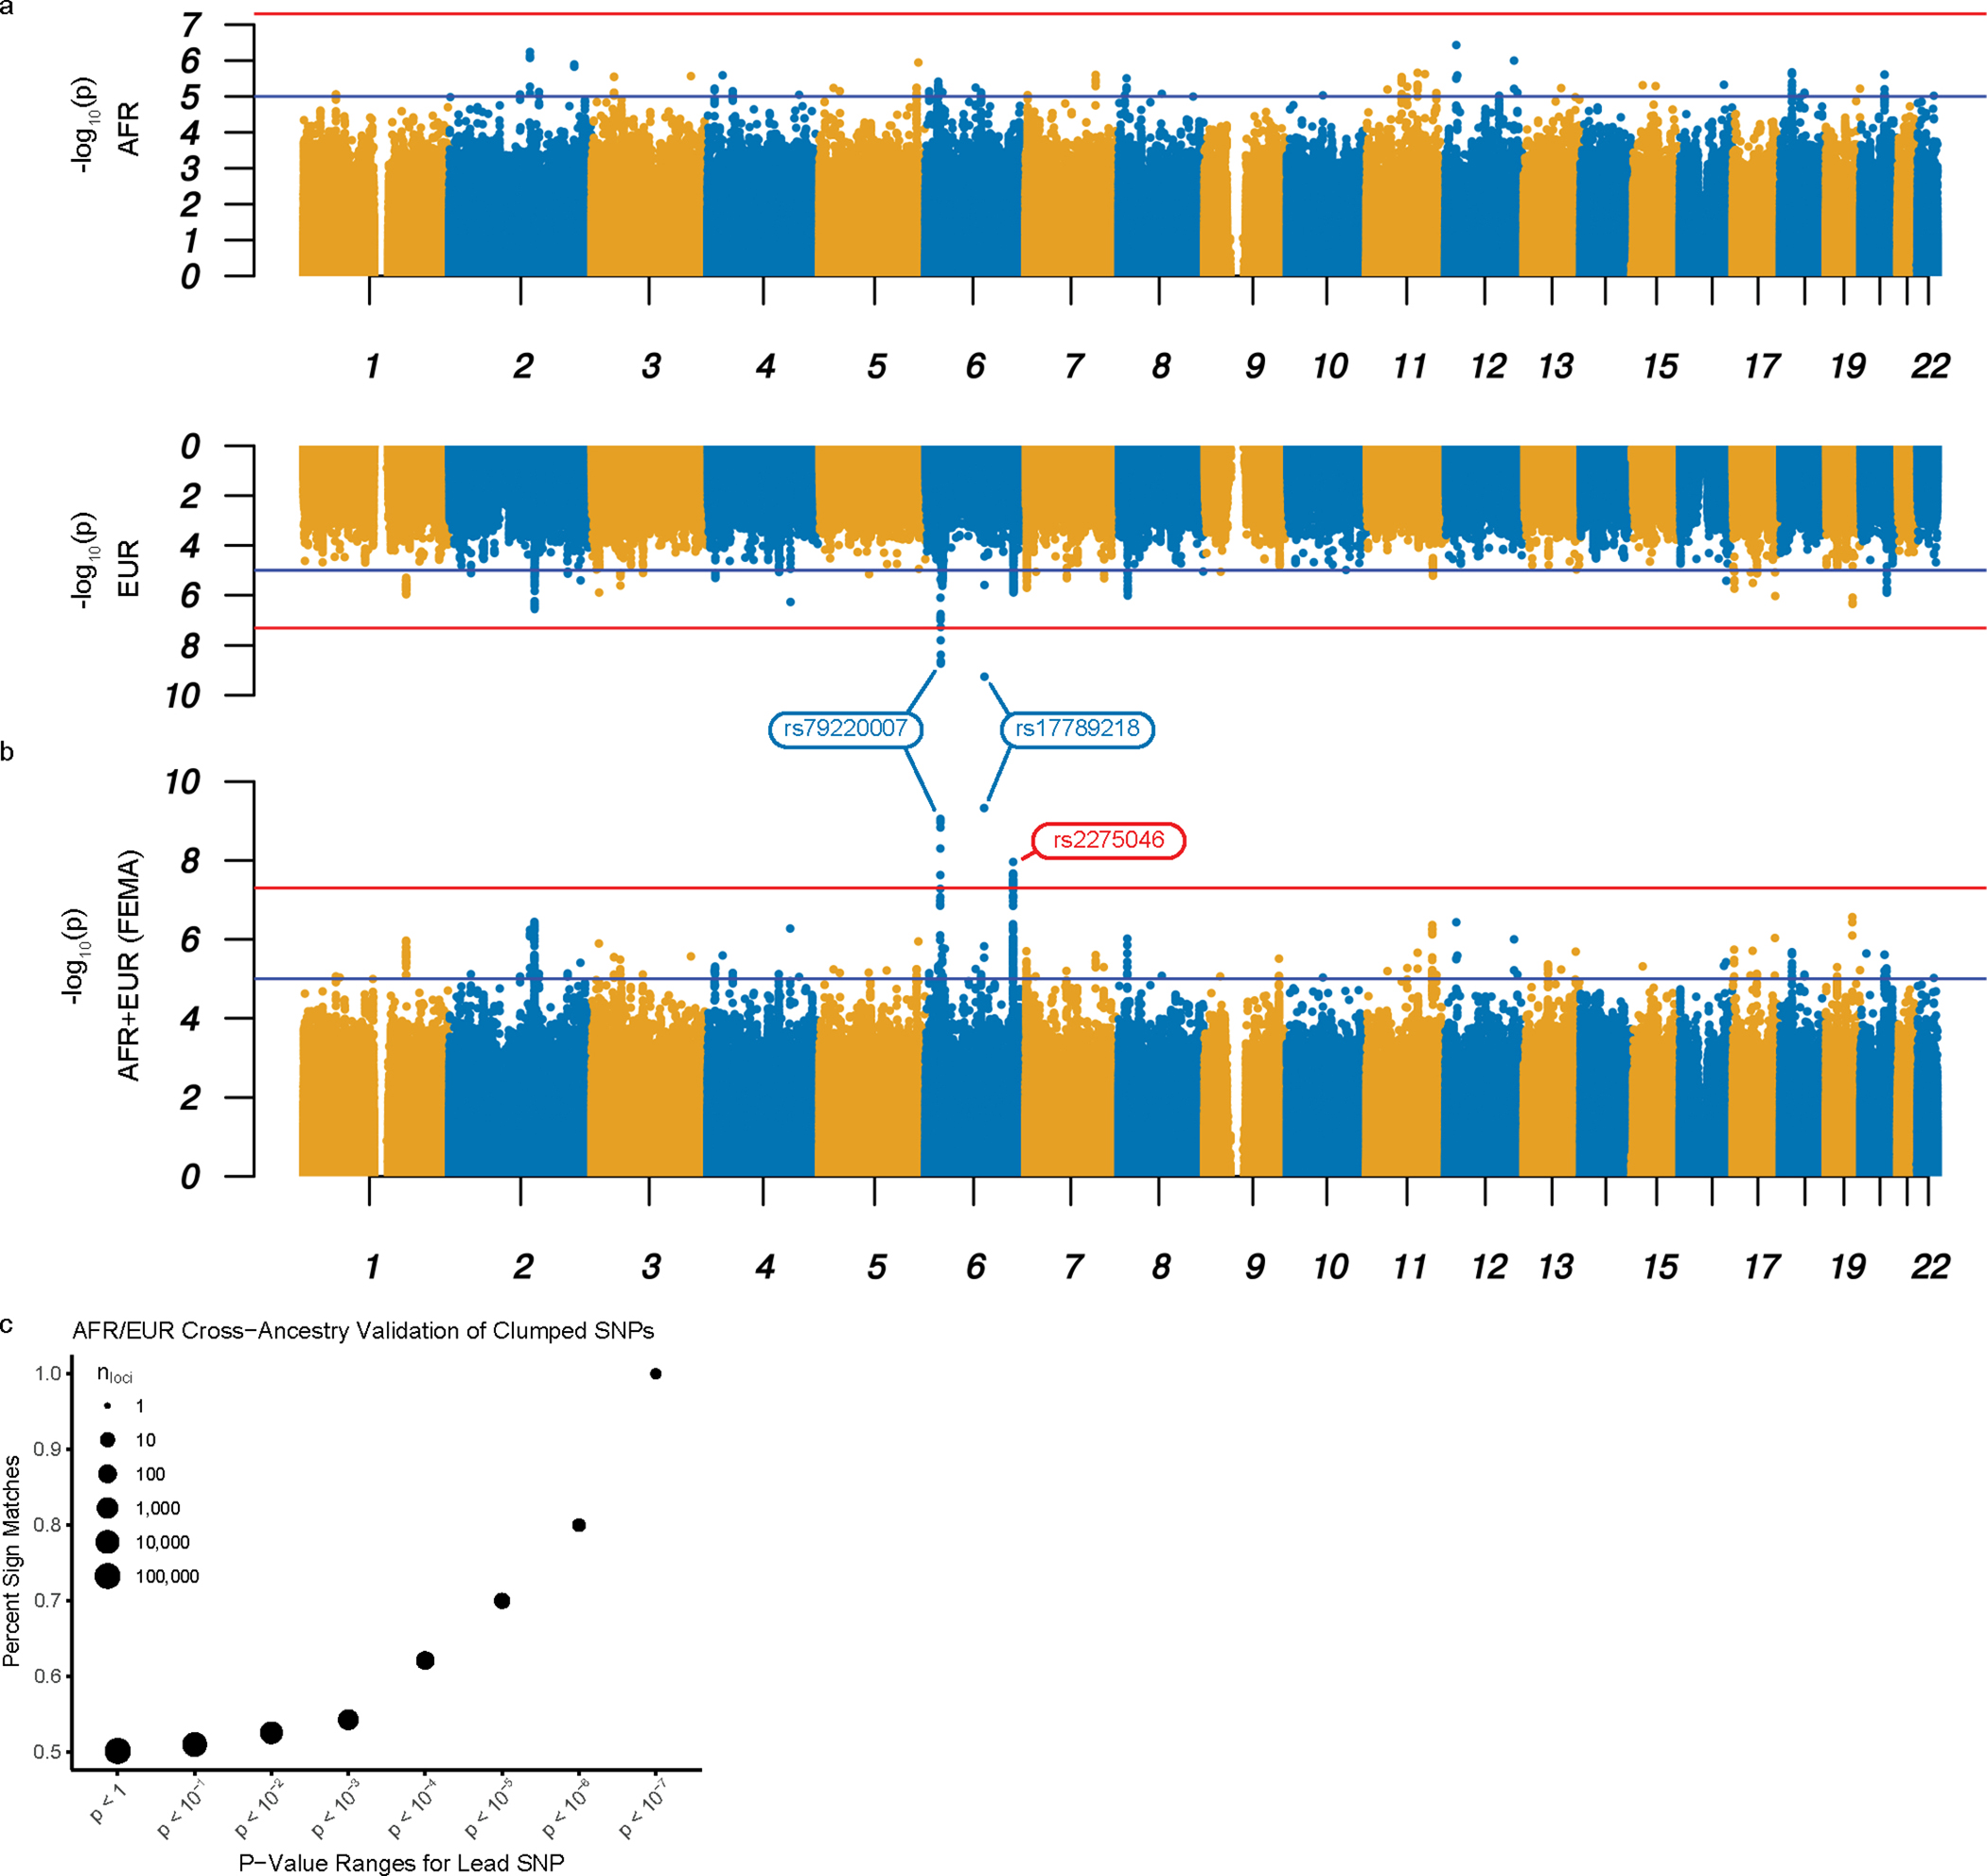
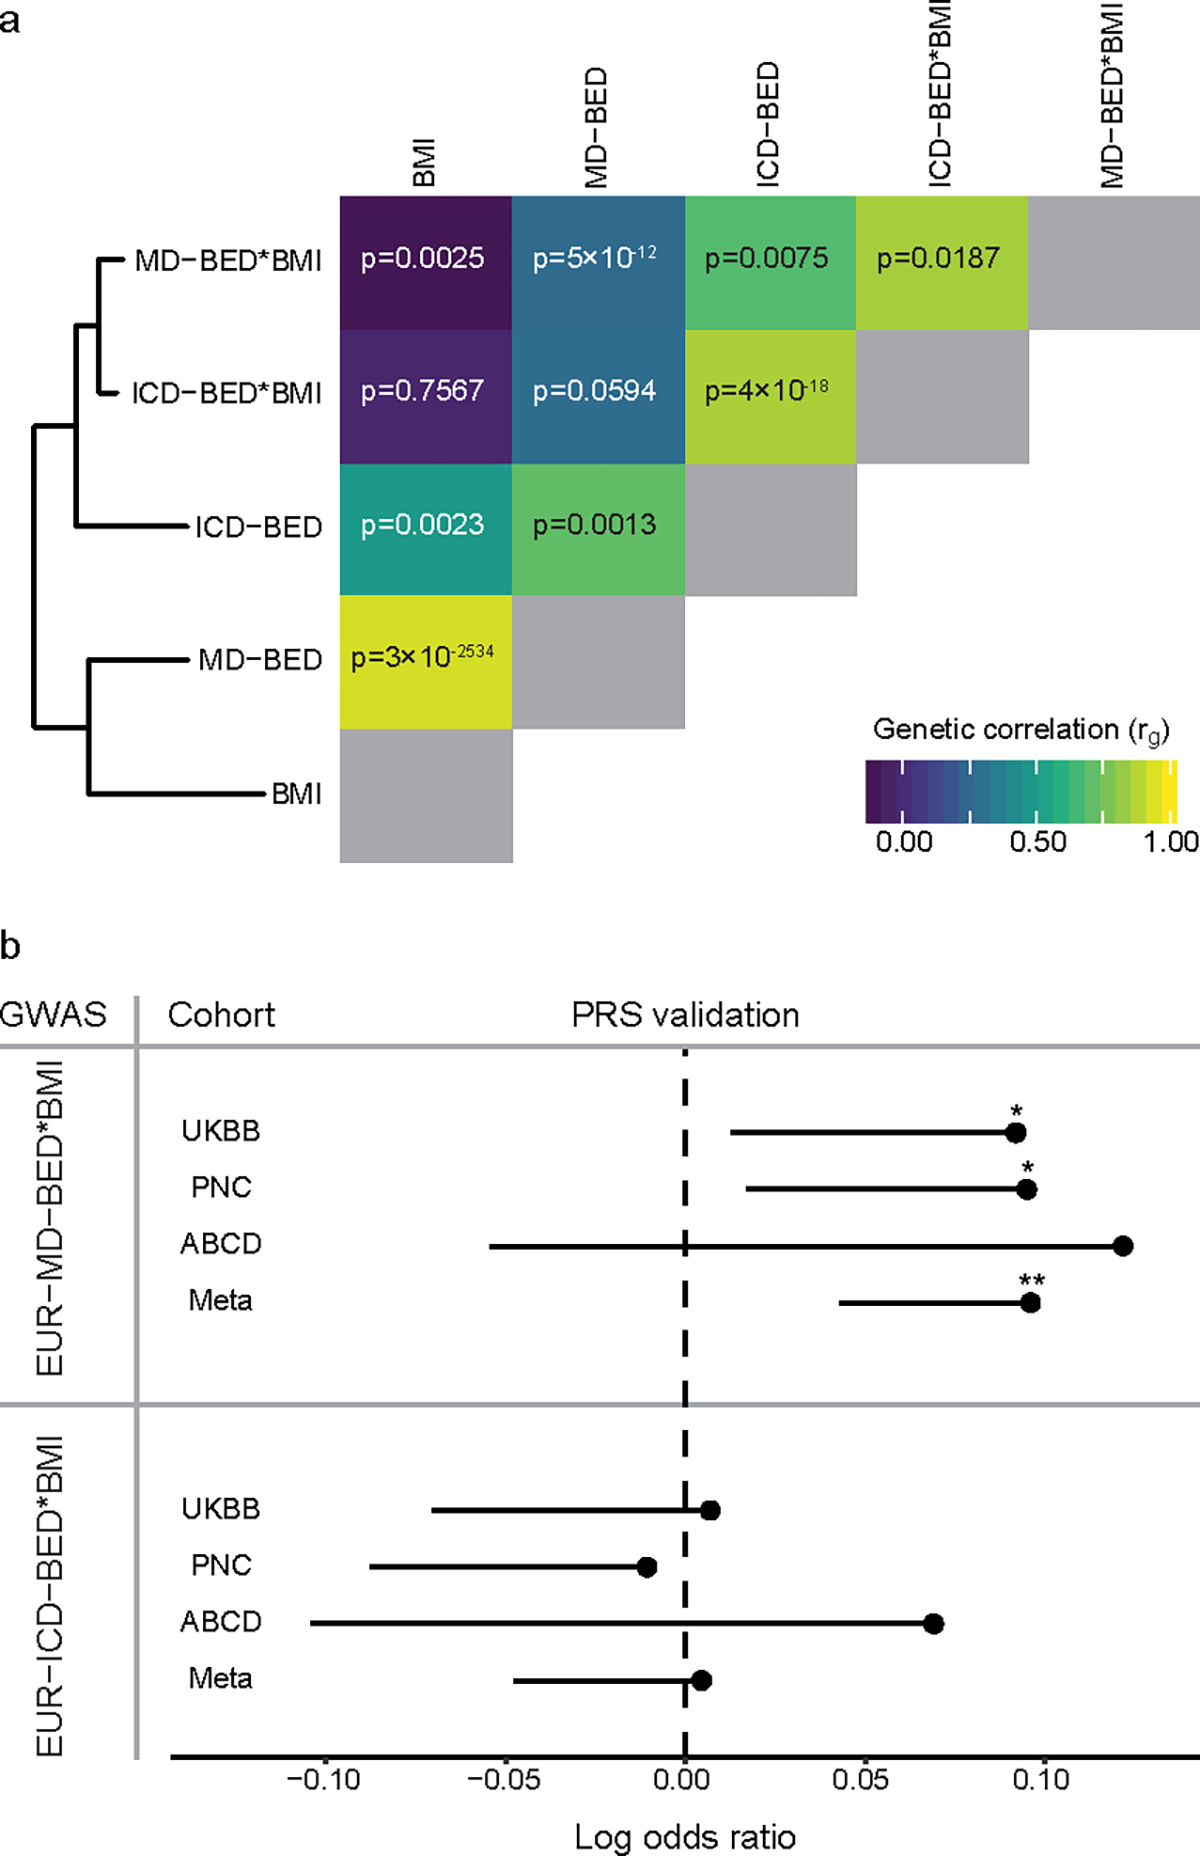
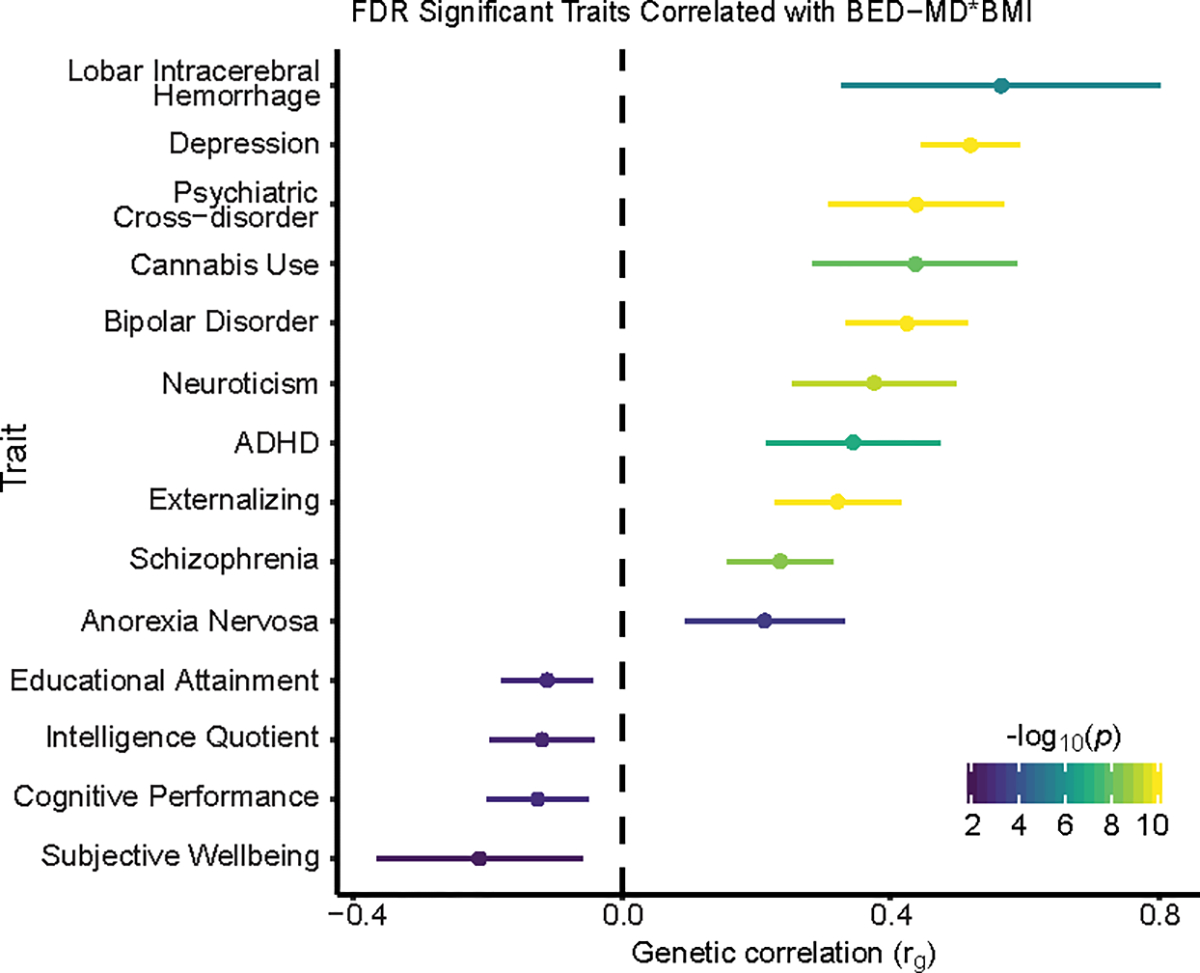
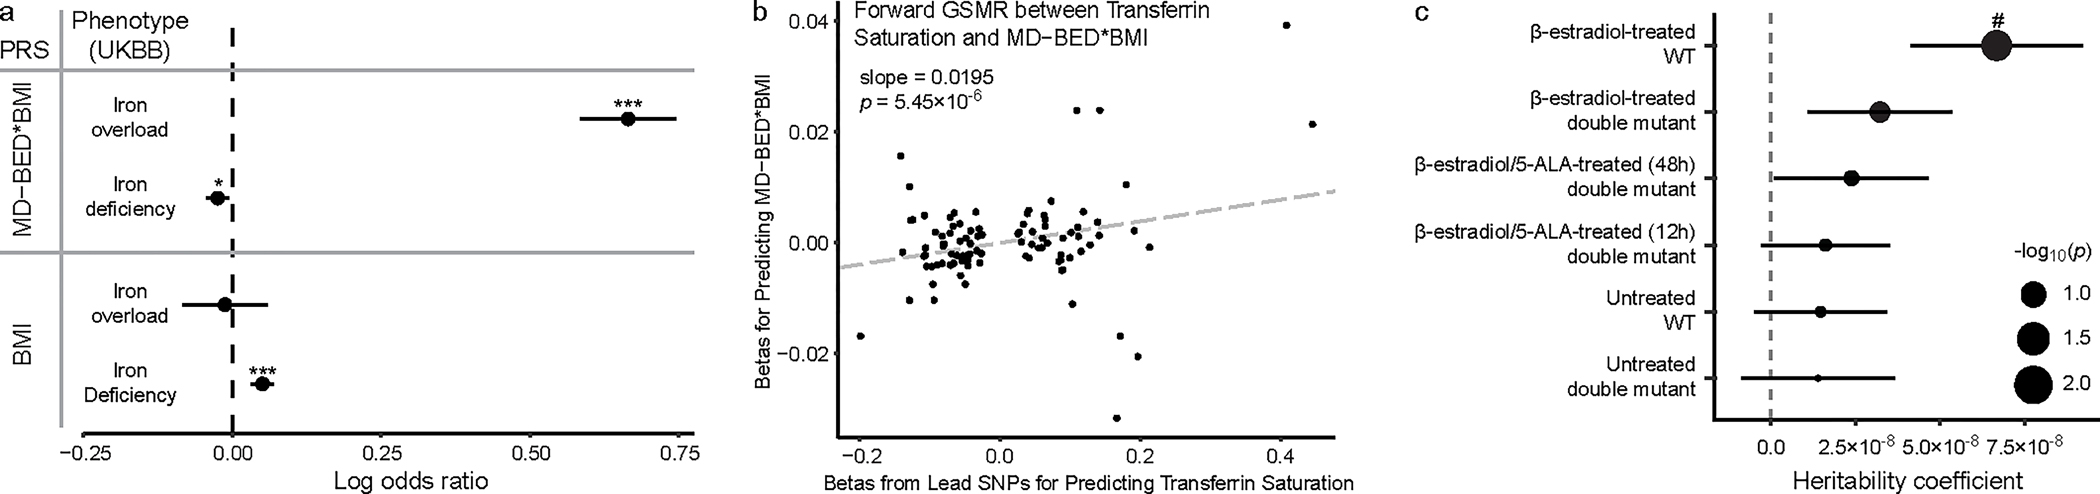
Binge eating disorder (BED) is the most common eating disorder, yet its genetic architecture remains largely unknown. Studying BED is challenging because it is often comorbid with obesity, a common and highly polygenic trait, and it is underdiagnosed in biobank data sets. To address this limitation, we apply a supervised machine-learning approach (using 822 cases of individuals diagnosed with BED) to estimate the probability of each individual having BED based on electronic medical records from the Million Veteran Program. We perform a genome-wide association study of individuals of African (n = 77,574) and European (n = 285,138) ancestry while controlling for body mass index to identify three independent loci near the HFE, MCHR2 and LRP11 genes and suggest APOE as a risk gene for BED. We identify shared heritability between BED and several neuropsychiatric traits, and implicate iron metabolism in the pathophysiology of BED. Overall, our findings provide insights into the genetics underlying BED and suggest directions for future translational research.


Conflict of interest statement

Competing Interests Statement

Dr. Hildebrandt is a scientific advisory board member of Noom, Inc. and Drs. Hildebrandt and Sysko receive funding from and have equity in Noom, Inc. (non-publicly traded company). Dr. Sysko receives royalties from Wolters Kluwer Health.

Figures

Fig. 1:
Fig. 1:. Machine learning model to predict BED within the MVP
a, Top 10 predictors from the machine learning LASSO logistic regression model for predicting BED (y axis). To rank the predictors, uncorrected P values with a Wald Z-Test were computed from an analogous unpenalized logistic regression model. The strength of the statistical association (from the LASSO regression) is represented on the x axis as beta and in the size and color of the data points, corresponding to the negative log10 of uncorrected two-sided P value (−log10p). The dashed gray line is at 0 on the x axis. P values smaller than 10−50 are capped at that value. b, The ten phenotypes with the strongest association with our model-derived BED scores from an independent logistic regression on a hold-out set are shown on the y axis. The strength of the association is shown on the x axis as mean log odds ratio with the two-sided 95% confidence interval. The strength of the statistical association (comparing the prediction of BED vs. each phecode) is represented by the color of the data points, corresponding to the negative log10 of the uncorrected two-sided P value (−log10p) generated from a one-sided difference of means Z-test. As we tested whether the log odds ratio for BED is higher than the log odds ratio for the other phenotype, no test was performed on BED and it is colored gray. The dashed gray line is at 0 on the x axis. c, Precision recall (PR) curve (thick black line) for predicting BED in a stratified test set containing 10% of the data. The x axis shows the recall rate and the y axis shows the precision. Positive predictive value (PPV) is 0.11 with a phenotype prevalence of 0.001. F1 score is 21%. The dashed gray line represents chance performance.
Fig. 2:
Fig. 2:. Bi-ancestral GWAS of BED
a-b, Miami plot for the AFR-MD-BED*BM (top) and EUR-MD-BED*BMI (bottom) GWAS (a); Manhattan plot for the FEMA-MD-BED*BMI GWAS (b). The x axis denotes the chromosome and position of the corresponding SNP. The strength of the SNP-phenotype association is on the y axis as the negative log10 of uncorrected two-sided P value (−log10p) generated from a two-sided T-test. The red lines represent genome-wide significance (p = 5.0×10⁻⁸). The blue lines represent the suggestive genome-wide association threshold (p = 1.0×10⁻⁵). Genome-wide significant hits shared by EUR and FEMA GWAS are labeled blue and were confirmed in the EUR replication cohort; the unique genome-wide significant hit in FEMA is labeled red and was not replicated in the EUR replication cohort. c, Sign test between the effect sizes of AFR-MD-BED*BMI and EUR-MD-BED*BMI with progressive restriction of the SNP inclusion threshold. The percentage of clumped SNPs with the same sign is shown on the y axis. The threshold below which lead SNPs were included in the correlation analysis is shown on the x axis as the uncorrected two-sided P value. The size of the point denotes the log10 count of the included loci.
Fig. 3:
Fig. 3:. Validation of the MD-BED phenotype
a, On the left is a hierarchical clustering of five EUR BED-related phenotypes. On the right is a heat map of the genetic correlation matrix. The diagonal genetic correlation entries in gray represent a correlation of 1 between each GWAS and itself. Genetic correlation values for each comparison are shown on the heat map. b, PRS validation of EUR-MD-BED*BMI and EUR-ICD-BED*BMI GWAS with UKBB (cases = 461), PNC (cases = 531), ABCD (cases = 94) and a meta-analysis of those cohorts. The MVP (vertical) and external (horizontal) cohorts are shown on the y axis. The mean log odds ratio for the PRS predictor is shown on the x axis. Confidence intervals are one-sided standard errors and uncorrected P values are generated using a one-sided Wald Z-test. *p < 0.05. **p < 0.01. P values for validating the MD-BED*BMI PRS are: UKBB, p = 0.03; PNC, p = 0.02; ABCD, p = 0.13; Meta, p = 0.001. P values for validating the BED-ICD PRS are: UKBB, p = 0.44; PNC, p = 0.59; ABCD, p = 0.26; Meta, p = 0.44.
Fig. 4:
Fig. 4:. Genetic correlation with other traits
Traits with significant genetic correlation to EUR-MD-BED*BMI at the FDR significant threshold (q < 0.05) from our curated set of GWAS are ranked by rg on the y axis. The strength of the averaged genetic correlation is shown on the x axis as rg with the 95% confidence interval for each trait shown and through the color of the error bar corresponding to the uncorrected P value as generated from a two-sided Z-test when performing LD Score regression. P values smaller than 10−10 are capped at that value.
Fig. 5:
Fig. 5:. Iron overload in BED
a, PRS associations between EUR-MD-BED*BMI and EUR-BMI GWAS and iron overload (n = 790 cases, n = 385,100 controls) and iron deficiency (n = 11,247 cases, n = 374,643 controls). PRS scores and iron phenotypes are on the y axis. The coefficients, as log odds ratios (mean ± s.e.m.), from the logistic regression for PRS predictors are on the x axis. EUR-MD-BED*BMI PRS predicts iron overload (p = 1.62×10−60) and iron deficiency (p = 0.01). EUR-BMI PRS predicts iron deficiency (p = 1.03×10⁻⁷) but not iron overload (p = 0.73). *p < 0.05. ***p < 0.001. b, Scatter plot with generalized linear regression from GSMR between lead SNPs from the transferrin saturation GWAS from deCODE and INTERVAL and EUR-MD-BED*BMI. Transferrin saturation lead SNP betas are on the x axis. EUR-MD-BED*BMI betas are on the y axis. P values from GSMR are from a two-sided Z-test. c, Enrichment of BED risk variant-homologs in open chromatin regions (OCR) in wild type (WT) and heme-deficient mutant murine erythroid cells treated with β-estradiol and/or 5-aminolevulinic acid hydrochloride (5-ALA) (β-estradiol-treated WT: n = 1,010,459 OCR, p = 0.005; β-estradiol-treated double-mutant: n = 1,263,093 OCR, p = 0.07; β-estradiol/5-ALA-treated (48hr) double mutant: n = 1,229,810 OCR, p = 0.15; β-estradiol/5-ALA-treated (12hr) double mutant: n = 1,229,810 OCR, p = 0.20; Untreated WT: n = 1,488,490 OCR, p = 0.23; Untreated double mutant: n = 1,001,591 OCR, p = 0.27). Cell lines are on the y axis. Heritability is on the x axis. Positive coefficients signify enriched heritability. Dot size reflects negative log10 of uncorrected P value (−log10p) from a two-sided LD Score regression Z-test. Error bars indicate standard errors from LD Score regression mean estimates. #p < 0.05 after FDR correction.

References

    1. Mitchell KS et al. Binge eating disorder: a symptom-level investigation of genetic and environmental influences on liability. Psychol. Med. 40, 1899–1906 (2010). - PMC - PubMed
    1. Reichborn-Kjennerud T, Bulik CM, Tambs K & Harris JR Genetic and environmental influences on binge eating in the absence of compensatory behaviors: a population-based twin study. Int. J. Eat. Disord. 36, 307–314 (2004). - PubMed
    1. Udo T & Grilo CM Prevalence and Correlates of DSM-5-Defined Eating Disorders in a Nationally Representative Sample of U.S. Adults. Biol. Psychiatry 84, 345–354 (2018). - PMC - PubMed
    1. Brownley KA et al. Binge-Eating Disorder in Adults: A Systematic Review and Meta-analysis. Ann. Intern. Med. 165, 409–420 (2016). - PMC - PubMed
    1. Wonderlich SA, Gordon KH, Mitchell JE, Crosby RD & Engel SG The validity and clinical utility of binge eating disorder. Int. J. Eat. Disord. 42, 687–705 (2009). - PubMed

Methods-only references

    1. Harrington KM et al. Gender differences in demographic and health characteristics of the million veteran program cohort. Women’s Health Issues 29 Suppl 1, S56–S66 (2019). - PMC - PubMed
    1. Gelernter J et al. Genome-wide association study of post-traumatic stress disorder reexperiencing symptoms in >165,000 US veterans. Nat. Neurosci. 22, 1394–1401 (2019). - PMC - PubMed
    1. Fang H et al. Harmonizing Genetic Ancestry and Self-identified Race/Ethnicity in Genome-wide Association Studies. Am. J. Hum. Genet. 105, 763–772 (2019). - PMC - PubMed
    1. 1000 Genomes Project Consortium et al. An integrated map of genetic variation from 1,092 human genomes. Nature 491, 56–65 (2012). - PMC - PubMed
    1. Karcher NR & Barch DM The ABCD study: understanding the development of risk for mental and physical health outcomes. Neuropsychopharmacology 46, 131–142 (2021). - PMC - PubMed

Publication types