. 2023 Aug;5(8):1423-1439.
doi: 10.1038/s42255-023-00856-1. Epub 2023 Aug 7.

Asparagine restriction enhances CD8+ T cell metabolic fitness and antitumoral functionality through an NRF2-dependent stress response

Affiliations

Asparagine restriction enhances CD8+ T cell metabolic fitness and antitumoral functionality through an NRF2-dependent stress response

J N Rashida Gnanaprakasam et al. Nat Metab. 2023 Aug.

Abstract

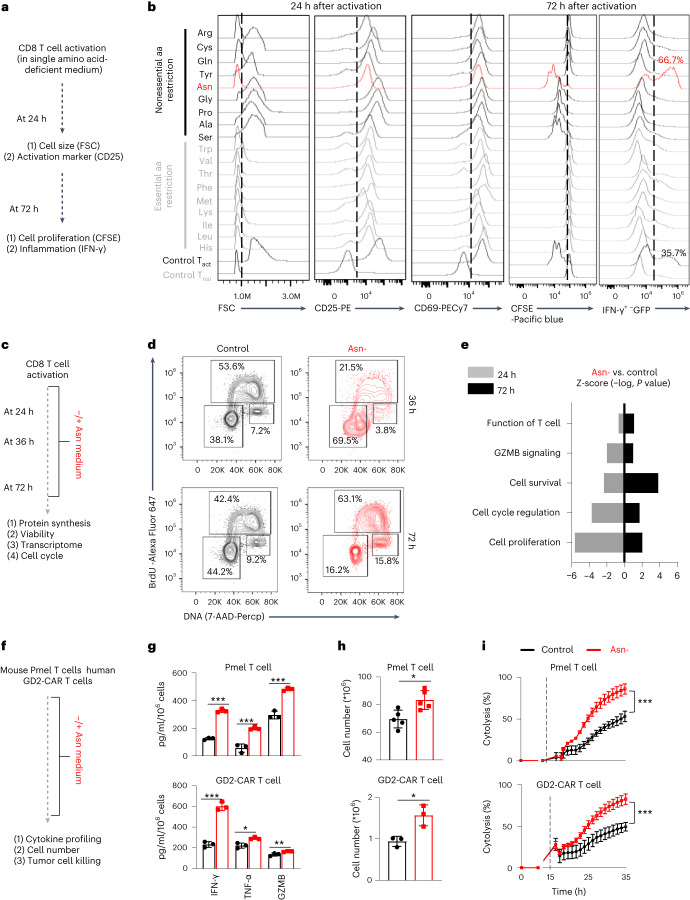
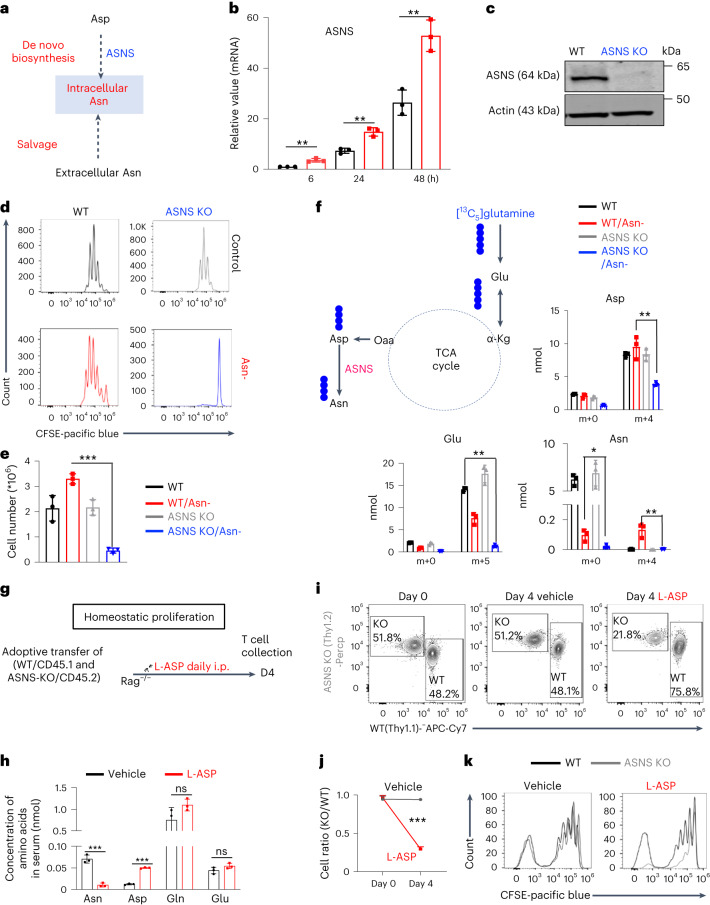
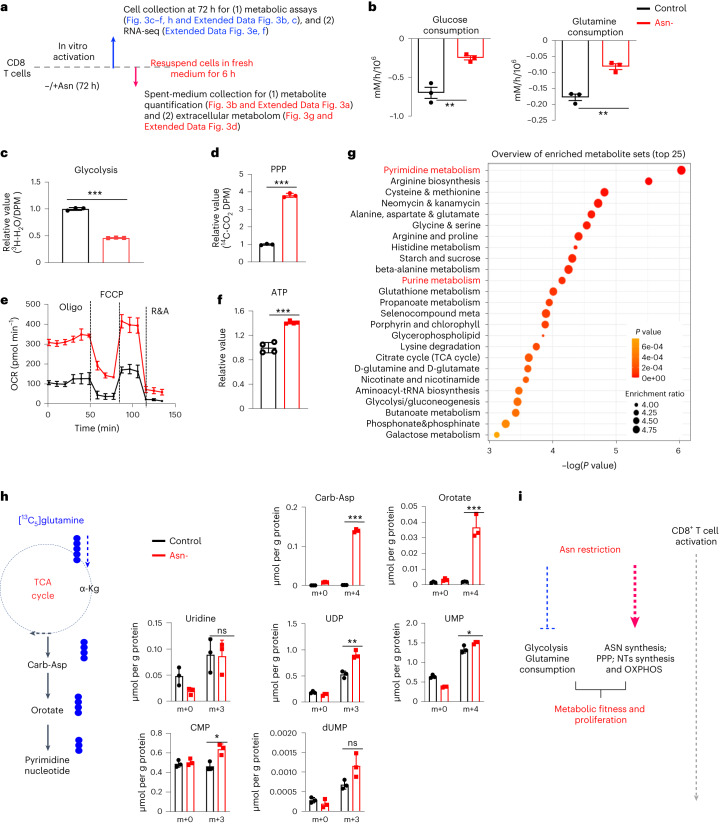
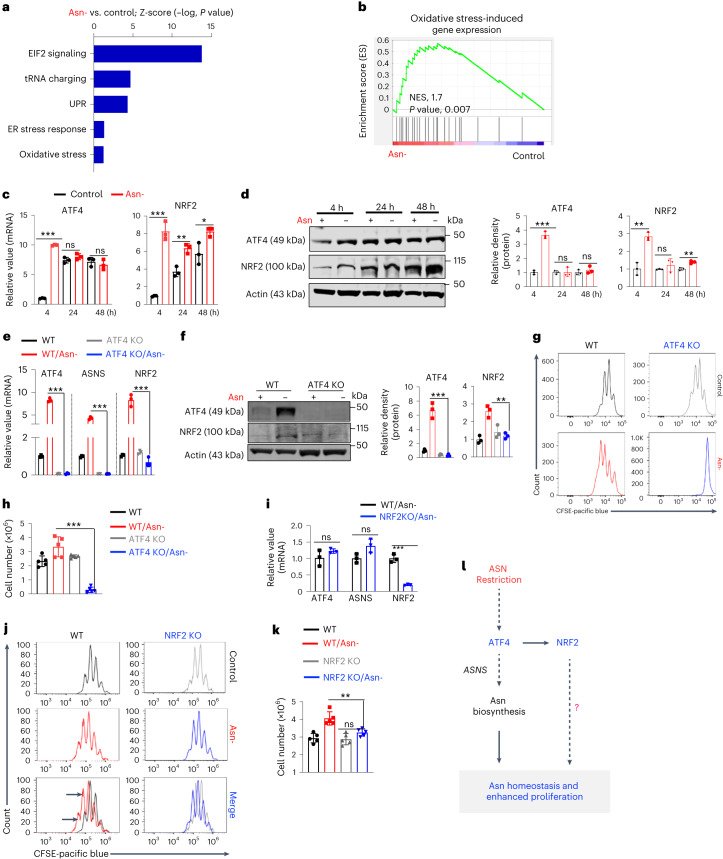
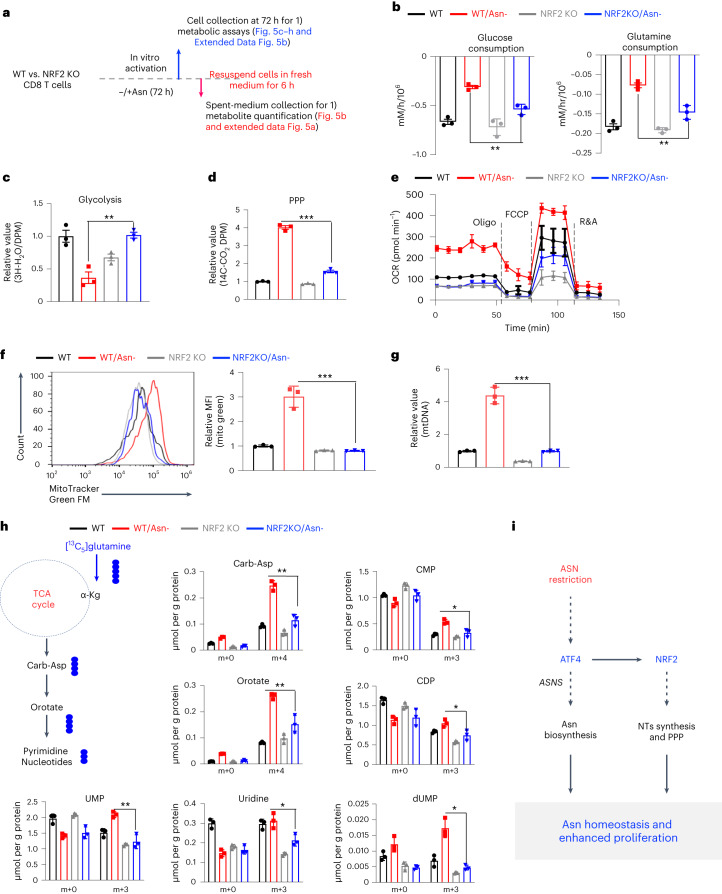
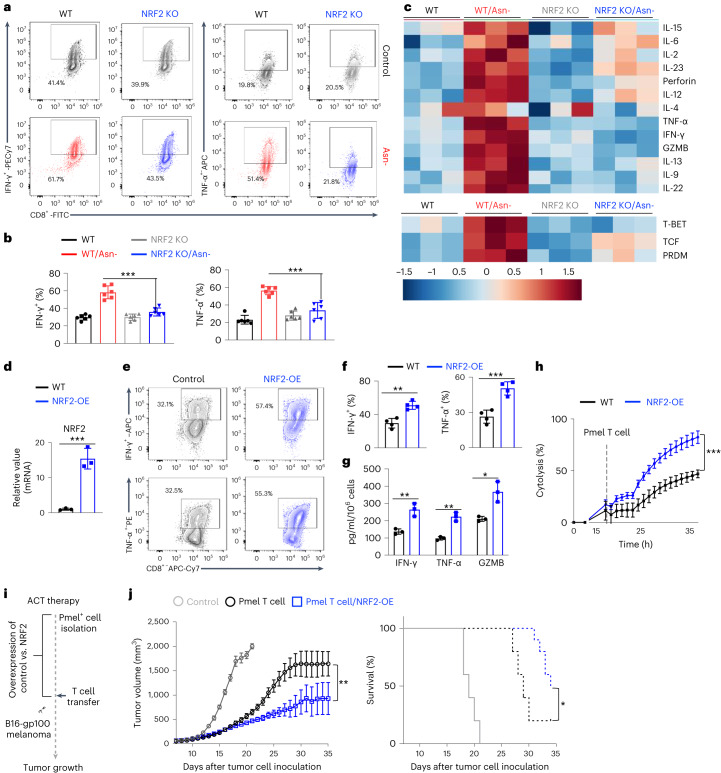
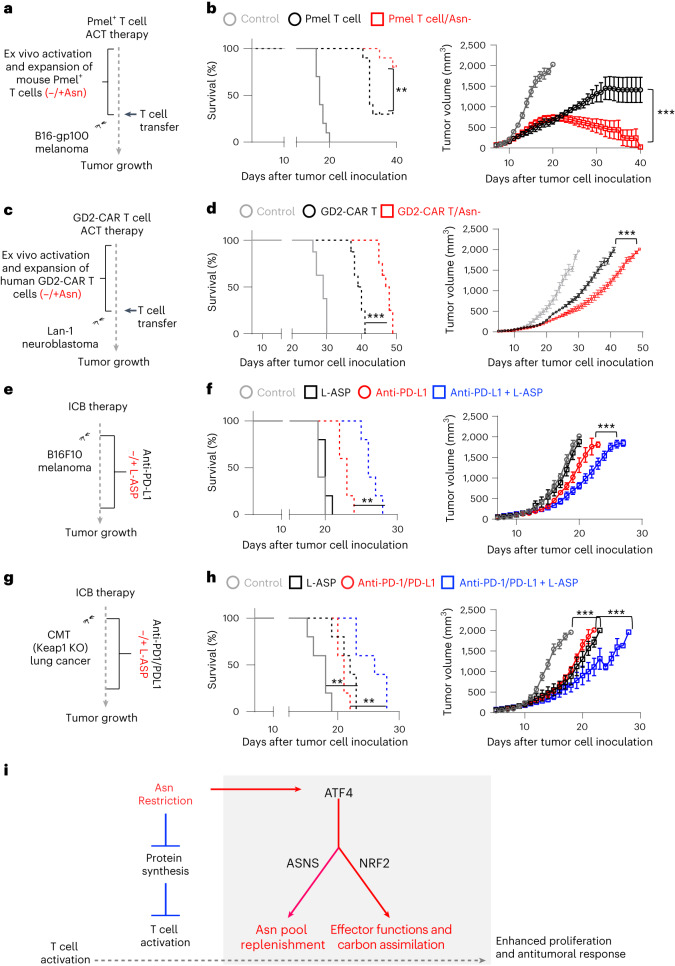
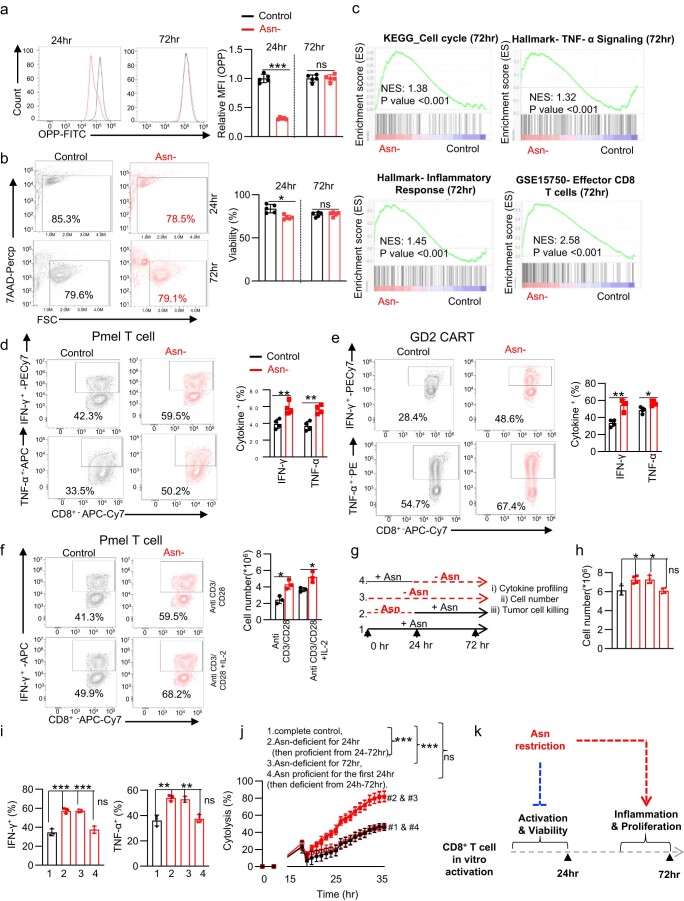
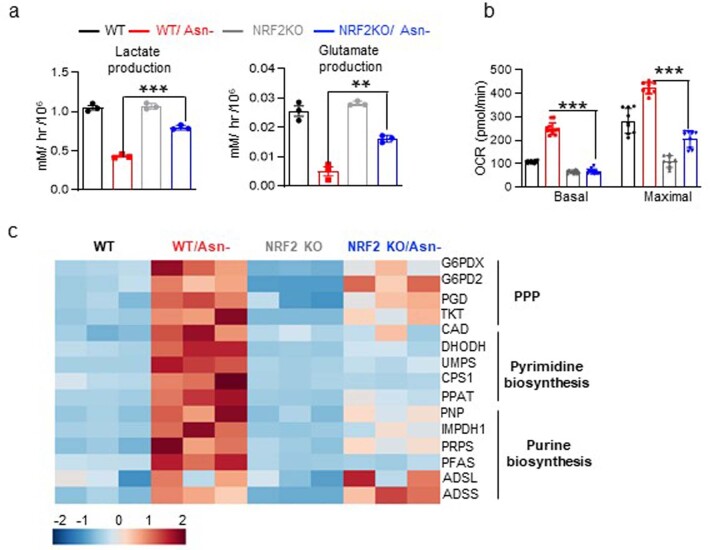
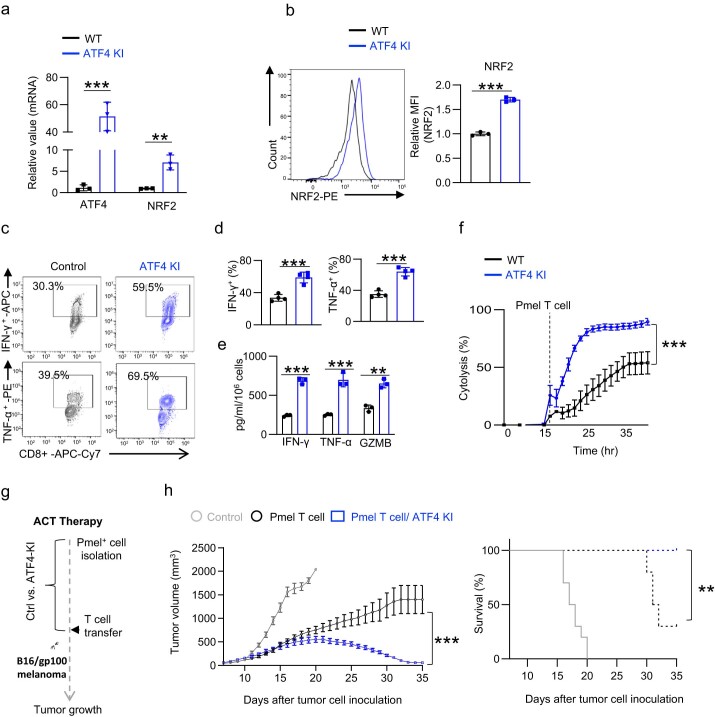
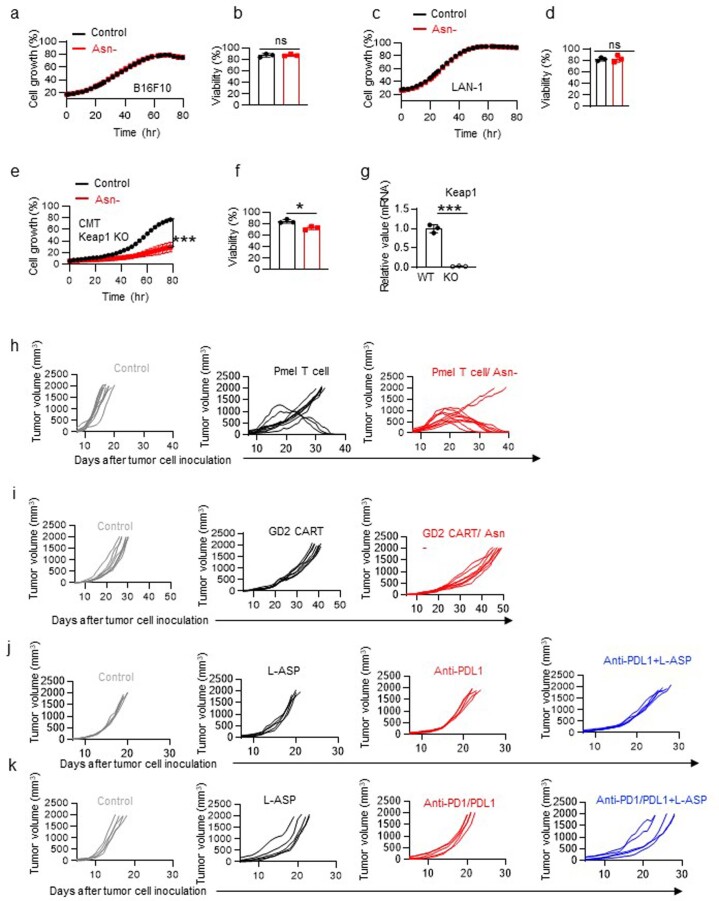
Robust and effective T cell immune surveillance and cancer immunotherapy require proper allocation of metabolic resources to sustain energetically costly processes, including growth and cytokine production. Here, we show that asparagine (Asn) restriction on CD8+ T cells exerted opposing effects during activation (early phase) and differentiation (late phase) following T cell activation. Asn restriction suppressed activation and cell cycle entry in the early phase while rapidly engaging the nuclear factor erythroid 2-related factor 2 (NRF2)-dependent stress response, conferring robust proliferation and effector function on CD8+ T cells during differentiation. Mechanistically, NRF2 activation in CD8+ T cells conferred by Asn restriction rewired the metabolic program by reducing the overall glucose and glutamine consumption but increasing intracellular nucleotides to promote proliferation. Accordingly, Asn restriction or NRF2 activation potentiated the T cell-mediated antitumoral response in preclinical animal models, suggesting that Asn restriction is a promising and clinically relevant strategy to enhance cancer immunotherapy. Our study revealed Asn as a critical metabolic node in directing the stress signaling to shape T cell metabolic fitness and effector functions.


Conflict of interest statement

The authors declare no competing interests.

Figures

Fig. 1
Fig. 1. Asn restriction enhances CD8+ T cell proliferation and effector functions in vitro.
a, Schematic diagram of comprehensively profiled T cell activation, proliferation and IFN-γ production under single amino acid-deficient conditions. FSC, forward scatter. b, CD8+ T cells were activated in a complete medium or indicated single amino acid-deficient medium. Cell size (FSC) and cell surface expression of CD25 and CD69 were determined by flow cytometry in the early phase (24 h). Proliferation (CFSE) and intercellular expression of IFN-γ were determined by flow cytometry in the late phase (72 h). Flow plots are representative of two independent experiments. aa, amino acid; Tnai, Naive CD8+ T cells; Tact, Active CD8+ T cells. c, Schematic diagram of sample collection and assays. d,e, CD8+ T cells were activated in a medium with or without Asn and were collected in the early phase (24–36 h) and late phase (72 h). The cell cycle profile (d) was determined by BrdU incorporation and 7-AAD staining by flow cytometry. The numbers indicate the percentage of cells in the cell cycle stage (n = 3 experimental replicates). Data are representative of three independent experiments. Comparative differently expressed gene signatures (e) were determined by the Ingenuity pathway analysis (IPA) of RNA-seq and listed according to their z-score. Data are representative of one experiment. f, Schematic diagram of in vitro assays. gi, Indicated proteins in culture supernatants were quantified by ELISA and LEGENDplex (g) (n = 3 experimental replicates; upper panel: P < 0.0001, P = 0.015 and P = 0.0004 for IFN-γ, TNF-α and GZMB, respectively; lower panel: P = 0.002, P = 0.0111 and P = 0.0274 for IFN-γ, TNF-α and GZMB, respectively). The cell number was determined by a cell counter (h) (n = 3 experimental replicates for GD2-CAR T cells and n = 5 experimental replicates for Pmel T cells; P = 0.0108 and P = 0.0176 for the upper and lower panels, respectively). The cytolysis was determined by eSight (i) (n = 3 experimental replicates; P = < 0.0001). Data in gi are representative of three independent experiments. Error bars are mean ± s.d. *P < 0.05; **P < 0.01; ***P < 0.001. Statistical differences were determined by paired two-tailed Student’s t-test (e), unpaired two-tailed Student’s t-test (g, h) and two-way ANOVA (i). Source data
Fig. 2
Fig. 2. Asn restriction renders CD8+ T cells dependent on Asn de novo synthesis.
a, Conceptual diagram of maintaining the intracellular Asn pool in T cells. b, ASNS mRNA expression in the indicated groups was determined by quantitative PCR (qPCR) (n = 3 experimental replicates; P = 0.0036, P = 0.0027 and P = 0046 for 6 h, 24 h and 48 h, respectively). Data are representative of two independent experiments. c, The indicated protein was determined by immunoblot. Data are representative of three independent western blot experiments. d,e, CD8+ T cells with the indicated genotype were activated in a medium with or without Asn. Cell proliferation (CFSE) (d) was determined by flow cytometry. Cell number (e) was determined by a cell counter (n = 3 experimental replicates; P < 0.0001). Data in d and e are representative of three independent experiments. f, Diagram of [13C5]glutamine catabolism through entering the downstream TCA cycle and Asn biosynthesis. Filled circles denote the 13C label of all carbons of indicated metabolites derived from [13C5]glutamine catabolism (left panel). Metabolites in the indicated groups were analyzed by GC–MS (right panel); numbers on the x axis represent those of 13C atoms in given metabolites, and numbers on the y axis represent the levels of the metabolites (nmol per protein). n = 3 experimental replicates; P = 0.0048, P = 0.0012 and P = 0.0086 for Asp, Glu and Asn, respectively. Data are representative of one experiment. g, Schematic diagram of in vivo competitive proliferation. h, Mouse serum Asn, Asp, Gln and Glu levels were quantified by GC–MS (n = 3 mice per group; P = 0.0006, P < 0.0001, P = 0.134 and P = 0.8018 for Asn, Asp, Gln and Glu, respectively). Data are representative of two independent experiments. ik, The donor cell ratios before and after adoptive transfer were determined by surface staining of isogenic markers (i), and cell ratio was calculated (j) (P = 0.0005). Cell proliferation was determined by CFSE dilution (k). Data in ik are representative of three independent experiments (n = 3 mice per group). Error bars represent mean ± s.d. *P < 0.05; **P < 0.01; ***P < 0.001; ns, not significant. Statistical differences were determined by unpaired two-tailed Student’s t-test (b, e, f and h) and paired two-tailed Student’s t-test (j). Source data
Fig. 3
Fig. 3. Asn restriction reduces carbon consumption but promotes nucleotide biosynthesis.
a, Schematic diagram of sample collection and assays. b, The indicated metabolites were quantified by the YSI bioanalyzer. Consumption was determined by calculating the difference between blank and spent medium (6-h incubation of T cells collected in the late phase (72 h)) (n = 3 experimental replicates; P = 0.0043 and P = 0.002 for glucose and glutamine consumption, respectively). c,d, T cells were collected in the late phase (72 h). Glycolysis activity (c) (n = 3 experimental replicates; P < 0.0001) and PPP activity (d) (n = 3 experimental replicates; P < 0.0001) were determined by measuring 3H2O generated from D-[5-3H(N)]glucose and 14CO2 generated from [1-14C]D-glucose, respectively. e, OCR (in the late phase (72 h)) was determined by Seahorse (n = 3 experimental replicates; P < 0.0001), R&A, Rotenone and Antimycin A. f, ATP levels (in the late phase (72 h)) were determined by the CellTiter-Glo 2.0 Assay kit (n = 3 experimental replicates; P < 0.0001). Data in bf are representative of three independent experiments. g, Kyoto Encyclopedia of Genes and Genomes (KEGG) enrichment analysis of the changes of extracellular metabolites (6 h spent medium). The figure is plotted with the first 25 pathways. h, Diagram of [13C5]glutamine catabolism through entering the downstream TCA cycle and pyrimidine biosynthesis. Filled circles denote the 13C label of all carbons of indicated metabolites derived from [13C5]glutamine catabolism (left panel). Metabolites in cells (in the late phase (72 h)) were analyzed by IC–UHR-FTMS (right panel); numbers on the x axis represent those of 13C atoms in given metabolites, and numbers on the y axis represent the levels of the metabolites (μmol per g protein). Carb-Asp, N-carbamoyl-L-aspartate; UDP, uridine diphosphate; UMP, uridine monophosphate; CMP, cytidine monophosphate; dUMP, deoxyuridine monophosphate. n = 3 experimental replicates; P < 0.0001, P = 0.0014, P = 0.9185, P = 0.003, P = 0.0418, P = 0.0118 and P = 0.0617 for Carb-Asp, orotate, uridine, UDP, UMP, CMP and dUMP, respectively. Data are representative of two independent experiments. Error bars represent mean ± s.d. *P < 0.05; **P < 0.01; ***P < 0.001. Statistical differences were determined by unpaired two-tailed Student’s t-test (bd, f and h) and paired two-tailed Student’s t-test (e). MetaboAnalyst (v5.0) generated enrichment plots with a significance threshold of P < 0.05 (g). i, The conceptual model of Asn restriction improved Teff cell metabolic fitness and proliferation by reducing carbon consumption but increasing the production of the intracellular nucleotide pool. ASN, asparagine; NTs, nucleotides; OXPHOS, oxidative phosphorylation. Source data
Fig. 4
Fig. 4. Asn restriction promotes CD8+ T cell proliferation by enhancing ATF4 and NRF2 expression.
a, Differently expressed gene signatures were determined by the IPA of RNA-seq (cells collected 4 h after activation) and listed according to their z-score (n = 3 experimental replicates). Data are representative of one experiment. ER, endoplasmic reticulum. b, Oxidative stress-induced gene sets were analyzed by gene set enrichment analysis (GSEA). NES, normalized enrichment score. c,d, CD8+ T cells were activated in a medium with or without Asn for the indicated time. mRNA levels and protein levels of indicated molecules were determined by qPCR (c) (n = 3 experimental replicates; ATF4: P < 0.0001, P = 0.2149 and P = 0.4741 for 4 h, 24 h and 48 h, respectively; NRF2: P = 0.0003, P = 0.0039 and P = 0.0303 for 4 h, 24 h and 48 h, respectively). Immunoblot and its quantification were done by ImageJ (v1.53T) (d) (ATF4: P < 0.0001, P = 0.9668 and P = 0.4 for 4 h, 24 h and 48 h, respectively; NRF2: P = 0.007, P = 0.3771 and P = 0.0034 at 4 h, 24 h and 48 h, respectively). Data are representative of three independent experiments. e,f, CD8+ T cells with the indicated genotype and Asn status were collected 4 h after activation. The level of indicated mRNA and protein was determined by qPCR (e) (n = 3 experimental replicates; P < 0.0001, P < 0.0001 and P = 0.0002 for ATF4, ASNS and NRF2, respectively) and immunoblot (f). Immunoblot was quantified by ImageJ (v1.53T) (P = 0.0006 for ATF4 and P = 0.0029 for NRF2). Data are representative of three independent immunoblots. g,h, CD8+ T cells from the indicated genotype were activated in a medium with or without Asn for 72 h. Cell proliferation (g) was determined by CFSE staining, and the cell number was determined by a cell counter (h) (n = 5 experimental replicates; P < 0.0001). Data are representative of four independent experiments. i, The level of the indicated mRNA in cells collected 4 h after activation was determined by qPCR (n = 3 experimental replicates; P = 0.2247, P = 0.0583 and P = 0.0004 for ATF4, ASNS and NRF2, respectively). Data are representative of two independent experiments. j,k, CD8+ T cells from the indicated genotypes were activated in a medium with or without Asn for 72 h. Cell proliferation was determined by CFSE staining (j), and cell number was determined by a cell counter (k) (n = 5 experimental replicates; P = 0.0032). Data are representative of four independent experiments. Error bars represent mean ± s.d. *P < 0.05; **P < 0.01; ***P < 0.001. Statistical differences were determined by paired two-tailed Student’s t-test with a threshold of P < 0.05 (a) and unpaired two-tailed Student’s t-test (cf, h, i and k). l, The conceptual model of ATF4-dependent NRF2 expression enables robust proliferation of CD8+ Teff cells under Asn restriction. Source data
Fig. 5
Fig. 5. NRF2 is required to rewire the carbon metabolic program and enhance nucleotide biosynthesis under Asn restriction.
a, Schematic diagram of sample collection and assays. b, The indicated metabolites were quantified by the YSI bioanalyzer. Consumption was determined by calculating the difference between blank and spent medium (6-h incubation of T cells collected in the late phase (72 h)) (n = 3 experimental replicates; P = 0.0027 and P = 0.0043 for glucose and glutamine, respectively). c,d, T cells were collected in the late phase (72 h). Glycolysis activity (c) (n = 3 experimental replicates; P = 0.0027) and PPP activity (d) (n = 3 experimental replicates; P < 0.0001) were determined by measuring 3H2O generated from D-[5-3H(N)]glucose and 14CO2 generated from [1-14C]D-glucose, respectively. e, OCR (in the late phase (72 h)) was determined by Seahorse (n = 3 experimental replicates). f,g, Mitochondrial mass was determined by MitoTracker Green FM staining by flow cytometry (f) (n = 3 experimental replicates; P = 0.0009), and mitochondrial DNA was quantified by qPCR (g) (n = 3 experimental replicates; P = 0.0003). Data in bg are representative of three independent experiments. MFI, mean fluorescence intensity; mtDNA, mitochondrial DNA. h, Diagram of [13C5]glutamine catabolism through entering the downstream TCA cycle and pyrimidine biosynthesis. Filled circles denote the 13C label of all carbons of indicated metabolites derived from [13C5]glutamine catabolism (left panel). Metabolites in cells (in the late phase (72 h)) were analyzed by IC–UHR-FTMS (right panel); numbers on the x axis represent those of 13C atoms in given metabolites, and numbers on the y axis represent the levels of the metabolites (μmol per g protein). CDP, cytidine diphosphate. n = 3 experimental replicates; P = 0.0013, P = 0.0061, P = 0.0035, P = 0.0228, P = 0.0129, P = 0.028 and P = 0.0021 for Carb-Asp, orotate, UMP, uridine, CMP, CDP and dUMP, respectively. Data are representative of one experiment. Error bars represent mean ± s.d. *P < 0.05; **P < 0.01; ***P < 0.001. Statistical differences were determined by unpaired two-tailed Student’s t-test (bd and fh) and paired two-tailed Student’s t-test (e). i, The conceptual model of ATF4-dependent and NRF2-dependent carbon assimilation and robust effector CD8+ T cell proliferation. Source data
Fig. 6
Fig. 6. NRF2 activation enhances CD8+ T cell inflammation and antitumor functions.
a,b, CD8+ T cells from the indicated genotypes were activated in a medium with or without Asn for 72 h. The expression of the indicated cytokines was determined by intracellular staining by flow cytometry (n = 6 experimental replicates; P < 0.0001 and P = 0.0003 for IFN-γ and TNF-α, respectively). c, The level of the indicated mRNA in cells collected 72 h after activation was determined by qPCR and depicted as log10-transformed fold change in a heatmap (n = 3 experimental replicates). T-bet, T-box expressed in T cells; TCF, T-cell factor; PRDM, PR domain zinc finger protein 1. Data in ac are representative of three independent experiments. dj, Cells with the indicated genotypes were activated for 5 days, followed by restimulation with soluble antibodies (2 days). The level of the indicated mRNA was determined by qPCR (d) (n = 3 experimental replicates; P = 0.0011). The expression of the indicated cytokines was determined by flow cytometry (e, f) (n = 3 experimental replicates for IFN-γ and n = 4 experimental replicates for TNF-α; P = 0.0013 and P = 0.0009 for IFN-γ and TNF-α, respectively). Indicated proteins in culture supernatants were quantified by ELISA (g) (n = 3 experimental replicates; P = 0.0055, P = 0.0013 and P = 0.011 for IFN-γ, TNF-α and GZMB, respectively). Cytolysis was determined by eSight (h) (n = 3 experimental replicates; P < 0.0001). Data in dh are representative of three independent experiments. Error bars represent mean ± s.d. Schematic diagram of the experiment (i). Tumor growth (j, left) and Kaplan–Meier survival curves of mice bearing a B16-gp100 tumor (j, right) (n = 10 mice per group; P = 0.0002 for tumor growth and P = 0.016 for survival). Data are representative of two independent experiments. Error bars represent mean ± s.e.m. *P < 0.05; **P < 0.01; ***P < 0.001; ns, not significant. Statistical differences were determined by unpaired two-tailed Student’s t-test (b, d and f) and two-way ANOVA (h and j). Source data
Fig. 7
Fig. 7. Asn restriction enhances T cell-mediated antitumor responses in vivo.
ah, Schematic diagrams of animal experiments (a, c, e and g). Kaplan–Meier survival curves and tumor growth of mice bearing a B16-gp100 tumor (b) (n = 10 mice per group; P = 0.0054 and P < 0.0001 for the left and right panels, respectively). Data are representative of three independent experiments. Kaplan–Meier survival curves and tumor growth of mice bearing a LAN-1 neuroblastoma tumor (d) (n = 8 mice per group; P < 0.0001 and P < 0.0001 for the left and right panels, respectively). Data are representative of two independent experiments. Kaplan–Meier survival curves and tumor growth of mice bearing a B16F10 melanoma tumor (f) (n = 5 mice per group; P = 0.0019 and P < 0.0001 for the left and right panels, respectively). Data are representative of three independent experiments. Kaplan–Meier survival curves and tumor growth of mice bearing a CMT Keap-1 KO lung tumor (h) (n = 5 mice per group; P = 0.0085 and P < 0.0001 for the left and right panels, respectively). Data are representative of two independent experiments. Error bars represent mean ± s.e.m. (b, d, f and h). **P < 0.01; ***P < 0.001. Statistical differences were determined by two-way ANOVA for tumor growth curve and log-rank test for animal survival. i, The conceptual model of ATF4-dependent and NRF2-dependent stress signaling response, optimized carbon assimilation, and robust effector function on CD8+ T cells. Source data
Extended Data Fig. 1
Extended Data Fig. 1. Asn restriction suppresses CD8+ T cell activation but enhances inflammation and proliferation.
a-b) CD8+ T cells were activated in a medium with or without Asn and were collected in the early phase (24 hr) and late phase (72 hr). The protein content (a) (n = 3 experimental replicates, P < 0.0001 and P = 0.9368 at 24 and 72 h respectively) and cell viability (b) (n = 5 experimental replicates, (P = 0.003 and P = 0.7328 at 24 and 72 h respectively) was determined by 7AAD staining by flow cytometry. Data are representative of 3 independent experiments. c) Cell cycle, TNF-α, inflammatory response, and effector T cell function associated gene sets were analyzed by GSEA. d-f) Indicated cytokine was quantified by intracellular staining by flow cytometry as indicated condition (n = 4 experimental replicates, Pmel T cells: P = 0.007 and P = 0.002 for IFN-γ and TNF-α respectively; GD2 CAR-T: P = 0.0013 and P = 0.01 for IFN-γ and TNF-α respectively; Pmel T cells: P = 0.01 and P = 0.19 for no IL-2 and IL-2 respectively). g) Schematic diagram of the experiment. h) cell number (n = 4 experimental replicates, P = 0.01, P = 0.01 and P = 0.9 for group 1 vs. 2, 1 vs. 3 and 1 vs. 4 respectively). i) The indicated cytokines were quantified by flow cytometry (n = 3 experimental replicates, IFN-γ: P = 0.0009, P = 0.0006, and P = 0.3992; TNF-α: P = 0.0032, P = 0.004, and P = 0.668 for group 1 vs. 2, 1 vs. 3 and 1 vs. 4 respectively). j) The cytolysis was determined by eSight (n = 3 experimental replicates, P < 0.0001, P < 0.0001 and P = 0.675 in 1 vs. 2, 1 vs. 3 and 1 vs. 4 respectively). Data from d-j are representative of 3 independent experiments. Error bars represent mean ± SD. *P < 0.05, **P < 0.01, *** P < 0.001, Statistical differences were determined by unpaired Two-tail Student’s t-test (a, b, d-f and h-i) and Two-way ANOVA (j). k) Conceptual model showing that Asn restriction suppressed T cell activation but conferred robust proliferation and effector function to CD8+ Teff cells at the late time point. Source data
Extended Data Fig. 2
Extended Data Fig. 2. ASNS is dispensable for normal T cell development after the double-positive stage.
a) Representative flow plots (left) and quantification of CD4+ and CD8+ distribution in the thymus, peripheral lymph nodes, and spleen (right) (n = 4 mice/group, CD4: P = 0.12 and P = 0.11; CD8+: P = 0.53 and P = 0.59 in thymus T cell (%) and T cell number respectively; CD4+: P = 0.39 and P = 0.69; CD8+: P = 0.56 and P = 0.77 in peripheral LN T cell (%) and T cell number respectively; CD4: P = 0.47 and P = 0.37; CD8:P = 0.77 and P = 0.66 in spleen T cell (%) and T cell number respectively. b-c) CD8+ T cells with the indicated genotype were activated, and cell surface expression of CD25, cell size (FSC) (b) (n = 3 experimental replicates, P = 0.59 and P = 0.76 for CD25 and cell size respectively), and cell viability (c) (n = 5 experimental replicates, P = 0.84) were determined by flow cytometry. Data are representative of 3 independent experiments. Error bars represent mean ± SD. ns, not significant, Statistical differences were determined by unpaired Two-tail Student’s t-test (a-c). Source data
Extended Data Fig. 3
Extended Data Fig. 3. Asn restriction rewires the central carbon metabolism in CD8+ T cells.
a) The indicated metabolites were quantified by the YSI bioanalyzer. The production was determined by calculating the difference between blank and spent medium (6 hr incubation of T cells collected in the late phase/72 hr) (n = 3 experimental replicates, P = 0.0003 and P = 0.0048 for lactate and glutamate production respectively). b) Cell surface expression of Glut1 was determined by flow, and mRNA expression of indicated genes was quantified by qPCR. (n = 3 experimental replicates, P = 0.27 for Glut1 expression and P = 0.61, P = 0.73 and P = 0.06 for Glut1, Glut 3 and Slc1a5 respectively). c) glucose and glutamine uptake were determined by intracellular retention of [3H]-2-deoxy-glucose and [14C5]-glutamine, respectively (n = 3 experimental replicates, P = 0.39 and P = 0.64 for glucose and glutamine uptake respectively). d-e) Mitochondria mass was determined by Mito Tracker green FM staining by flow cytometry (d) (n = 3, P = 0.0021), and mitochondrial DNA was quantified by qPCR (e) (n = 3, (P < 0.0001). Data are representative of 3 independent experiments. f) The extracellular metabolome of indicated groups was determined by LC-MS (Fig. 3a). (g-h) Differently expressed metabolic gene signatures were determined by the IPA analysis of RNAseq (in the late phase/72 h) (g) and a heatmap depicting log 10-fold change of differentially expressed metabolic genes (P = 0.0081) (h). Data from f-h are representative of one experiment. Error bars represent mean ± SD. *P < 0.05, **P < 0.01, *** P < 0.001. Statistical differences were determined by unpaired Two-tail Student’s t-test (a-d) paired Two-tail Student’s t-test (h). Source data
Extended Data Fig. 4
Extended Data Fig. 4. Asn restriction changes the gene expression profile in CD8+ T cells.
a) Confocal imaging of NRF2 localization staining (red) and DAPI (blue) were analyzed using ImageJ (n = 3 experimental replicates, P = 0.0002). b) Schematic diagrams of animal experiments. c) The level of the indicated mRNA in cells after L-ASP was determined by qPCR (n = 3 experimental replicates, P = 0.0036, P = 0.002, P = 0.014, P = 0.31, P = 0.03, P = 0.09, P = 0.0007, P = 0.6, P = 0.003, P = 0.0015, P = 0.0006, P < 0.001, P < 0.001, P = 0.0003, P = 0002 and P = 0.0048 -CAD, DHODH, UMPS, CPS1, PPAT, G6PDX, PGD, TKT, PNP, IMPDH1, PRPs, PFAS, ADSL, ADSS, ATF4 and NRF2 respectively). Data are representative of two independent experiments. Error bars represent mean ± SD. *P < 0.05, **P < 0.01, *** P < 0.001. Statistical differences were determined unpaired Two-tail Student’s t-test (a and c). Source data
Extended Data Fig. 5
Extended Data Fig. 5. ATF4 is dispensable for T-cell development but is indispensable for ASNS induction.
a) ATF4 is dispensable for normal T-cell development after the double-positive stage. Representative flow plots (left) and quantification of CD4+ and CD8+ distribution in the thymus, peripheral lymph nodes, and spleen (right) (n = 3 mice per group). b) ASNS expression in ATF4 KO T cells was determined by flow cytometry at indicated time points (n = 3 experimental replicates, P = 0.0018, P = 0.0005 and P = 0.003 at 24, 48 and 72 h respectively). Data are representative of two experiments. Error bars represent mean ± SD. ns, not significant, Statistical differences were determined unpaired Two-tail Student’s t-test (a and b). Source data
Extended Data Fig. 6
Extended Data Fig. 6. NRF2 regulates carbon consumption and nucleotide synthesis.
a) The indicated metabolites were quantified by the YSI bioanalyzer. The production was determined by calculating the difference between blank and spent medium (6 hr incubation of T cells collected in the late phase/72 hr) (n = 3 experimental replicates, P < 0.001 and P = 0.0027 for lactate and glutamate production). b) OCR (in the late phase/72 hr) was determined by the Seahorse (n = 12 experimental replicates for basal and n = 9 experimental replicates for maximal OCR, P < 0.001 and P < 0.001 for basal and maximal OCR respectively). Data from a-b are representative of 3 independent experiments. c) The level of the indicated mRNA in cells collected 72 hr after activation was determined by qPCR and depicted by heatmap (log 10-fold change) (n = 3 experimental replicates). Data are representative of 2 independent experiments. Error bars represent mean ± SD. *P < 0.05, **P < 0.01, *** P < 0.001. Statistical differences were determined by unpaired Two-tail Student’s t-test (a and b). Source data
Extended Data Fig. 7
Extended Data Fig. 7. Activation of ATF4 enhances CD8+ T cell effector functions.
a) The level of the indicated mRNA was determined by qPCR (n = 3 experimental replicates, P = 0.0012 and P = 0.0038 for ATF4 and NRF2 respectively). b) Representative flow plots (left) and quantification of NRF2 expression in indicated genotype (n = 3 experimental replicates, P < 0.001). (c-h) Cells with indicated genotypes were activated for 5 days, followed by restimulation with soluble antibodies (2 days). The expression of indicated cytokines was determined by flow cytometry (c-d) (n = 4 experimental replicates, P = 0.0007 and P = 0.0002 for IFN-γ and TNF-α respectively). The indicated protein in the cell culture medium collected 5 days after activation was quantified by ELISA (e) (n = 3 experimental replicates, P < 0.0001, P = 0.001 and P = 0.0014 for IFN-γ, TNF-α and GZMB respectively). Data from a-e are representative of 3 independent experiments. The cytolysis was determined by eSight (f) (n = 3 experimental replicates, P < 0.0001). Data are representative of 2 independent experiments. Error bars represent mean ± SD. Schematic diagram of the experiment (g). Tumor growth (left, h) and Kaplan-Meier survival curves (right, h) of mice bearing B16-gp100 tumor (n = 10 mice per group, left panel: P < 0.0001; right panel: P = 0.0013). Data are representative of 2 independent experiments. Error bars represent mean ± SEM. *P < 0.05, **P < 0.01, *** P < 0.001, ns, not significant. Statistical differences were determined by unpaired Two-tail Student’s t-test (a, b and d-e) and Two-way ANOVA (f and h) for tumor growth curve, and log-rank test for animal survival. Source data
Extended Data Fig. 8
Extended Data Fig. 8. Asn restriction differentially affects T cells and tumor cells.
a-g) B16F10, LAN-1, and CMT Keap1 KO cells were cultured in a medium with or without Asn. Cell growth a) (n = 3 experimental replicates), c) (n = 3 experimental replicates), and e) (n = 3 experimental replicates, P < 0.0001) was determined by live-cell imaging analysis (IncuCyte ZOOM™). Cell viability b) (n = 3 experimental replicates), d) (n = 3 experimental replicates), and f) (n = 3 experimental replicates, P = 0.01) was determined by 7AAD staining by flow cytometry. Data are representative of 3 independent experiments. g) Keap1 mRNA expression in CMT lung cancer cells was determined by qPCR (n = 3 experimental replicates, P < 0.0001). Data from a-g are representative of 2 independent experiments. Error bars represent mean ± SD. *P < 0.05, **P < 0.01, ns, not significant. Statistical differences were determined by unpaired Two-tail Student’s t-test (b, d and f-g) and Two-way ANOVA (a, c and e). h-k) Tumor growth of indicated groups (h represents Fig. 7b, i represent Fig. 7d, j represents Fig. 7f, and k represents Fig. 7h). Source data

References

    1. Wang R, Green DR. Metabolic checkpoints in activated T cells. Nat. Immunol. 2012;13:907–915. doi: 10.1038/ni.2386. - DOI - PubMed
    1. Gerriets VA, Rathmell JC. Metabolic pathways in T cell fate and function. Trends Immunol. 2012;33:168–173. doi: 10.1016/j.it.2012.01.010. - DOI - PMC - PubMed
    1. Pearce EL, Pearce EJ. Metabolic pathways in immune cell activation and quiescence. Immunity. 2013;38:633–643. doi: 10.1016/j.immuni.2013.04.005. - DOI - PMC - PubMed
    1. Chapman NM, Boothby MR, Chi H. Metabolic coordination of T cell quiescence and activation. Nat. Rev. Immunol. 2020;20:55–70. doi: 10.1038/s41577-019-0203-y. - DOI - PubMed
    1. Wang W, Zou W. Amino acids and their transporters in T cell immunity and cancer therapy. Mol. Cell. 2020;80:384–395. doi: 10.1016/j.molcel.2020.09.006. - DOI - PMC - PubMed

Publication types