. 2023 Aug 8:12:e83831.
doi: 10.7554/eLife.83831.

EPAC1 inhibition protects the heart from doxorubicin-induced toxicity

Affiliations

EPAC1 inhibition protects the heart from doxorubicin-induced toxicity

Marianne Mazevet et al. Elife. .

Abstract

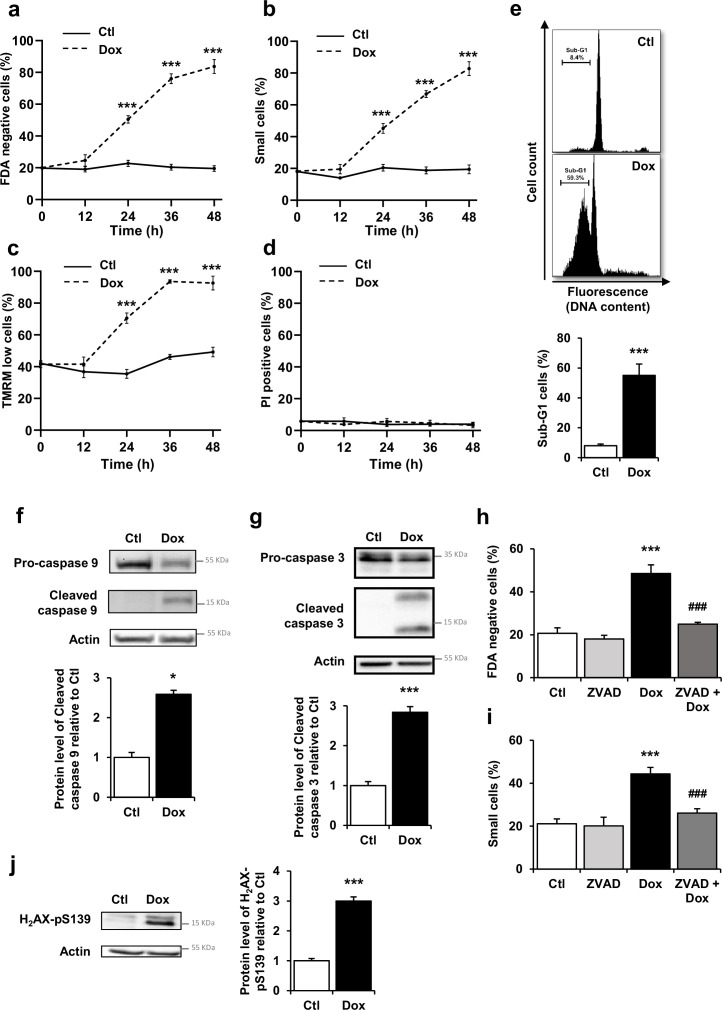
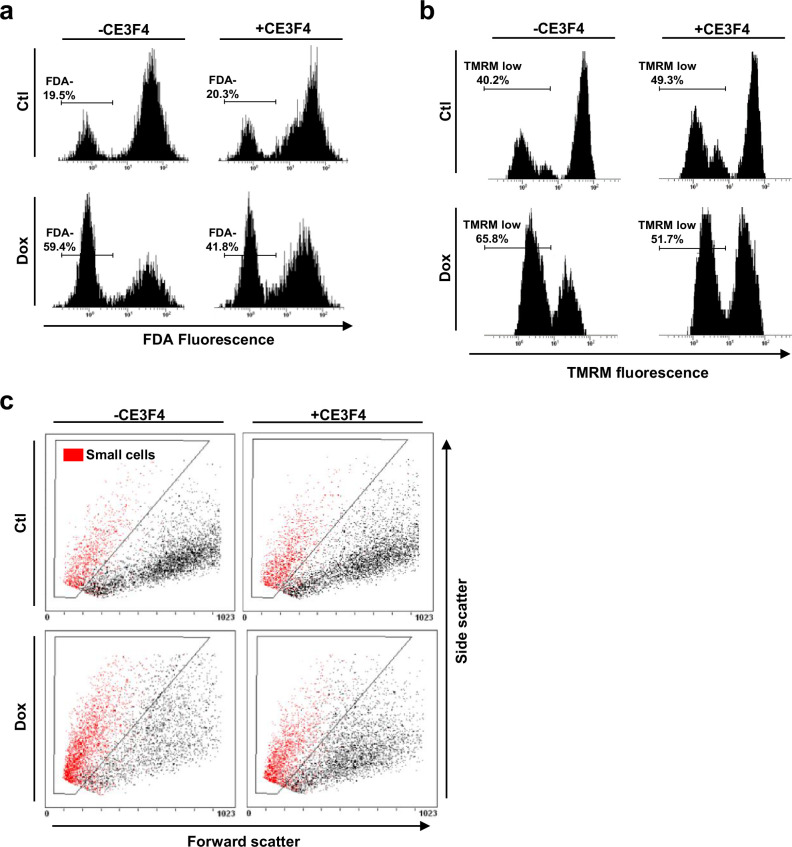
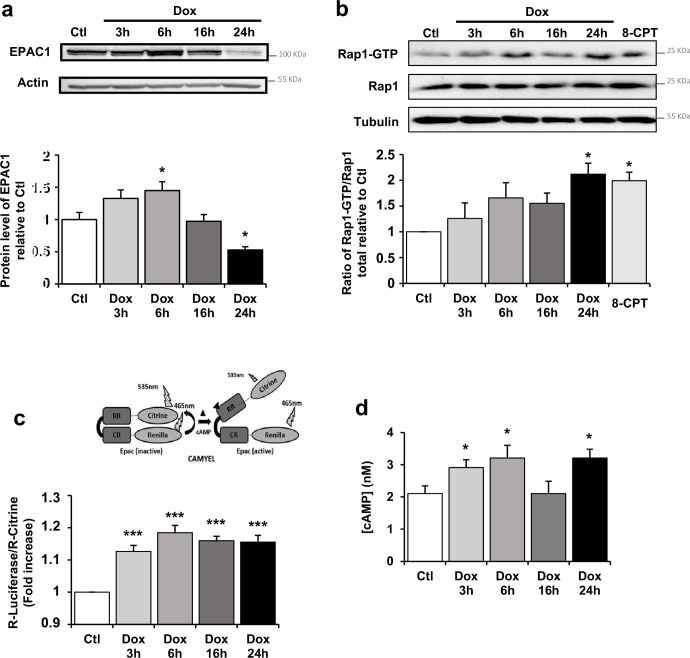
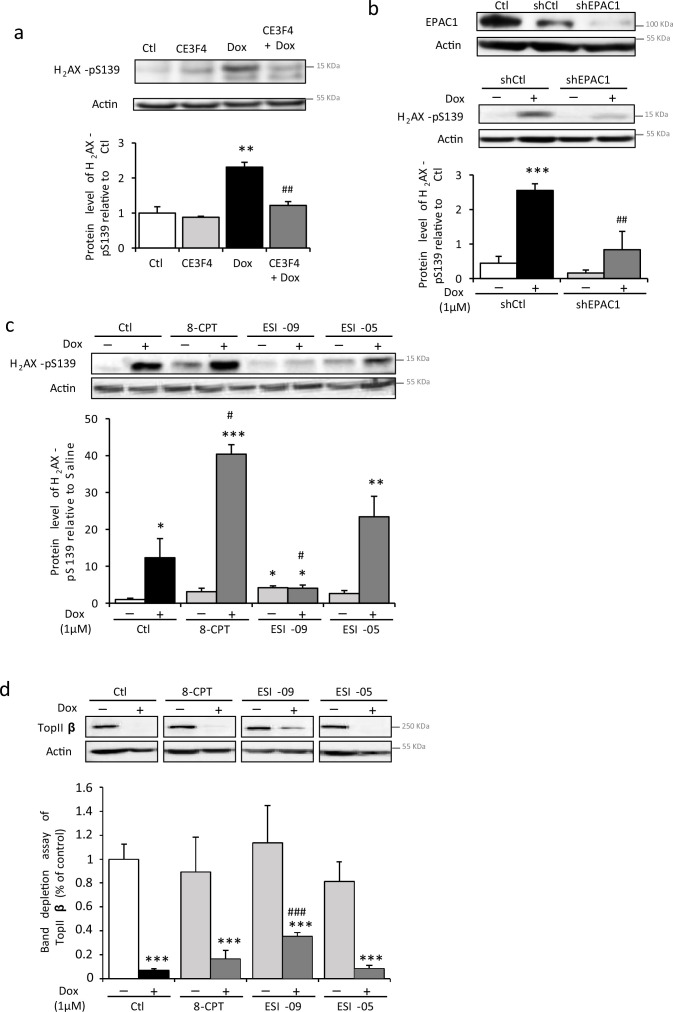
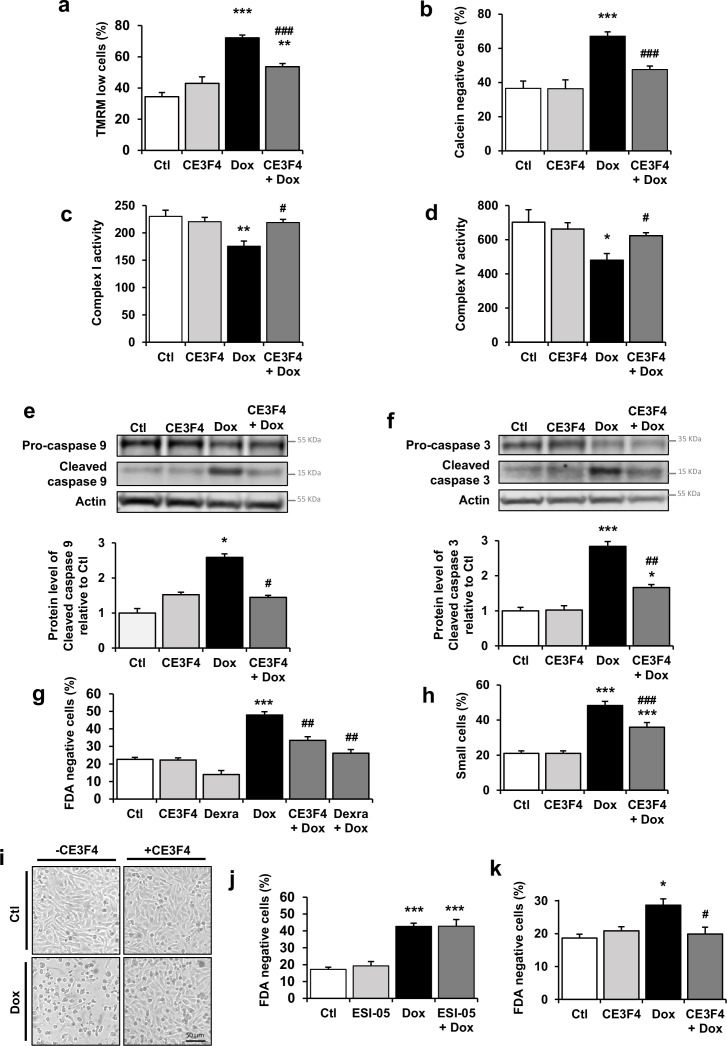
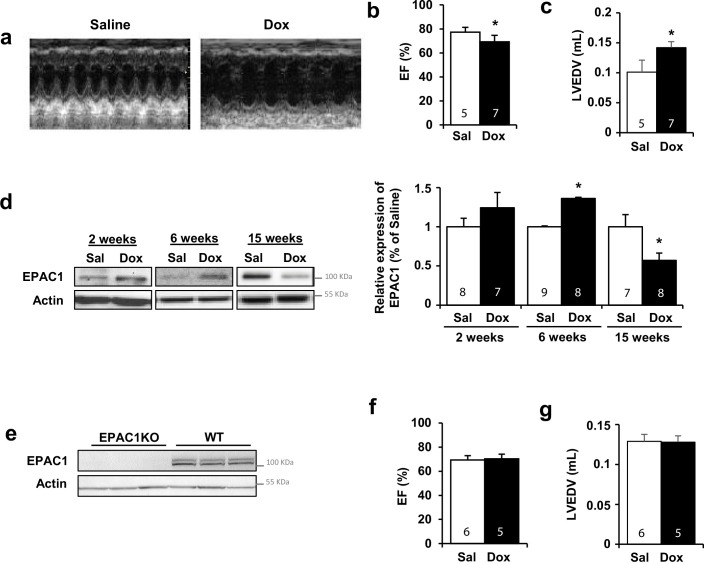
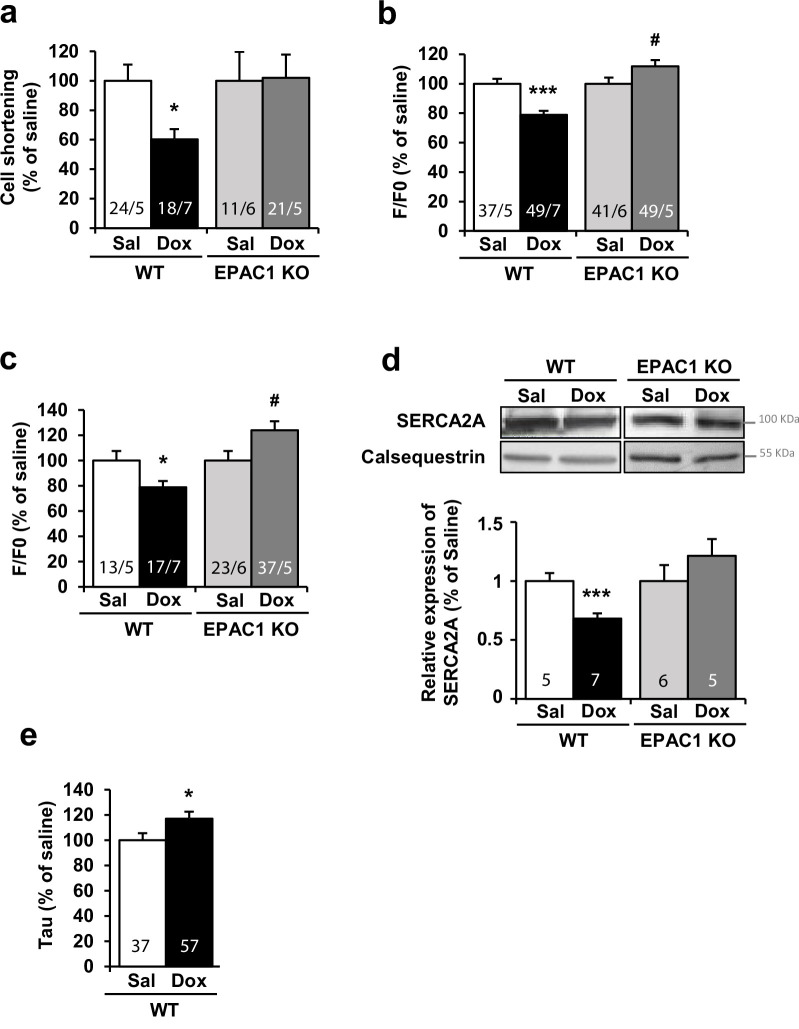
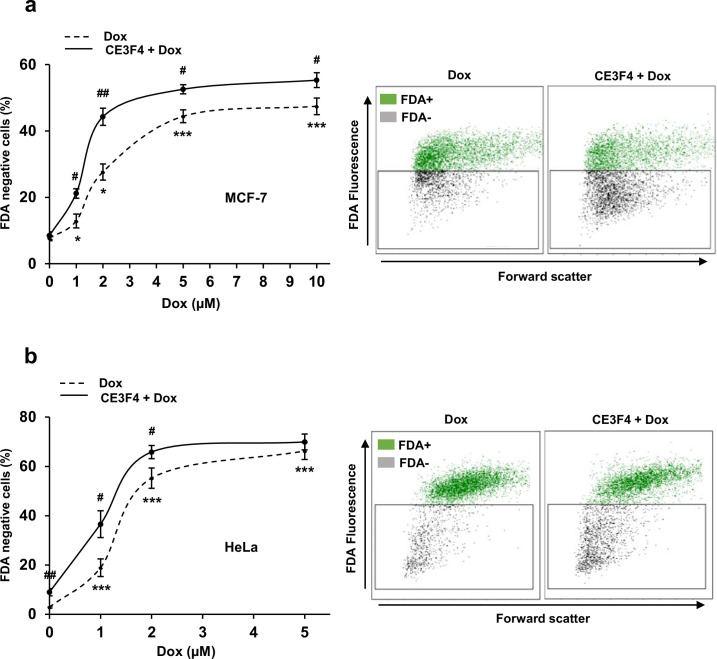
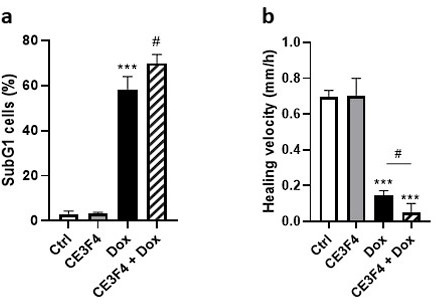
Anthracyclines, such as doxorubicin (Dox), are widely used chemotherapeutic agents for the treatment of solid tumors and hematologic malignancies. However, they frequently induce cardiotoxicity leading to dilated cardiomyopathy and heart failure. This study sought to investigate the role of the exchange protein directly activated by cAMP (EPAC) in Dox-induced cardiotoxicity and the potential cardioprotective effects of EPAC inhibition. We show that Dox induces DNA damage and cardiomyocyte cell death with apoptotic features. Dox also led to an increase in both cAMP concentration and EPAC1 activity. The pharmacological inhibition of EPAC1 (with CE3F4) but not EPAC2 alleviated the whole Dox-induced pattern of alterations. When administered in vivo, Dox-treated WT mice developed a dilated cardiomyopathy which was totally prevented in EPAC1 knock-out (KO) mice. Moreover, EPAC1 inhibition potentiated Dox-induced cell death in several human cancer cell lines. Thus, EPAC1 inhibition appears as a potential therapeutic strategy to limit Dox-induced cardiomyopathy without interfering with its antitumoral activity.

Keywords: EPAC1; cancer biology; cardiology; cardiotoxicity; cell biology; doxorubicin; human; mouse; rat.


Conflict of interest statement

MM, AB, MR, DD, AL, ML, TB, PM, MG, FL, JC, CB, CR, FL, BC, JB, MV, RF, AG, CL, EM No competing interests declared

Figures

Figure 1.
Figure 1.. Doxorubicin (Dox) induces DNA damages and activates mitochondrial pathway of apoptosis in cardiac myocytes.
(a–d) Cell death markers were recorded by flow cytometry in neonatal rat ventricular myocyte (NRVM) treated or not with Dox (1 µM) for 12 hr, 24 hr, 36 hr, and 48 hr. Results are presented as mean ± SEM. ***p<0.001 vs. control. (a) Percentages of dead cells (FDA negative cells) measured by FDA assay (n=4–12). (b) Percentages of small cells obtained by gating the cell population with decrease forward scatter signal (n=4–12). (c) Percentages of cells with decreased ΔΨm (TMRM low cells) recorded after TMRM staining (n=3–12). (d) Necrosis was assessed using propidium iodide (PI) and the percentage of cells with permeabilized plasma membrane (PI positive cells) is presented (n=4–7). (e) NRVM were untreated (Ctl) or treated with Dox (1 µM) for 24 hr and the percentage of cells with fragmented DNA (sub-G1 DNA content) was recorded by flow cytometry and is presented as mean ± SEM (n=4). ***p<0.001 vs. control. (f, g) NRVM were treated or not with Dox (1 µM) for 6 hr and the levels of cleaved-caspase 9 (f) or cleaved-caspase 3 (g) were detected by western blot. Actin was used as a loading control and protein levels relative to Ctl are presented in bar graphs (mean ± SEM, n=3 for caspase 9 and n=11 for caspase 3). *p<0.05, ***p<0.001 vs. control. (h, i) NRVM were treated or not with Dox (1 µM) ± the general caspase inhibitor ZVAD-fmk (50 µM) for 24 hr. The percentage of dead cells (h) and small cells (i) is presented (mean ± SEM, n=3–8). ***p<0.001 vs. control, ###p<0.001 vs. Dox alone. (j) NRVM were untreated (Ctl) or treated with Dox (1 µM) for 16 hr and the level of the DNA damage marker phosphorylated histone H2AX (H2AX-pS139) was analyzed by western blot. Actin was used as a loading control. Protein levels relative to Ctl are presented in bar graphs (mean ± SEM, n=4). ***p<0.001 vs. control.
Figure 1—figure supplement 1.
Figure 1—figure supplement 1.. Doxorubicin (Dox) induced apoptotic cell death in cardiac myocytes.
(a–c) Neonatal rat ventricular myocyte (NRVM) were left untreated or treated with Dox (1 µM) ± CE3F4 (10 µM) for 24 hr and analyzed by flow cytometry. Representative monoparametric histograms of (a) FDA fluorescence (cell death) or (b) TMRM fluorescence (ΔΨm potential). (c) Representative biparametric cytograms where forward scatter signal (cell size) is represented versus side scatter signal (cell density).
Figure 2.
Figure 2.. Doxorubicin (Dox) modulates cAMP-EPAC1 pathway in cardiac cells.
(a) Neonatal rat ventricular myocyte (NRVM) were untreated or treated with 1 µM Dox for 3 hr, 6 hr, 16 hr, and 24 hr and the level of EPAC1 protein was detected by western blot. Actin was used as a loading control. Protein levels relative to Ctl are presented in bar graphs (mean ± SEM, n=4–6). *p<0.05 vs. control. (b) NRVM were untreated or treated with Dox (1 µM) for 3 hr, 6 hr, 16 hr, and 24 hr or with the EPAC activator 8-CPT (10 μM) for 3 hr. GTP-activated form of RAP1 was analyzed by pull-down assay. RAP1-GTP/RAP1 total ratios relative to Ctl are expressed in bar graphs as mean ± SEM (n=4). *p<0.05 vs. control. (c–d) NRVM were untreated or treated with Dox (1 µM) for 3 hr, 6 hr, 16 hr, and 24 hr. (c) CAMYEL-based EPAC1 BRET sensor was used to measure EPAC1 activation. The BRET ratio was calculated as the ratio of the Renilla luciferase emission signal to that of citrine-cp (means ± SEM, n=8). ***p<0.001 vs. control. (d) The concentration of cAMP (nM) was monitored by cAMP dynamic 2 kit (means ± SEM, n=4). *p<0.05 vs. control.
Figure 3.
Figure 3.. Pharmacological inhibition of EPAC1, but not EPAC2, protects cardiomyocytes from doxorubicin (Dox)-induced DNA damage.
(a) Neonatal rat ventricular myocyte (NRVM) were untreated or treated with Dox (1 µM) ± the specific EPAC1 inhibitor CE3F4 (10 µM) for 16 hr and the level of the DNA damage marker H2AX-pS139 was analyzed by western blot. Actin was used as a loading control. Protein levels relative to Ctl are presented in bar graphs (mean ± SEM, n=3–5). **p<0.01 vs. control, ##p<0.01 vs. Dox alone. (b) NRVM were transfected with control (shCtl) or EPAC1 (shEPAC1) shRNA for 12 hr before treatment with Dox for 16 hr. The relative levels of EPAC1 and H2AX-pS139 were measured by immunoblotting with actin as a loading control (mean ± SEM, n=3–5). ***p<0.001 vs. shCtl, ##p<0.01 vs. shCtl + Dox. (c, d) NRVM were untreated or treated with Dox (1 µM) and either the EPAC activator 8-CPT (10 µM) or the EPAC1 inhibitor ESI-09 (1 µM) or the EPAC2 inhibitor ESI-05 (1 µM) for 24 hr. (c) The level of the DNA damage marker H2AX-pS139 was analyzed by western blot. Actin was used as a loading control. Protein levels relative to Ctl are presented in bar graphs (mean ± SEM, n=3). *p<0.05, **p<0.01, ***p<0.001 vs. control, #p<0.05 vs. Dox alone. (d) The level of free topoisomerase IIβ (TopIIβ) was quantified by band depletion assay. Actin was used as a loading control. Protein levels relative to Ctl are presented in bar graphs (mean ± SEM, n=3–5). ***p<0.001 vs. control, ###p<0.001 vs. Dox alone.
Figure 4.
Figure 4.. EPAC1 inhibition reduces doxorubicin (Dox)-induced mitochondrial apoptotic pathway.
(a, b) Neonatal rat ventricular myocyte (NRVM) were untreated or treated with Dox (1 µM) ± CE3F4 (10 µM) for 24 hr and analyzed by flow cytometry. Results are expressed as means ± SEM. **p<0.01, ***p<0.001 vs. control, ###p<0.001 vs. Dox alone. (a) TMRM staining was used to assess the percentage of cells with decreased ΔΨm (as TMRM low cells) (n=10). (b) Calcein-cobalt assay was used to record MPTP opening (as calcein negative cells) (n=3–4). (c, d) NRVM were untreated or treated with Dox (1 µM) ± CE3F4 (10 µM) for 16 hr. Activity of the mitochondrial respiratory complex I (n=4) (c) and complex IV (n=3) (d) is presented in the bar graphs as means ± SEM. *p<0.05, **p<0.01 vs. control, #p<0.05 vs. Dox alone. (e, f) NRVM were untreated or treated with Dox (1 µM) ± CE3F4 (10 µM) for 6 hr and the levels of cleaved-caspase 9 (e) and cleaved-caspase 3 (f) were detected by western blot. Actin was used as a loading control and protein levels relative to Ctl are presented in bar graphs (means ± SEM, n=3 for caspase 9 and n=7–11 for caspase 3). *p<0.05, ***p<0.001 vs. control, #p<0.05, ##p<0.01 vs. Dox alone. (g, h) NRVM were treated or not with Dox (1 µM) ± CE3F4 (10 µM) ± dexrazoxane (200 µM) for 24 hr and analyzed by flow cytometry. Results in bar graphs are expressed as mean ± SEM. ***p<0.001 vs. control, ##p<0.01, ###p<0.001 vs. Dox alone. (g) Percentage of dead cells (FDA negative cells) (n=3–7). (h) Percentage of small cells (n=8). (i) Representative micrographs of NRVM untreated or treated with Dox (1 µM) ± CE3F4 (10 µM) for 24 hr. (j) The percentage of dead cells (FDA negative cells) was assessed in NRVM left untreated or treated with Dox (1 µM) ± the specific EPAC2 inhibitor ESI-05 (1 µM) and presented as means ± SEM (n=5). ***p<0.001 vs. control, ###p<0.001 vs. Dox alone. (k) Freshly isolated adult rat ventricular myocytes (ARVM) were treated or not with Dox (1 µM) ± CE3F4 (10 µM) for 24 hr and cell death was determined. The percentage of dead cells (FDA negative cells) is presented in bar graphs (means ± SEM, n=4–5). *p<0.05 vs. control, #p<0.05 vs. Dox alone.
Figure 5.
Figure 5.. Doxorubicin (Dox)-induced cardiotoxicity was prevented in EPAC1 knock-out (KO) mice.
WT (a–d) or EPAC1 KO mice (e–g) were injected (i.v.) three times with saline solution (Sal) or Dox at 4 mg/kg for each injection (12 mg/kg cumulative dose). Echocardiographic analysis was performed at 15 weeks after the last injection. (a) Representative echocardiography images. (b) Ejection fraction (EF) and (c) left ventricle end-diastolic volume (LVEDV) are presented as means ± SEM. *p<0.05 vs. saline. (d) The protein level of EPAC1 was determined by western blot at 2, 6, and 15 weeks after the last injection. Actin was used as a loading control. Relative protein levels are presented in bar graphs. *p<0.05 vs. saline. (e) Absence of EPAC1 protein was verified in EPAC1 KO mice by western blot. Actin was used as a loading control. (f) EF and (g) LVEDV in EPAC1 KO mice are presented as means ± SEM. In (b, c, d, f, and g), the number of mice is indicated in the corresponding bargraph.
Figure 5—figure supplement 1.
Figure 5—figure supplement 1.. Body weight of mice treated with doxorubicin (Dox).
WT and EPAC1 knock-out (KO) mice were injected (i.v.) three times with (a) saline solution (Sal) or (b) Dox at 4 mg/kg for each injection (12 mg/kg cumulative dose). The body weight was measured every week after treatment with Sal or Dox. The data were fitted to a linear relationship. The slopes were 0.41 and 0.34 g/week in (a), and 0.21 and 0.18 g/week in (b) for WT and EPAC1 KO mice, respectively, and were not statistically different (p=0.0708 and 0.6487, respectively in (a) and (b)).
Figure 6.
Figure 6.. Doxorubicin (Dox)-induced cardiotoxicity was prevented in EPAC1 knock-out (KO) mice.
WT and EPAC1 KO mice were injected (i.v.) three times with saline solution (Sal) or Dox at 4 mg/kg for each injection (12 mg/kg cumulative dose). Ventricular cells were isolated from control and treated mice 15 weeks after last i.v. injection and loaded with fluorescence Ca2+ dye Fluo-3 AM allowing to measure (a) cell shortening, (b) calcium transient amplitude, and (c) sarcoplasmic reticulum calcium release (upon application of 10 mM caffeine) by confocal microscopy. Normalized values are presented as mean ± SEM. *p<0.05, ***p<0.001 vs. WT saline, #p<0.05, ##p<0.01 vs. EPAC1 KO saline. The number of animals and cells is indicated in the bars of the graphs. (d) The level of SERCA2A protein was measured by western blot. Calsequestrin was used as a loading control. Relative protein levels are presented as mean ± SEM. ***p<0.001 vs. WT saline. The number of saline or Dox-treated mice is indicated in the bars of the graphs. (e) Histograms of normalized mean ± SEM values of relaxation time constant (Tau) of calcium transients in Sal and Dox. The number of animals and cells is indicated in the bars.
Figure 7.
Figure 7.. EPAC1 inhibition enhances doxorubicin (Dox)-induced cytotoxicity in various human cancer cell lines.
Human MCF-7 breast cancer cells (a) and HeLa cervical cancer cells (b) were untreated or treated with the indicated doses of Dox ± CE3F4 (10 µM) for 24 hr. Cell death was measured by flow cytometry after FDA staining. Results presented in graphs are expressed as the percentage of dead cells (FDA negative cells) (means ± SEM, n=5 for MCF-7 and n=8–9 for HeLa, *p<0.05, ***p<0.001 vs. control, #p<0.05, ##p<0.01 vs. Dox alone). Representative biparametric cytograms showing FDA fluorescence vs. forward scatter (cell size) are presented.
Author response image 1.

Comment in

  • Protecting the heart.
    Inglis JM, Mangoni AA. Inglis JM, et al. Elife. 2023 Sep 6;12:e91831. doi: 10.7554/eLife.91831. Elife. 2023. PMID: 37672034 Free PMC article.

References

    1. Almahariq M, Chao C, Mei FC, Hellmich MR, Patrikeev I, Motamedi M, Cheng X. Pharmacological inhibition and genetic knockdown of exchange protein directly activated by cAMP 1 reduce pancreatic cancer metastasis in vivo. Molecular Pharmacology. 2015;87:142–149. doi: 10.1124/mol.114.095158. - DOI - PMC - PubMed
    1. Almahariq M, Mei FC, Cheng X. The pleiotropic role of exchange protein directly activated by cAMP 1 (EPAC1) in cancer: implications for therapeutic intervention. Acta Biochimica et Biophysica Sinica. 2016;48:75–81. doi: 10.1093/abbs/gmv115. - DOI - PMC - PubMed
    1. Baljinnyam E, Umemura M, De Lorenzo MS, Iwatsubo M, Chen S, Goydos JS, Iwatsubo K. Epac1 promotes melanoma metastasis via modification of heparan sulfate. Pigment Cell & Melanoma Research. 2011;24:680–687. doi: 10.1111/j.1755-148X.2011.00863.x. - DOI - PubMed
    1. Baljinnyam E, Umemura M, Chuang C, De Lorenzo MS, Iwatsubo M, Chen S, Goydos JS, Ishikawa Y, Whitelock JM, Iwatsubo K. Epac1 increases migration of endothelial cells and melanoma cells via FGF2-mediated paracrine signaling. Pigment Cell & Melanoma Research. 2014;27:611–620. doi: 10.1111/pcmr.12250. - DOI - PMC - PubMed
    1. Brown LM, Rogers KE, McCammon JA, Insel PA. Identification and validation of modulators of exchange protein activated by cAMP (Epac) activity: structure-function implications for Epac activation and inhibition. The Journal of Biological Chemistry. 2014;289:8217–8230. doi: 10.1074/jbc.M114.548636. - DOI - PMC - PubMed

Publication types

Substances