

Whole Blood DNA Methylation Changes Are Associated with Anti-TNF Drug Concentration in Patients with Crohn's Disease
- PMID: 37551994
- PMCID: PMC11324340
- DOI: 10.1093/ecco-jcc/jjad133
Whole Blood DNA Methylation Changes Are Associated with Anti-TNF Drug Concentration in Patients with Crohn's Disease
Abstract
Background and aims: Anti-tumour necrosis factor [TNF] treatment failure in patients with inflammatory bowel disease [IBD] is common and frequently related to low drug concentrations. In order to identify patients who may benefit from dose optimisation at the outset of anti-TNF therapy, we sought to define epigenetic biomarkers in whole blood at baseline associated with anti-TNF drug concentrations at week 14.
Methods: DNA methylation from 1104 whole blood samples from 385 patients in the Personalised Anti-TNF Therapy in Crohn's disease [PANTS] study were assessed using the Illumina EPIC Beadchip [v1.0] at baseline and weeks 14, 30, and 54. We compared DNA methylation profiles in anti-TNF-treated patients who experienced primary non-response at week 14 if they were assessed at subsequent time points and were not in remission at week 30 or 54 [infliximab n = 99, adalimumab n = 94], with patients who responded at week 14 and when assessed at subsequent time points were in remission at week 30 or 54 [infliximab n = 99, adalimumab n = 93].
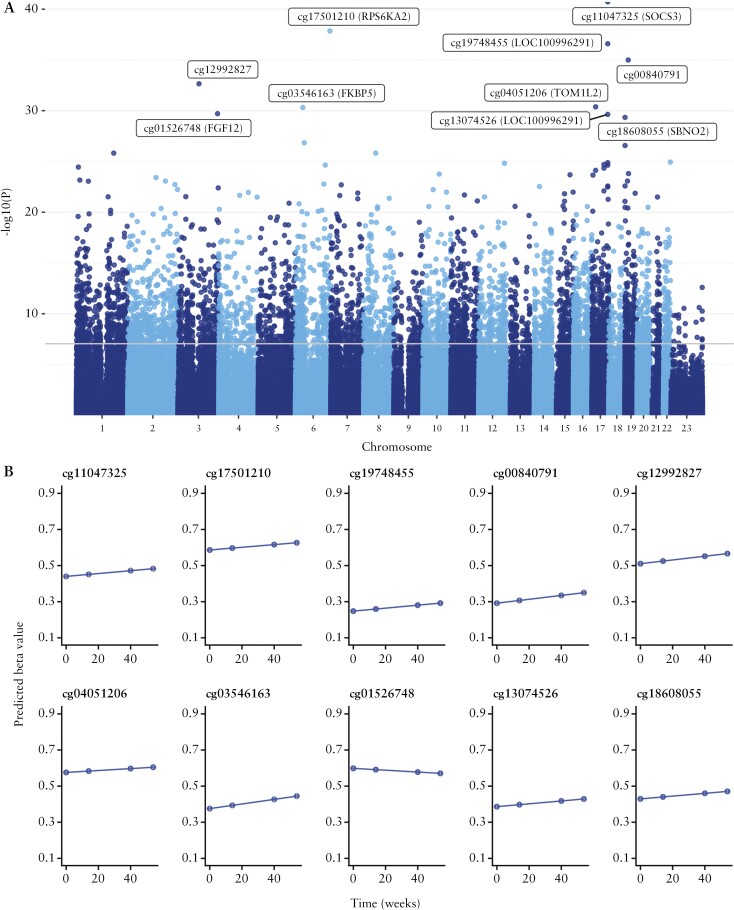
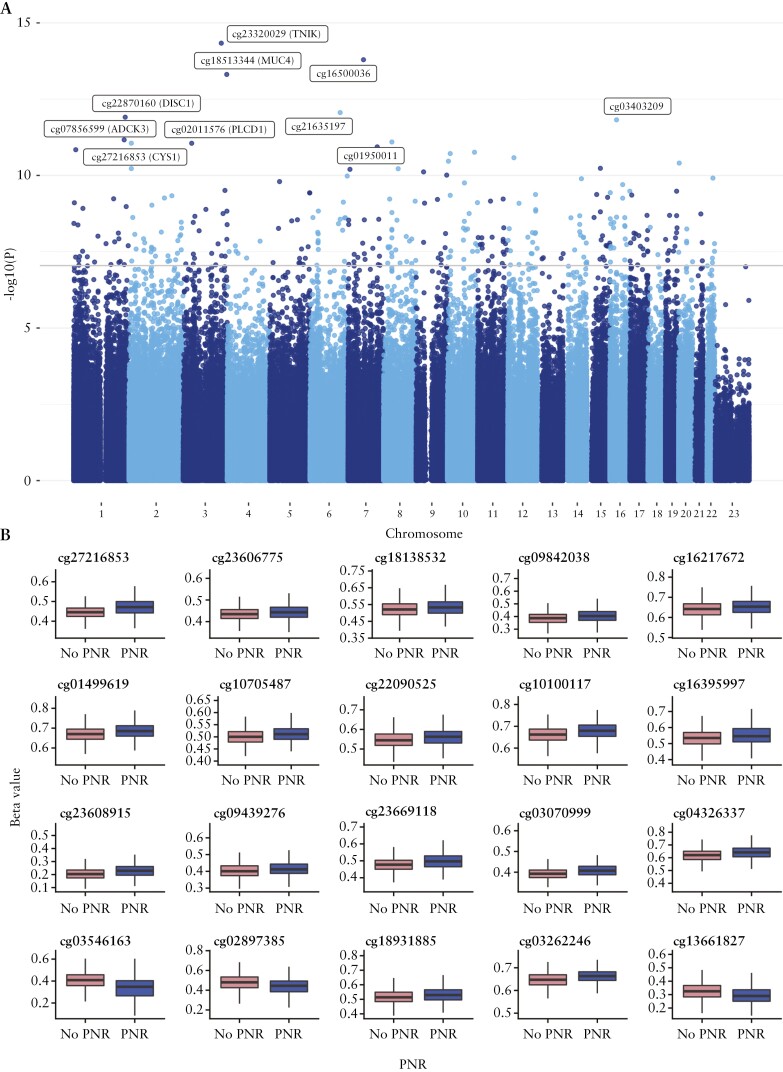
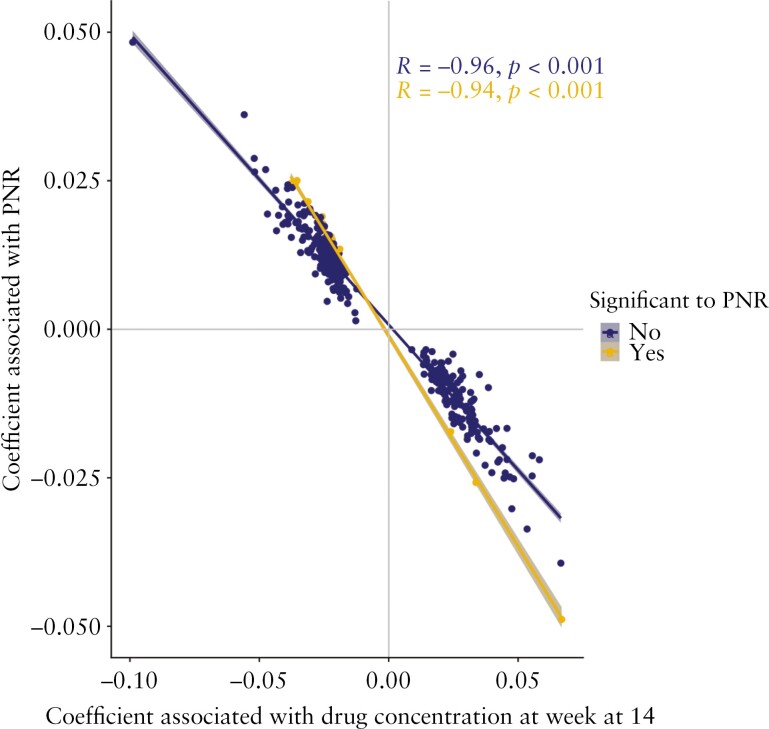
Results: Overall, between baseline and week 14, we observed 4999 differentially methylated positions [DMPs] annotated to 2376 genes following anti-TNF treatment. Pathway analysis identified 108 significant gene ontology terms enriched in biological processes related to immune system processes and responses. Epigenome-wide association [EWAS] analysis identified 323 DMPs annotated to 210 genes at baseline associated with higher anti-TNF drug concentrations at Week 14. Of these, 125 DMPs demonstrated shared associations with other common traits [proportion of shared CpGs compared with DMPs] including body mass index [23.2%], followed by C-reactive protein [CRP] [11.5%], smoking [7.4%], alcohol consumption per day [7.1%], and IBD type [6.8%]. EWAS of primary non-response to anti-TNF identified 20 DMPs that were associated with both anti-TNF drug concentration and primary non-response to anti-TNF with a strong correlation of the coefficients [Spearman's rho = -0.94, p <0.001].
Conclusion: Baseline DNA methylation profiles may be used as a predictor for anti-TNF drug concentration at week 14 to identify patients who may benefit from dose optimisation at the outset of anti-TNF therapy.
Keywords: Crohn’s disease; DNA methylation; IBD; anti-TNF; epigenetics.
© The Author(s) 2023. Published by Oxford University Press on behalf of European Crohn’s and Colitis Organisation.
Conflict of interest statement
SL reports non-financial support from Pfizer outside the submitted work. MR, JFW, VP, NS, and HG are employees of AbbVie and may own stock/options. NAK reports grants from F. Hoffmann-La Roche AG, grants from Biogen, grants from Celltrion Healthcare, grants from Galapagos NV, and non-financial support from Immundiagnostik, grants and non-financial support from AbbVie, grants and personal fees from Celltrion, personal fees and non-financial support from Janssen, personal fees from Takeda, and personal fees and non-financial support from Dr Falk, outside the submitted work. JRG reports grants from F. Hoffmann-La Roche AG, grants from Biogen, grants from Celltrion Healthcare, grants from Galapagos NV, and non-financial support from Immundiagnostik, outside the conduct of the study. TA reports grants and non-financial support from F. Hoffmann-La Roche AG, grants from Biogen, grants from Celltrion Healthcare, grants from Galapagos NV, and non-financial support from Immundiagnostik, personal fees from Biogen, grants and personal fees from Celltrion Healthcare, personal fees and non-financial support from Immundiagnostik, personal fees from Takeda, personal fees from ARENA, personal fees from Gilead, personal fees from Adcock Ingram Healthcare, personal fees from Pfizer, personal fees from Genentech, and non-financial support from Tillotts, outside the submitted work.
Figures
Comment in
-
Epigenetic Fingerprints in IBD: From Methylation Patterns to Clinical Implications.J Crohns Colitis. 2024 Aug 14;18(8):1175-1176. doi: 10.1093/ecco-jcc/jjae086. J Crohns Colitis. 2024. PMID: 38885255 No abstract available.
References
-
- Barberio B, Gracie DJ, Black CJ, Ford AC.. Efficacy of biological therapies and small molecules in induction and maintenance of remission in luminal Crohn’s disease: systematic review and network meta-analysis. Gut 2022;72:264–74. - PubMed
-
- Mao EJ, Hazlewood GS, Kaplan GG, Peyrin-Biroulet L, Ananthakrishnan AN.. Systematic review with meta-analysis: comparative efficacy of immunosuppressants and biologics for reducing hospitalisation and surgery in Crohn’s disease and ulcerative colitis. Aliment Pharmacol Ther 2017;45:3–13. . - PubMed
-
- Papamichael K, Gils A, Rutgeerts P, et al.. Role for therapeutic drug monitoring during induction therapy with TNF antagonists in IBD: evolution in the definition and management of primary nonresponse. Inflamm Bowel Dis 2015;21:182–97. - PubMed
-
- Kennedy NA, Heap GA, Green HD, et al.. Predictors of anti-TNF treatment failure in anti-TNF-naive patients with active luminal Crohn’s disease: a prospective, multicentre, cohort study. Lancet Gastroenterol Hepatol 2019;1253:1–13. - PubMed
MeSH terms
Substances
Grants and funding
LinkOut - more resources
Full Text Sources
Other Literature Sources
Medical
Research Materials
Miscellaneous
