. 2023 Oct;10(28):e2300989.
doi: 10.1002/advs.202300989. Epub 2023 Aug 8.

Low-Dose Staphylococcal Enterotoxin C2 Mutant Maintains Bone Homeostasis via Regulating Crosstalk between Bone Formation and Host T-Cell Effector Immunity

Affiliations

Low-Dose Staphylococcal Enterotoxin C2 Mutant Maintains Bone Homeostasis via Regulating Crosstalk between Bone Formation and Host T-Cell Effector Immunity

Haixing Wang et al. Adv Sci (Weinh). 2023 Oct.

Abstract

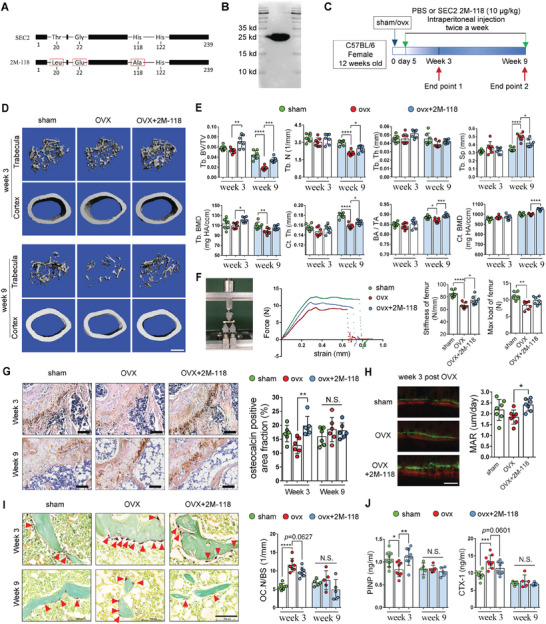
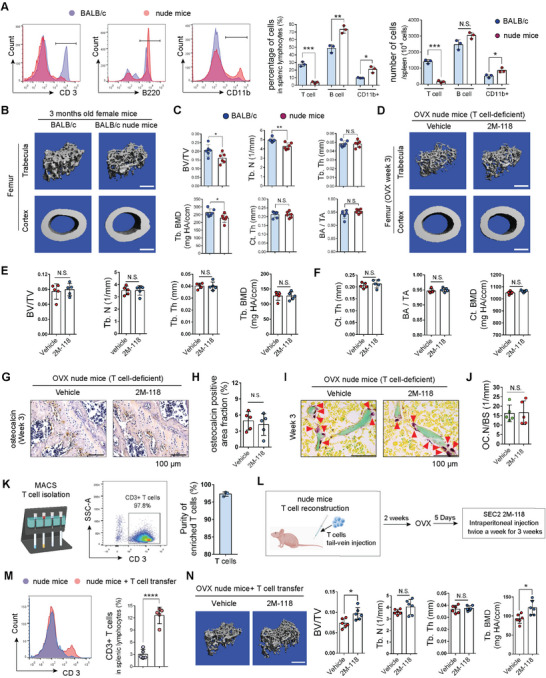
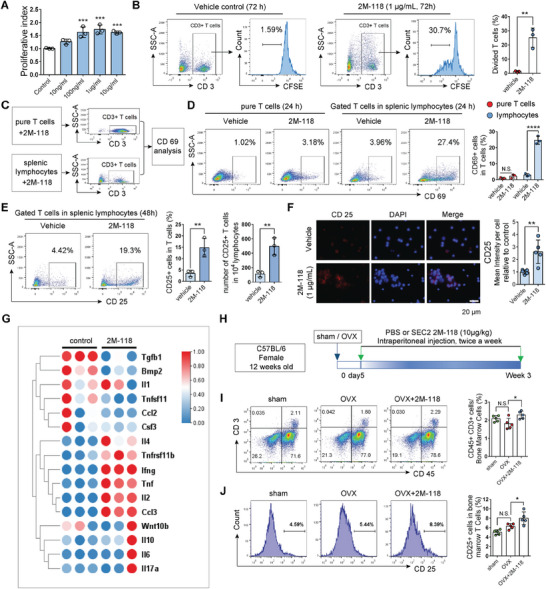
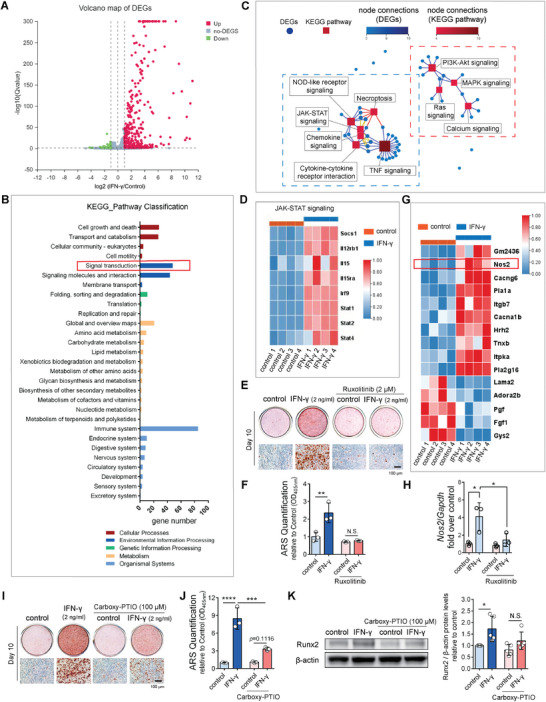
Studies in recent years have highlighted an elaborate crosstalk between T cells and bone cells, suggesting that T cells may be alternative therapeutic targets for the maintenance of bone homeostasis. Here, it is reported that systemic administration of low-dose staphylococcal enterotoxin C2 (SEC2) 2M-118, a form of mutant superantigen, dramatically alleviates ovariectomy (OVX)-induced bone loss via modulating T cells. Specially, SEC2 2M-118 treatment increases trabecular bone mass significantly via promoting bone formation in OVX mice. These beneficial effects are largely diminished in T-cell-deficient nude mice and can be rescued by T-cell reconstruction. Neutralizing assays determine interferon gamma (IFN-γ) as the key factor that mediates the beneficial effects of SEC2 2M-118 on bone. Mechanistic studies demonstrate that IFN-γ stimulates Janus kinase/signal transducer and activator of transcription (JAK-STAT) signaling, leading to enhanced production of nitric oxide, which further activates p38 mitogen-activated protein kinase (MAPK) and Runt-related transcription factor 2 (Runx2) signaling and promotes osteogenic differentiation. IFN-γ also directly inhibits osteoclast differentiation, but this effect is counteracted by proabsorptive factors tumor necrosis factor alpha (TNF-α) and interleukin 1 beta (IL-1β) secreted from IFN-γ-stimulated macrophages. Taken together, this work provides clues for developing innovative approaches which target T cells for the prevention and treatment of osteoporosis.

Keywords: IFN-γ; T cells; bone homeostasis; nitric oxide; staphylococcal enterotoxin C2.


Conflict of interest statement

Authors C.L., Y.J., J.C., and H.L. are employed by the company Shenyang Xiehe Biopharmaceutical Co. Ltd. The other authors declare that the research was conducted in the absence of any commercial or financial relationships that could be construed as a potential conflict of interest.

Figures

Figure 1
Figure 1
Systemic administration of SEC2 2M‐118 alleviates bone loss in OVX mice via promoting bone formation. A) Schematic diagram of SEC2 mutant protein 2M‐118. Red boxes indicate mutations compared with the wild type SEC2. B) The purified SEC2 2M‐118 was confirmed by Western blot. C) OVX mice received systemic administration of SEC2 2M‐118 and were terminated at two time points. D) 3D reconstruction of trabecular bone in distal femur and cortical bone in midshaft. Scale bar, 500 µm. E) Quantitative analyses of trabecular parameters (BV/TV, Tb. N, Tb. Th, Tb. Sp, and Tb. BMD) and cortical bone parameters (Ct. Th, BA/TA, Ct. BMD). n = 7. F) Three‐point bending test of femurs. Stiffness and max load of femurs were present. n = 7. G) Representative microphotographs and quantitative analyses of immunohistochemistry (IHC) staining for osteocalcin (OCN) from femur sections. Scale bar, 100 µm. n = 6. H) Representative images of calcein and xylenol orange double labeling of cortical bone in femur and quantification of mineral apposition rate (MAR). Scale bar, 50 µm. n = 7. I) Representative images of TRAP staining of osteoclasts and quantification of osteoclast number per bone surface (Oc. N/BS) in femur at weeks 3 and 9 post‐OVX‐surgery. The stained osteoclasts are indicated by arrows. Scale bar, 100 µm. n = 5–7. J) Serum levels of procollagen type I intact N‐terminal propeptide (PINP) and C‐terminal telopeptide of type 1 collagen (CTX‐1) at weeks 3 and 9 post‐OVX‐surgery. n = 5–9. Data were shown as mean ± Standard Deviation (SD). One‐way ANOVA was used with Bonferroni multiple comparisons test. * p < 0.05, ** p < 0.01, *** p < 0.001, **** p < 0.0001. N.S.: not significant.
Figure 2
Figure 2
The beneficial effects of SEC2 2M‐118 treatment on bone are largely T‐cell‐dependent. A) Comparation of the proportion and number of splenic T cells, B cells, and CD11b+ cells between BALB/c mice and nude mice. B,C) Micro‐CT reconstruction and quantitative analyses of trabecular bone (BV/TV, Tb. N, Tb. Th, and Tb. BMD) and cortical bone (Ct. Th and BA/TA) in distal femurs of 3 months old female BALB/c mice and nude mice. Scale bar in (B), 500 µm. n = 6. D–F) Micro‐CT reconstruction and quantitative analyses of trabecular bone (E) and cortical bone (F) in distal femurs of OVX nude mice after SEC2 2M‐118 treatment for 3 weeks. Scale bar in (D), 500 µm. n = 5. G,H) Representative images and quantitative analyses of IHC staining of OCN from femur sections at week 3 post‐OVX‐surgery. Scale bar, 100 µm. n = 5. I,J) Representative images and quantitative analyses of TRAP staining of osteoclasts in femurs at week 3 post‐OVX‐surgery. The stained osteoclasts are indicated by arrows. Scale bar, 100 µm. n = 5. K) Pure T cells were enriched from splenocytes of 3 months old BALB/c mice. The purity of T cells was confirmed by flow cytometry. n = 3. L) 3 months old nude mice were subjected to adoptive transfer of wild type BALB/c splenic T cells, which was followed by OVX surgery and 2M‐118 treatment. M) Verification of T‐cell reconstruction in nude mice 2 weeks after T‐cell transfer. n = 5. N) Micro‐CT reconstruction and quantitative analyses of trabecular bone (BV/TV, Tb. N, Tb. Th, and Tb. BMD) in distal femurs of nude mice with T‐cell reconstruction after 2M‐118 treatment. Scale bar in (N), 500 µm. n = 6. Data were shown as mean ± SD. Student's t‐test was used to compare parameters between two groups. One‐way ANOVA with Bonferroni multiple comparisons test was used for multiple comparisons. * p < 0.05, ** p < 0.01, *** p < 0.001, **** p < 0.0001, N.S.: not significant.
Figure 3
Figure 3
SEC2 2M‐118 promotes T‐cell proliferation and activation. A) Effect of SEC2 2M‐118 on the proliferation of splenic lymphocytes in vitro was determined by MTT assay after 3 days of stimulation. n = 3. B) Splenic lymphocytes were labeled with CFSE and treated with PBS or SEC2 2M‐118 (1 µg mL−1) for 3 days. The proportion of divided cells in T cells was determined by flow cytometry analysis. n = 3. C,D) Pure T cells or splenic lymphocytes were stimulated with or without SEC2 2M‐118 (1 µg mL−1) for 24 h. The activation of T cells was tested by evaluating CD69 using flow cytometry. n = 3. E) Proportion and absolute number of CD25+ T cells after SEC2 2M‐118 stimulation. n = 3. F) Representative images and quantitative analyses of immunofluorescent staining of CD25 in splenic lymphocytes after SEC2 2M‐118 (1 µg mL−1) stimulation. n = 5. G) Splenic lymphocytes were stimulated with SEC2 2M‐118 for 24 h. Total RNA was extracted. The expression levels of various secreted factors in 2M‐118 groups relative to control groups were presented by heatmap. H–J) OVX mice were treated with or without SEC2 2M‐118 for 3 weeks. The proportions of bone marrow total T cells (I) and CD25+ cells in total T cells (J) were analyzed by flow cytometry. n = 5. Data were shown as mean ± SD. Student's t‐test was used to compare parameters between two groups. One‐way ANOVA with Bonferroni multiple comparisons test was used for multiple comparisons. * p < 0.05, ** p < 0.01, *** p < 0.001, **** p < 0.0001. N.S.: not significant.
Figure 4
Figure 4
IFN‐γ is the key factor that mediates the promoting effect of SEC2 2M‐118 treatment on bone formation. A,B) Alizarin red staining (A) and RT‐qPCR analysis of Bglap (OCN) (B) showed various dosages of 2M‐118 exhibited no direct effects on osteogenic differentiation of MC‐3T3‐E1 cells. n = 3. C) Preparation of conditioned medium from splenic lymphocytes or enriched T cells was performed. The lymphocytes were obtained from C57BL/6 mice, BALB/c mice, or nude mice, while the enriched T cells were obtained from 2M‐118 prestimulated splenic lymphocytes (C57BL/6). D) MC‐3T3‐E1 cells were induced to differentiate into osteoblasts for 10 days. C‐CM (10%) or 2M‐118‐CM (10%) prepared from C57BL/6 mice, nude mice, or BALB/c mice was added into the differentiation medium. Quantification of Alizarin red staining showed the effects of 2M‐118‐CM on osteogenesis with or without the presence of T cells when conditioned medium was prepared. n = 3. Scale bar, 100 µm. E) Conditioned medium from enriched T cells (T‐C‐CM or T‐2M‐118‐CM, final concentration 20%) was added into the differentiation medium in osteogenesis assay. Quantification of Alizarin red staining showed the effects of T‐2M‐118‐CM on osteogenesis. n = 3. Scale bar, 100 µm. F) mRNA expression levels of Ifng, Tnf, and Il2 in splenic lymphocytes after SEC2 2M‐118 stimulation. n = 3. G,H) Alizarin red staining (G) and RT‐qPCR (H) of Bglap (OCN) showed the effects of neutralization of specific cytokines (IFN‐γ, TNF‐α, and IL‐2) in 2M‐118‐CM on osteogenic differentiation and mineralization. n = 3. Scale bar in (G), 100 µm. I) Concentrations of IL‐2 and TNF‐α in 2M‐118‐CM collected at different time points. n = 3. J) Concentrations of IFN‐γ in 2M‐118‐CM collected at different time points. n = 3. K) Changes of serum IFN‐γ levels after the 1st exposure of SEC2 2M‐118 in C57BL/6 mice. n = 4–5. L) Serum IFN‐γ levels after the 6th exposure of SEC2 2M‐118 in OVX mice at week 3 post‐OVX‐surgery. n = 5. M) mRNA expression levels of Ifng in splenic lymphocytes from BALB/c mice or nude mice after SEC2 2M‐118 stimulation. n = 3. N,O) Splenic lymphocytes were stimulated with or without SEC2 2M‐118 (1 µg mL−1) for 12 or 24 h. The proportion of IFN‐γ secreting cells in T cells, and the percentages of T cells, CD4+ T cells, and CD8+ T cells in total IFN‐γ secreting cells were analyzed by flow cytometry. Phorbol 12‐myristate 13‐acetate (PMA)/ionomycin treatment was set as positive controls in (N), n = 3. Data were shown as mean ± SD. Student's t‐test was used to compare parameters between two groups. One‐way ANOVA with Bonferroni multiple comparisons test was used for multiple comparisons. * p < 0.05, ** p < 0.01, *** p < 0.001, **** p < 0.0001. N.S.: not significant.
Figure 5
Figure 5
Nitric oxide mediates the promoting effect of IFN‐γ on bone formation. A) MC‐3T3‐E1 cells were induced to differentiate into osteoblasts with or without IFN‐γ (2 ng mL−1) for 7 days. Total RNA was collected for RNA‐sequencing analysis. A volcano map illustrating differentially expressed genes (DEGs) from RNA‐seq analysis between the control and IFN‐γ‐treated group. B) KEGG pathway classification analysis of all DEGs in (A). DEGs were grouped according to the following biological pathway: cellular processes; environmental information processing; genetic information processing; metabolism; organismal systems. C) KEGG pathway relationship network of the DEGs which were classified into signal transduction group in (B): the top 10 pathways with the largest number of genes were displayed. The blue dotted box and red dotted box highlighted two clusters of DEGs with close relationship. D) Heatmap of DEGs grouped into JAK–STAT signaling pathway presented in (C). E) Alizarin red staining showing the effect of JAK–STAT signaling inhibitor ruxolitinib (2 µm) on blocking the effect of IFN‐γ on osteoblast differentiation from MC‐3T3‐E1 cells. F) Quantification of Alizarin red staining in (E). n = 3. G) Heatmap of DEGs grouped into the cluster highlighted by red dotted box in (C). DEGs were ranked by fold change. H) Real‐time qPCR analysis of mRNA levels of Nos2 in MC‐3T3‐E1 cells after IFN‐γ stimulation for 7 days with or without JAK–STAT signaling inhibitor ruxolitinib (2 µm). n = 3. I) Alizarin red staining showing the effects of IFN‐γ on osteoblast differentiation with or without the presence of NO scavenger carboxy‐PTIO (100 µm). J) Quantification of Alizarin red staining in (I). n = 3. K) Western blot analysis of protein expression levels of Runx2 in MC‐3T3‐E1 cells after IFN‐γ stimulation for 7 days with or without the presence of NO scavenger carboxy‐PTIO (100 µm). β‐actin served as loading control. n = 3. Data were shown as mean ± SD. One‐way ANOVA with Bonferroni multiple comparisons test was used for multiple comparisons. * p < 0.05, ** p < 0.01, *** p < 0.001, **** p < 0.0001. N.S.: not significant.
Figure 6
Figure 6
Nitric oxide magnifies the promoting effect of low‐dose IFN‐γ on osteoblast differentiation via p38 MAPK–Runx2 signaling. A) Preparation of conditioned medium using splenocytes from C57BL/6 mouse. B) The concentration of nitric oxide in the conditioned medium from days 1 to 3. n = 3. C–E) OVX nude mice received systemic administration of conditioned medium (100 µL per 20 g) prepared in (A) with or without the neutralization of IFN‐γ (10 µg mL−1 neutralizing antibody) or the scavenging of nitric oxide (carboxy‐PTIO, 1 mm in conditioned medium) for 3 weeks. 3D reconstruction and quantitative analyses of trabecular bone (BV/TV, Tb. N, Tb. Th, and Tb. BMD) in distal femurs of nude mice were shown in (D) and (E), respectively. n = 7. Scale bar in (D), 500 µm. F,G) IFN‐γ (100 pg mL−1), NO donor SNAP (20 µm), or a combination of both regents were added into the osteogenic induction medium of MC‐3T3‐E1 cells. ALP staining (F) and Western blot analysis of Runx2 (G) were performed on day 5. n = 3 in (G). H) Nitric oxide donor SNAP (100 µm) was added to MC‐3T3‐E1 cells for different times. Phosphorylation of p38 MAPK was determined and analyzed by Western blot. n = 3. I) Alizarin red staining showing the effects of p38 MAPK inhibitor SB 203580 (20 µm) and JNK inhibitor II (20 µm) on interfering the effect of IFN‐γ on osteoblast differentiation from MC‐3T3‐E1 cells. Scale bar, 100 µm. J) Quantification of Alizarin red staining in (I). n = 3. K) Western blot analysis of protein expression levels of Runx2 in MC‐3T3‐E1 cells after 5 days differentiation with or without the presence of p38 MAPK inhibitor SB 203580 (20 µm). n = 3. L) The schematic shows the proposed mechanism in which IFN‐γ promotes osteoblast differentiation. Data were shown as mean ± SD. Two‐way ANOVA with Bonferroni multiple comparisons test was used in (B). One‐way ANOVA was used with Bonferroni multiple comparisons test in (E), (G), (H), and (J). Student's t‐test was used in (K). * p < 0.05, ** p < 0.01, **** p < 0.0001. N.S.: not significant.
Figure 7
Figure 7
SEC2 2M‐118 modulates osteoclast differentiation via secreted factors from T cells and macrophages. A,B) TRAP staining (A) and RT‐qPCR analysis of cathepsin K (Ctsk) (B) showing the direct effects of SEC2 2M‐118 on osteoclastic differentiation from primary bone marrow monocytes. n = 3. C) Preparation of C‐CM and 2M‐118‐CM from splenic lymphocytes (C57BL/6 mice, nude mice, and BALB/c mice). D,E) Primary bone marrow monocytes were induced to differentiate into osteoclasts for 5 days. C‐CM (5%) or 2M‐118‐CM (5%) prepared from C57BL/6 mice, nude mice, or BALB/c mice were added into the differentiation medium. TRAP staining showed the effects of 2M‐118‐CM on osteoclastogenesis. n = 3. F) TRAP staining and RT‐qPCR analysis of Ctsk showed the neutralization of IFN‐γ in 2M‐118‐CM partially abolished its inhibiting effect on osteoclastogenesis. n = 3. G) RAW 264.7 cells were stimulated with IFN‐γ (2 ng mL−1) or PBS for 1 day. Culture medium was replenished, and supernatant was collected as IFN‐γ‐Mφ‐CM or C‐Mφ‐CM after another 24 h. Then, the collected conditioned medium was used for osteoclastogenesis at a concentration of 20%. H) RT‐qPCR analysis of various cytokines in RAW 264.7 cells with or without the stimulation of IFN‐γ (2 ng mL−1) for 12 h n = 3. I) TRAP staining showed the effects of C‐Mφ‐CM, IFN‐γ‐Mφ‐CM, and the neutralization of TNF‐α and IL‐1β in IFN‐γ‐Mφ‐CM on osteoclast differentiation. n = 3. J) Serum levels of OPG and RANKL after SEC2 2M‐118 treatment at weeks 3 and 9 post‐OVX‐surgery. n = 5–8. K) Splenic lymphocytes were treated with or without SEC2 2M‐118 (1 µg mL−1) for 3 days. T cells and B cells were isolated, and total RNA was extracted for RT‐qPCR analysis of Opg expression. MC‐3T3‐E1 cells were treated with C‐CM (5%) or 2M‐118‐CM (5%) for 24 h. The OPG expression levels were also analyzed by RT‐qPCR. n = 3. L) Splenic lymphocytes were treated with or without SEC2 2M‐118 (1 µg mL−1) for 3 days. The concentrations of OPG and RANKL in the conditioned medium were tested by ELISA. n = 3. M) MC‐3T3‐E1 cells were treated with C‐CM or 2M‐118‐CM for 24 h. Then, the culture medium was replenished with fresh α‐MEM for another 24 h. The conditioned medium was collected and concentration of OPG was evaluated. n = 3. Data were shown as mean ± SD. Student's t‐test was used to compare parameters between two groups in (H), (K), (L) and (M). One‐way ANOVA with Bonferroni multiple comparisons test was used for multiple comparisons in (A), (B), (E), (F), (I) and (J). * p < 0.05, ** p < 0.01, *** p < 0.001. N.S.: not significant.

Similar articles

Cited by

References

    1. Ragipoglu D., Dudeck A., Haffner‐Luntzer M., Voss M., Kroner J., Ignatius A., Fischer V., Front. Immunol. 2020, 11, 163. - PMC - PubMed
    1. Arboleya L., Castaneda S., Reumatol. Clin. 2013, 9, 303. - PubMed
    1. Tsukasaki M., Takayanagi H., Nat. Rev. Immunol. 2019, 19, 626. - PubMed
    1. Faienza M. F., Ventura A., Marzano F., Cavallo L., Clin. Dev. Immunol. 2013, 2013, 575936. - PMC - PubMed
    1. Li Y., Toraldo G., Li A., Yang X., Zhang H., Qian W. P., Weitzmann M. N., Blood 2007, 109, 3839. - PMC - PubMed

LinkOut - more resources