. 2023 Oct 17;32(21):3063-3077.
doi: 10.1093/hmg/ddad130.

Macrocephaly and developmental delay caused by missense variants in RAB5C

Collaborators, Affiliations

Macrocephaly and developmental delay caused by missense variants in RAB5C

Klaas Koop et al. Hum Mol Genet. .

Abstract

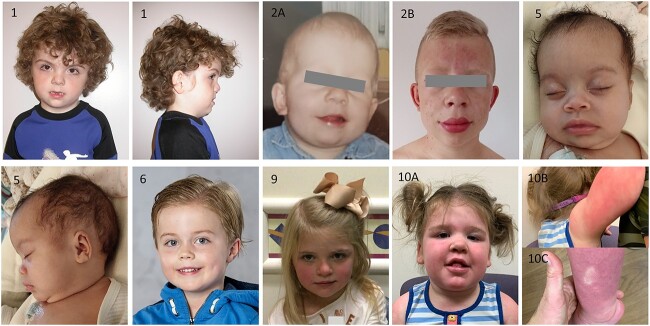
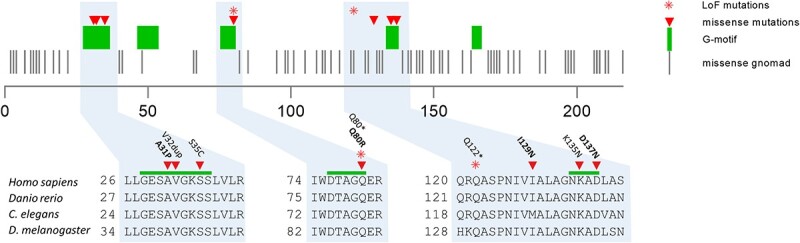
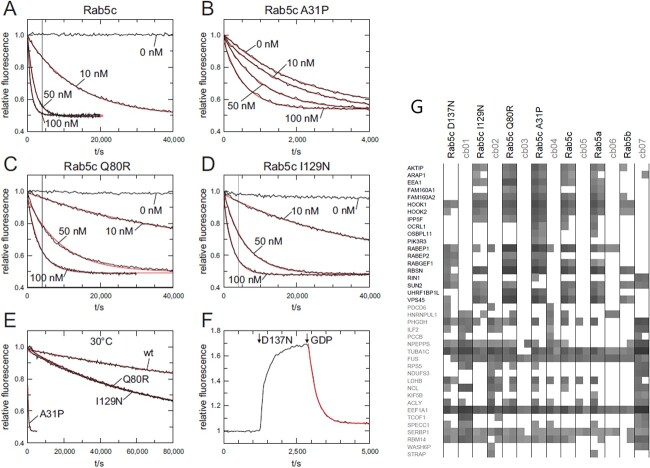
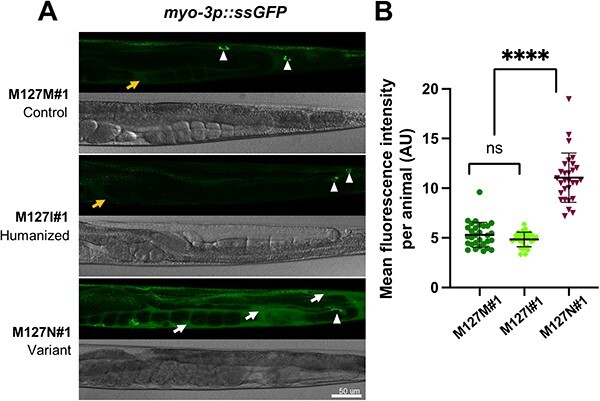
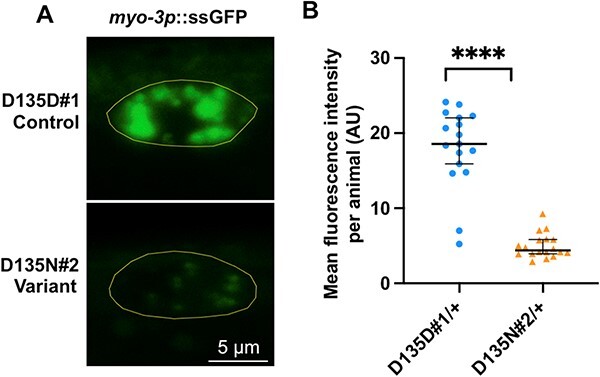
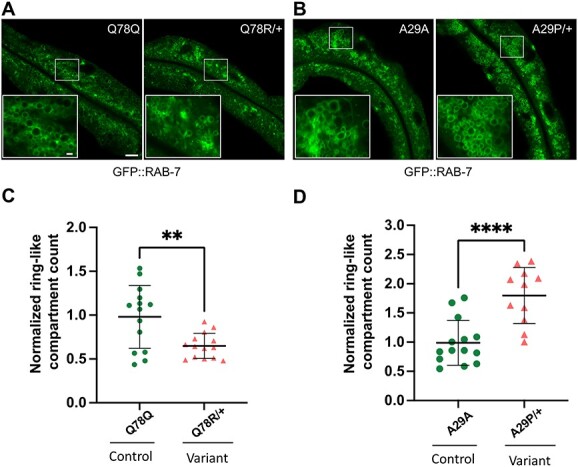
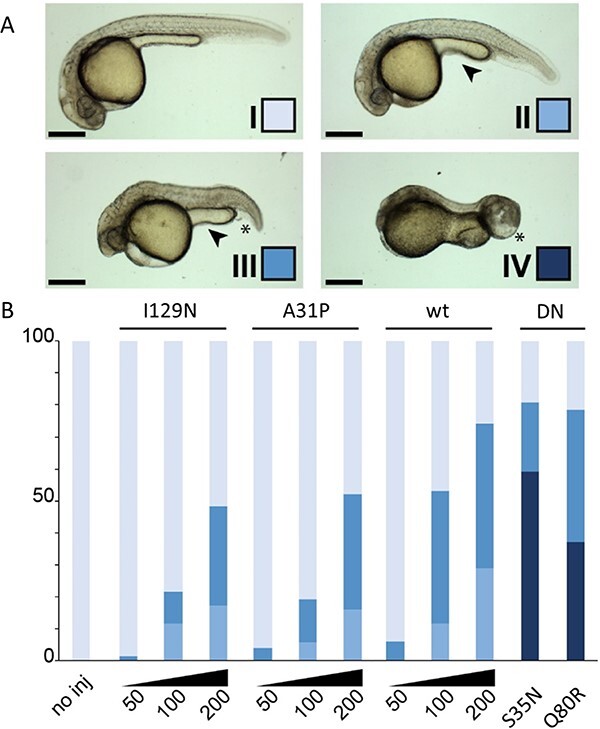
Rab GTPases are important regulators of intracellular vesicular trafficking. RAB5C is a member of the Rab GTPase family that plays an important role in the endocytic pathway, membrane protein recycling and signaling. Here we report on 12 individuals with nine different heterozygous de novo variants in RAB5C. All but one patient with missense variants (n = 9) exhibited macrocephaly, combined with mild-to-moderate developmental delay. Patients with loss of function variants (n = 2) had an apparently more severe clinical phenotype with refractory epilepsy and intellectual disability but a normal head circumference. Four missense variants were investigated experimentally. In vitro biochemical studies revealed that all four variants were damaging, resulting in increased nucleotide exchange rate, attenuated responsivity to guanine exchange factors and heterogeneous effects on interactions with effector proteins. Studies in C. elegans confirmed that all four variants were damaging in vivo and showed defects in endocytic pathway function. The variant heterozygotes displayed phenotypes that were not observed in null heterozygotes, with two shown to be through a dominant negative mechanism. Expression of the human RAB5C variants in zebrafish embryos resulted in defective development, further underscoring the damaging effects of the RAB5C variants. Our combined bioinformatic, in vitro and in vivo experimental studies and clinical data support the association of RAB5C missense variants with a neurodevelopmental disorder characterized by macrocephaly and mild-to-moderate developmental delay through disruption of the endocytic pathway.


Figures

Figure 1
Figure 1
Photographs of patients with RAB5C variants, showing macrocephaly and (increase in) coarse facial features in several patients.
Figure 2
Figure 2
RAB5C is depicted along with known G-motifs (green bars). Missense mutations as retrieved from gnomAD are depicted with gray bars. Rab5c variants found in patients are depicted in triangles (missense) and asterisk (frameshift). Note that most missense mutations localize to a G-motif that is essential in nucleotide binding, except for one patient (I129N) that had a relatively mild phenotype. Variants used for further functional characterization in bold.
Figure 3
Figure 3
Structural visualization of Rab5c variants. (A) Crystal structure of Rab5c bound to the hydrolysis-resistant GTP analogue GppNHp (pdb-entry 1HUQ). Tints of gray are used to illustrate the incompatibility of the non-sense variants with protein folding; dark gray, N-terminal part till residue 80; light gray C-terminal part from residue 122 onward. GppNHp (blue) and residues affected by point mutations (red) are shown in ball-and-stick representation. (B) Detailed view of the phosphate binding cavity. For clarity, only the three phosphates of the nucleotide are shown and labeled α, β and γ. The direction of the nucleophilic attack of a water molecule (w) to the γ-phosphate in course of the non-GAP catalyzed hydrolysis reaction is indicated by a red arrow. Residues affected by point mutations are colored in a tint of red. Dotted lines, hydrogen bonds. (C) Interaction of the base with the NKxD motif. For clarity of representation, only the base of the nucleotide is shown. (D) Hydrophobic environment of Ile129. Figures were generated by use of the programs molscript (55) and Raster3D (56).
Figure 4
Figure 4
Intrinsic and GEF Rin1 catalyzed nucleotide exchange. (A)–(D) Nucleotide exchange rates of 200 nM Rab5c wt and Rab variants in the absence or presence of different concentrations of Rin1 (0–100 nM) as indicated at 20°C. The vertical grey line in (A), (C) and (D) corresponds to the length of the x-axis in (B). (E) Intrinsic nucleotide exchange rates of Rab5C wt and Rab5c variants at 30°C. (F) 1300 nM Rab5c D137N and subsequently 10 mm GPD were added to 200 nM mGDP at 20°C. (G). GTPγS-loaded Rab5c proteins, together with seven different unrelated reference baits (cb01 to cb07), were immobilized and used for precipitation of interacting proteins from HeLa cell lysates, in duplicate (49). The precipitation proteins were identified by mass spectroscopy. The summed peptide intensities of individual identified proteins were logarithmical-transformed to the basis of 10 and are represented by shades of gray. Note, intensities smaller than 104 are not obtained due to technical constraints. The 19 identified known Rab binding proteins (in bold, y-axis) and randomly selected ‘background’ proteins are shown.
Figure 5
Figure 5
rab-5 M127N homozygotes are defective in endocytic uptake. (A) Steady-state levels of ssGFP (arIs37[myo-3p::ssGFP]) in rab-5 M127M#1 control edit homozygotes (top), rab-5 M127I#1 humanized edit homozygotes (middle) and rab-5 M127N#1 variant homozygotes (bottom). Representative GFP (above) and bright-field (below) images of the posterior half of worms are shown. In M127M#1 control edit and M127I#1 humanized edit homozygotes, there is rapid endocytic uptake of ssGFP from the body cavity (weak signal, orange arrow) into coelomocytes (white arrowheads). In M127N#1 variant homozygotes, ssGFP accumulates in the body cavity (strong signal, white arrows) with limited uptake in coelomocytes (white arrowhead), although this is difficult to visualize with the large amount of ssGFP in the surrounding body cavity. Scale bar, 50 μm. Full genotypes of strains are listed in Supplementary Material, Table S2. (B) Quantification of mean GFP fluorescence intensity per animal, in arbitrary units (AU) (assessed with ImageJ) for rab-5 M127M#1 control edit homozygotes (dark green), rab-5 M127I#1 humanized edit homozygotes (light green) and rab-5 M127N#1 variant homozygotes (dark red). Three independent biological replicates were combined for each genotype. n = 10 per condition. Scatter plots indicate the median with 95% confidence interval. Differences between groups were determined using ordinary one-way ANOVA followed by a Dunnett multiple-comparisons test. ns, not significant; ****P < 0.0001.
Figure 6
Figure 6
rab-5 D135N heterozygotes are defective in endocytic uptake. (A) Confocal images showing the steady-state ssGFP level in coelomocytes (yellow outline) of a rab-5 D135D#1 control edit heterozygote (top) and a D135N#2 variant edit heterozygote (bottom). Scale bar, 5 μm. All genotypes were generated by crosses with wild-type males; the full genotypes of the parental strains are listed in Supplementary Material, Table S2. (B) Quantification of the mean GFP fluorescent intensity from rab-5 D135D#1 (circles) (n = 17) and D135N#2 (triangles) (n = 18) heterozygous coelomocytes. The scatter plot shows the mean and standard deviation. Differences between groups were determined by Student’s t-test. ****P < 0.0001.
Figure 7
Figure 7
rab-5 Q78R and A29P heterozygotes contain altered numbers of normal size GFP::RAB-7 late endosomes. Assessment of late endosome formation with marker GFP::RAB-7 in Q78R and A29P variant heterozygotes. (A) and (B) Low-magnification GFP::RAB-7 fluorescent images of a middle plane from the worm intestine, with the lumen running along the length and insets (lower left) showing high-magnification confocal views of late endosome ring-like structures, in cross section. Images from (A) the Q78Q control edit (left) and Q78R variant edit (right) heterozygotes and (B) the A29A control edit (left) and A29P variant edit (right) heterozygotes. (C) and (D) Scatter plot of the normalized number of ring-like compartments viewed in cross section for (C) Q78Q control edit (green circles) (n = 15) and Q78R variant edit (orange triangles) (n = 14) heterozygotes and (D) A29A control edit (green circles) (n = 14) and A29P variant edit (orange triangles) (n = 11) heterozygotes. The scatter plot shows the mean and standard deviation. Differences between groups were determined by Student’s t-test. **P < 0.01, and ***P < 0.001. Whole image scale bar, 10 μm. The panel at the bottom left inset shows a zoomed-in region represented by the white rectangle in the main image, inset scale bar, 1 μm.
Figure 8
Figure 8
Rab5c variants and dose disturb zebrafish development. Expression of the Rab5c variants was achieved by mRNA microinjection in zebrafish embryos. The different classes and color scheme (A) are defined on developmental parameters such as cephalic development, anterior–posterior axis, caudal edema formation and yolk extension shape. Tissue necrosis and abnormal tail growth are also observed. Class I depicts normal development. Class II displays mild developmental defects observable in the reduced size of the eyes and slight shortening of the AP axis. The yolk extension is short and thick (arrowhead). In class III, the AP axis is visibly shortened, the yolk extension is further shortened and caudal edema may be observed (asterisk). These phenotypes are further exacerbated in class IV; here, head necrosis is also visible. (B) Quantification of the phenotypical classification as described in (A) for the tested Rab5c variants. The y-axis is the percentage of embryos showing each of the four classes. Note the dose–response effect obtained with wt, A31P and I129N variants with increasing mRNA quantities (from 50 pg/embryo to 200 pg/embryo). Injections with S35N and Q80R were carried out at 50 pg/embryo. Scale bars: 100 μm. DN: dominant negative.

References

    1. Zhen, Y. and Stenmark, H. (2015) Cellular functions of Rab GTPases at a glance. J. Cell Sci., 128, 3171–3176. - PubMed
    1. Lamers, I.J.C., Reijnders, M.R.F., Venselaar, H., Kraus, A., Study, D.D.D., Jansen, S., deVries, B.B.A., Houge, G., Gradek, G.A., Seo, J.et al. (2017) Recurrent De novo mutations disturbing the GTP/GDP binding pocket of RAB11B cause intellectual disability and a distinctive brain phenotype. Am. J. Hum. Genet., 101, 824–832. - PMC - PubMed
    1. Bem, D., Yoshimura, S.-I., Nunes-Bastos, R., Bond, F.C., Bond, F.F., Kurian, M.A., Rahman, F., Handley, M.T.W., Hadzhiev, Y., Masood, I.et al. (2011) Loss-of-function mutations in RAB18 cause Warburg micro syndrome. Am. J. Hum. Genet., 88, 499–507. - PMC - PubMed
    1. Giannandrea, M., Bianchi, V., Mignogna, M.L., Sirri, A., Carrabino, S., D’Elia, E., Vecellio, M., Russo, S., Cogliati, F., Larizza, L.et al. (2010) Mutations in the small GTPase gene RAB39B are responsible for X-linked mental retardation associated with autism, epilepsy, and macrocephaly. Am. J. Hum. Genet., 86, 185–195. - PMC - PubMed
    1. Veleri, S., Punnakkal, P., Dunbar, G.L. and Maiti, P. (2018) Molecular insights into the roles of Rab proteins in intracellular dynamics and neurodegenerative diseases. NeuroMolecular Med., 20, 18–36. - PubMed

Publication types

MeSH terms

Substances