. 2023 Aug 8;21(8):e3002222.
doi: 10.1371/journal.pbio.3002222. eCollection 2023 Aug.

Functional unknomics: Systematic screening of conserved genes of unknown function

Affiliations

Functional unknomics: Systematic screening of conserved genes of unknown function

João J Rocha et al. PLoS Biol. .

Abstract

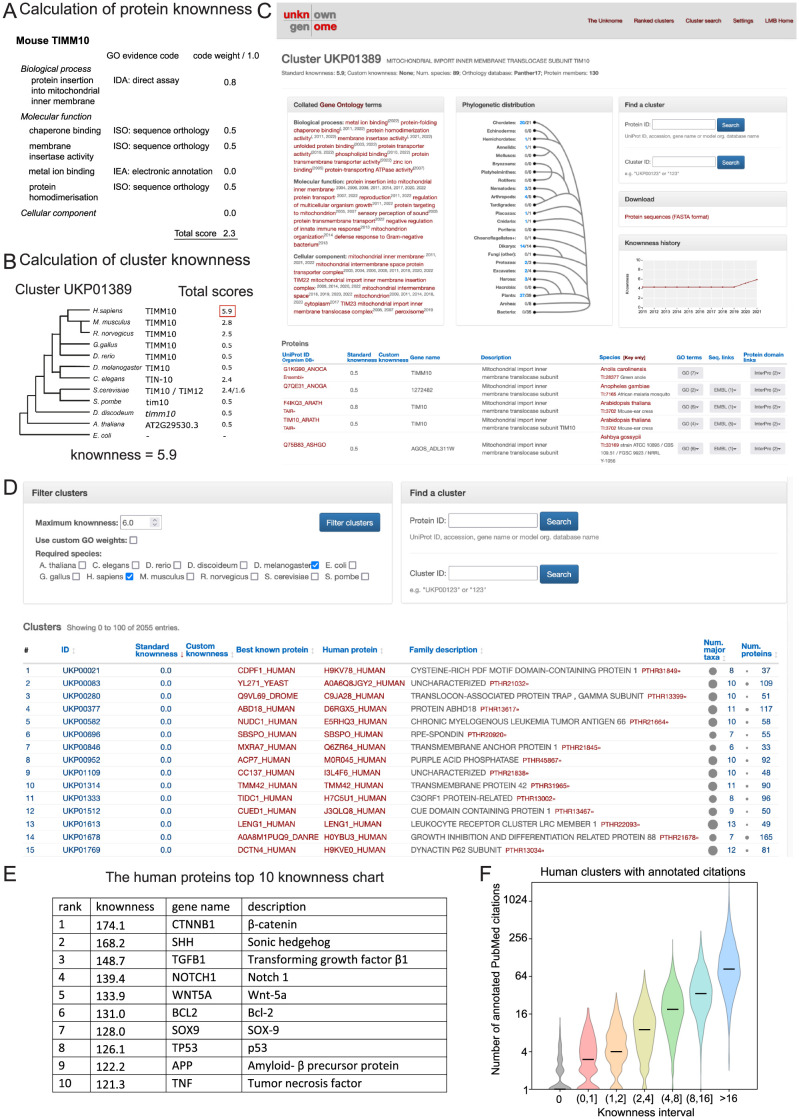
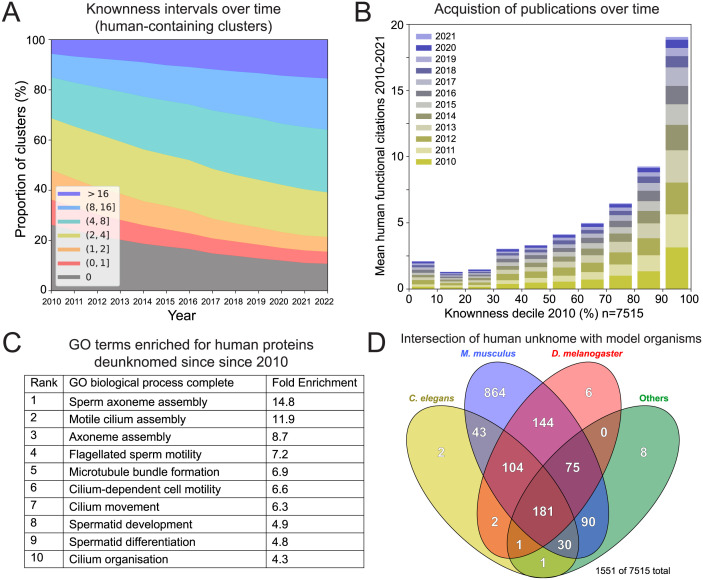
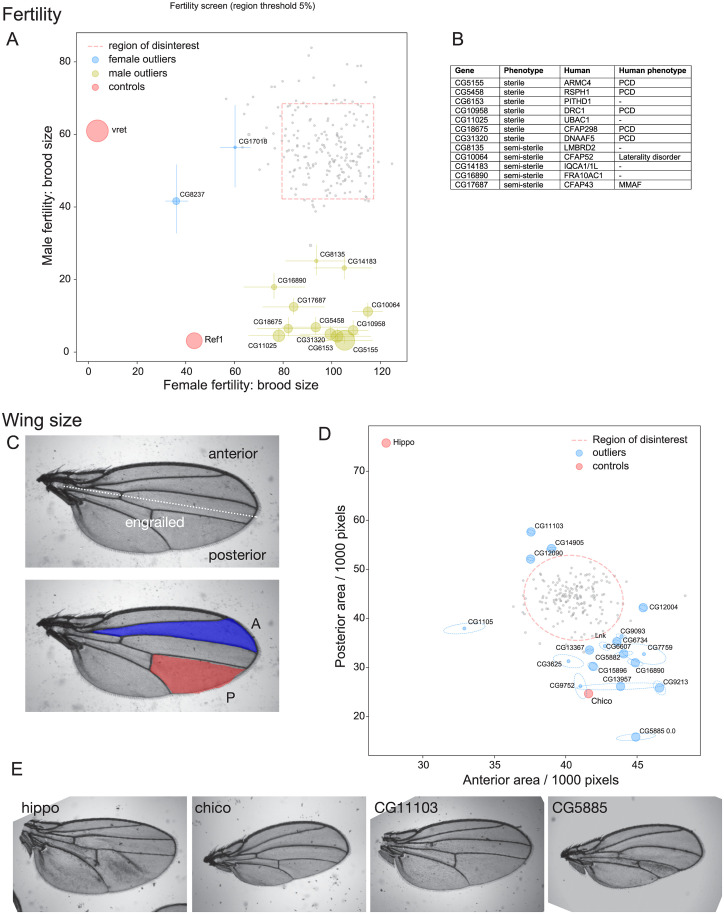
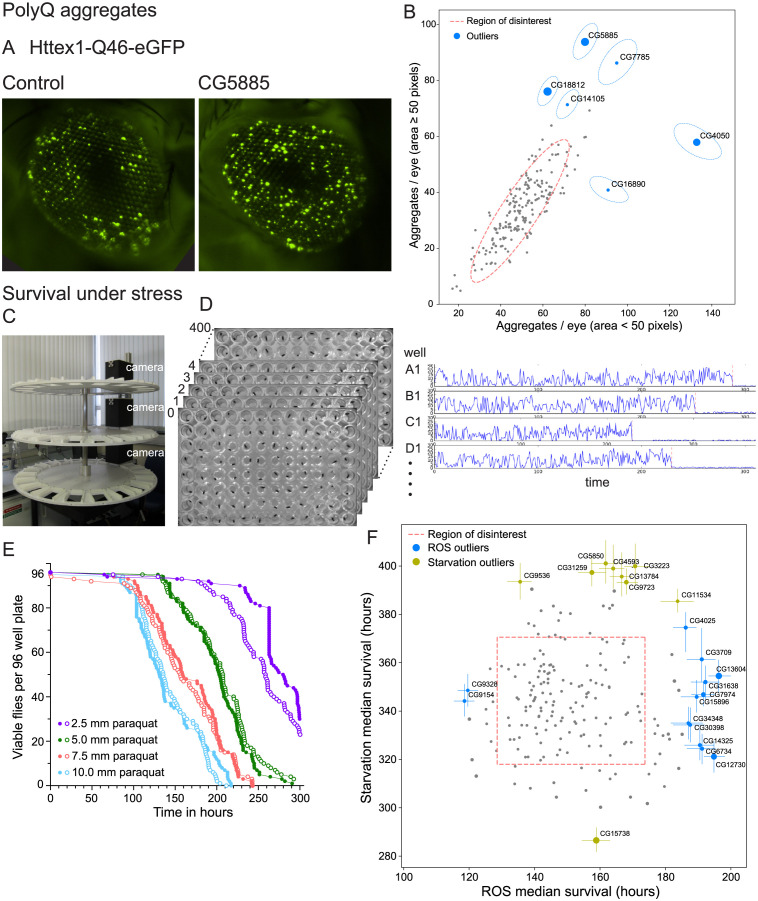
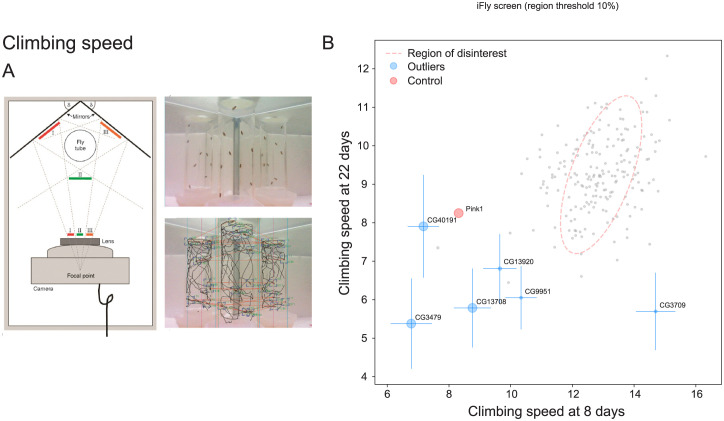
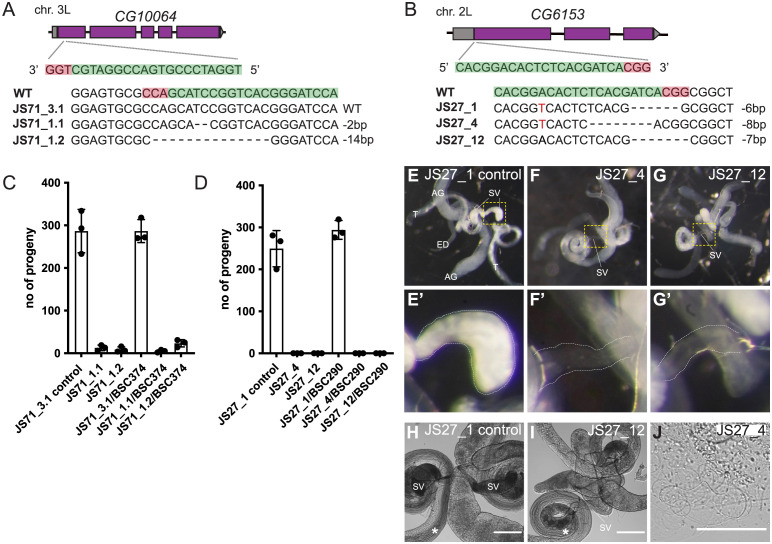
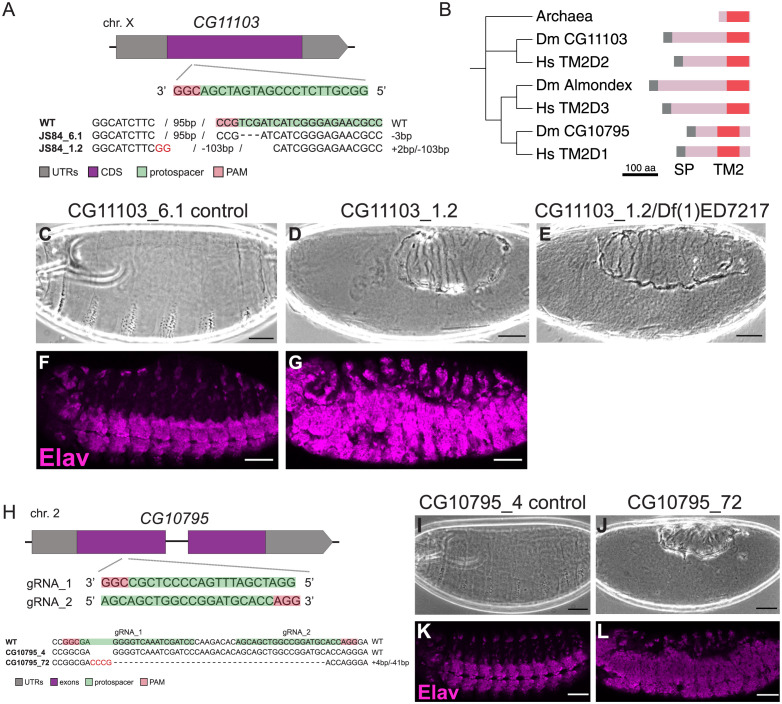
The human genome encodes approximately 20,000 proteins, many still uncharacterised. It has become clear that scientific research tends to focus on well-studied proteins, leading to a concern that poorly understood genes are unjustifiably neglected. To address this, we have developed a publicly available and customisable "Unknome database" that ranks proteins based on how little is known about them. We applied RNA interference (RNAi) in Drosophila to 260 unknown genes that are conserved between flies and humans. Knockdown of some genes resulted in loss of viability, and functional screening of the rest revealed hits for fertility, development, locomotion, protein quality control, and resilience to stress. CRISPR/Cas9 gene disruption validated a component of Notch signalling and 2 genes contributing to male fertility. Our work illustrates the importance of poorly understood genes, provides a resource to accelerate future research, and highlights a need to support database curation to ensure that misannotation does not erode our awareness of our own ignorance.


Conflict of interest statement

The authors have declared that no competing interests exist.

Figures

Fig 1
Fig 1. The Unknome database.
(A, B) Calculation of a knownness score for a cluster of orthologs based on the highest score in the cluster. Illustrated with a cluster corresponding to a subunit of a mitochondrial inner membrane translocase; (A) shows the GO annotations for mouse TIMM10, and derivation of a score based on the number of annotations weighted for their confidence, while (B) shows the scores for all the members of the cluster containing TIMM10 (UKP01389), with the highest score of a member being the knownness of the cluster. (C) The Unknome database contains information for each cluster showing its distribution across species, links to information for the protein from each species, and the change in knownness over time—as illustrated for cluster UKP01389. (D) User interface to list clusters from a user-selected set of model organisms by the knownness of the cluster. The list indicates the best-known member of the cluster and the human member(s) of the cluster. (E) The 10 best known protein clusters, showing the best-known human gene in each. (F) Plot of the number of PubMed citations in the Uniprot comments section for human-gene containing clusters in the indicated range of knownness. The data underlying the plot can be found in S1 Data. GO, Genome Ontology.
Fig 2
Fig 2. Analysis of trends in knownness.
(A) Change in the distribution of knownness of the 7,515 clusters that contain at least 1 protein from humans. (B) Mean number of publications added each year since 2010 to the UniProt entry for the human protein in each of the 7,515 clusters that contain at least 1 human protein, ranked into deciles based on knownness at 2010. Where there was more than 1 human protein in the cluster, their publications were summed. The best-known clusters in 2010 received the most publications in subsequent years. (C) The 10 largest GO term enrichments for the 753 human proteins from clusters whose knownness has increased from 0 in 2010 to 2.0 or above by 2022. When there was more than 1 human protein in the cluster, a single one was used chosen by alphabetical order to avoid bias. GO enrichment analysis used ShinyGO [112]. (D) Venn diagram showing the distribution of genes from the indicated species in the 1,551 clusters of knownness <2.0 and which contain at least 1 human protein. Not shown are the 55 clusters that appear only in humans. The data underlying the graphs shown in the figure can be found in S1 Data. GO, Genome Ontology.
Fig 3
Fig 3. Testing of the unknome set of genes for roles in fertility and wing growth.
(A) Plot of brood sizes obtained from matings in which each gene was knocked down in either the male or female germline. Dotted lines indicate outlier boundaries, with the genes named being those whose position outside of the boundary is statistically significant, error bars show standard deviation, and the size of the circles is inversely proportional to the p-value. Controls: Vret is involved in piRNA biogenesis and affects female fertility [113], and Ref1 is an essential protein predicted to be involved in RNA export [114], and affects both males and females. (B) Summary of the significant hits from the test of male fertility, showing the human ortholog and the phenotype reported for patients with loss of function mutations (PCD, MMAF). (C) Adult wing illustrating the posterior domain that expresses engrailed during development and hence the engrailed-Gal4 driver used to express the hairpin RNAs. Also shown are the intervein areas measured to assess tissue growth in the anterior and posterior halves of the wing. (D) Plot of the mean area of the anterior and posterior intervein areas as in (C) for flies in which each gene was knocked down by RNAi in the posterior domain (pixel dimensions 2.5 μm × 2.5 μm). Errors are shown as tilted ellipses with the major/minor axes being the square roots of the eigenvectors of the covariance matrix. Dotted lines indicate the outlier boundary, with the genes named being those whose position outside of the boundary is statistically significant, with the size of the circles being inversely proportional to the p-value. The genes Hippo (growth repressor) and Chico (growth stimulator) were included as controls. (E) Representative wings from flies expressing hairpin RNA for the indicated genes in the posterior domain. Hippo and Chico are controls as in (D), with CG11103 and CG5885 showing an increase or decrease in the posterior domain, respectively. The means and variances used for the graphs shown in the figure can be found in S2 Data with the data points in S3 Data. MMAF, multiple morphological abnormalities of the sperm flagella; PCD, primary ciliary dyskinesia; RNAi, RNA interference.
Fig 4
Fig 4. Testing of the unknome set of genes for roles in quality control and responses to stress.
(A) Fluorescence micrographs of eyes from stocks expressing Httex1-Q46-eGFP along with either no RNAi, or one to the screen hit CG5885, both under the control of the GMR-GAL4 driver. The GFP fusion protein forms aggregates whose number and size increase over time. (B) Plot of the mean number of large (≥50 pixels) or small (<50 pixels) aggregates of Httex1-Q46-eGFP formed after 18 days in flies in which the unknome set of genes has been knocked-down by RNAi (pixel dimensions 0.5 μm × 0.5 μm). Errors are shown as tilted ellipses with the major/minor axes being the square roots of the eigenvectors of the covariance matrix. Dotted lines indicate an outlier boundary set at 90% of the variation in the dataset, with the genes named being those whose position outside of the boundary is statistically significant with a p-value <0.05, with the size of the circles being inversely proportional to the p-value. (C) Flywheel apparatus for time-lapse imaging of 96-well plates containing 1 fly per well. Each of 3 wheels holds 20 plates that rotate under a camera to be imaged once per hour. (D) Use of time-lapse imaging to assay viability: 96-well plates were imaged very hour and the movement between frames quantified for the fly in each well. Plots of movement size over time allow the time point for cessation of movement and hence loss of viability to be determined automatically. (E) Survival plots obtained from the flywheel for flies in 96-well plates with food containing the indicated concentration of oxidative stressor paraquat. Increased levels of the paraquat shorten survival times. Two independent 96-well plates are shown for each condition to illustrate the reproducibility of the assay. (F) Plot of the median survival time of fly lines in which the unknome set of genes has been knocked-down by RNAi and which were then exposed to paraquat to induce oxidative stress or were starved for amino acids. Dotted lines indicate an outlier boundary set at 80% of the variation in the dataset, with the genes named being those whose position outside of the boundary is statistically significant (p-value <0.05), with error bars showing standard deviation and the size of the circles inversely proportional to the p-value. The means and variances used for the graphs shown in (B) and (F) can be found in S2 Data with the individual data points in S3 Data. The data underlying the graph in (E) can be found in S1 Data. RNAi, RNA interference.
Fig 5
Fig 5. Testing the unknome set of genes for roles in locomotion.
(A) iFly tracking system for automatic quantitation of Drosophila locomotion (reproduced from Kohlhoff and colleagues [80]). Drosophila are knocked to the bottom of a glass vial and placed in an imaging chamber that allows viewing from 3 angles and their climbing tracked automatically. (B) Plot of the mean climbing speeds of fly lines in which the unknome set of genes has been knocked down by RNAi, and the speeds for each line were determined after 8 days or 22 days post eclosion. Loss of the Parkinson’s gene Pink1 affects climbing speed and it was included as a control [115]. Dotted lines indicate an outlier boundary set at 90% of the variation in the dataset, with the genes named being those whose position outside of the boundary is statistically significant with a p-value <0.1, with error bars showing standard deviation and the size of the circles inversely proportional to the p-value. The means and variances used for the plot shown in the figure can be found in S2 Data with the data points in S3 Data. RNAi, RNA interference.
Fig 6
Fig 6. Validation of RNAi male sterility phenotypes using CRISPR/Cas9 gene disruption.
(A, B) Schematics of the genomic locus of candidate genes, position of CRISPR target sites and mutant alleles analysed. (C, D) Assessment of male fertility of mutants (homozygous and over a deficiency). The graphs show mean values +/− SD of the number of progeny produced by mutant males. Three crosses with 5 wild-type virgins and 3 mutant males were analysed for each genotype. Wild-type males or males carrying in-frame mutations were used as controls. Where possible, alleles covering both alternative reading frames were analysed. (E–G) Widefield fluorescent micrographs of male reproductive systems of control and JS27/CG6153 mutants expressing Don Juan-GFP to label sperm. Mutants exhibit empty seminal vesicles, (E’-G’) show zoomed regions of seminal vesicles from E–G (yellow dashed squares). (H–J) Widefield phase micrographs of reproductive systems of control and mutant males. Sperm are produced in both (asterisks), suggesting that sperm are made in the mutant but does not survive. Note that some mutant sperm gets into the ejaculatory duct (J). AG, accessory gland; ED, ejaculatory duct; SV, seminal vesicle; T, testis. Scale bars, 200 μm (H, I), 100 μm (J). The data underlying the graphs shown in the figure can be found in S1 Data. RNAi, RNA interference.
Fig 7
Fig 7. Investigation of wing growth hit CG11103 using CRISPR/Cas9 gene disruption.
(A) Schematic of the genomic locus of candidate CG11103, position of the CRISPR target site and the mutant allele analysed. Flies carrying an in-frame mutation were used as control. (B) Gene tree for TM2 domain proteins in humans and Drosophila, with an archaeal TM2 protein as an outlier. Tree built using sequence of TM2 domains alone using T-Coffee. A fourth TM2 domain protein is present in Drosophila and humans (Wurst/DNAJC22) which has additional TMDs and a DNAJ domain and appears to play a role in clathrin-mediated endocytosis [116]. (C–E) Cuticle phenotypes of embryos laid by control females and mutant females (homozygous or over a deficiency). (F, G) Micrographs of embryos laid by control females and homozygous mutant females stained against the pan-neuronal marker Elav. Scale bars: 50 μm. (H) Schematic of the genomic locus of CG10795, position of CRISPR target sites and the alleles analysed. Flies without an indel were used as control (CG10795_4). (I, J) Cuticle phenotypes of embryos laid by control or mutant females. (K, L) Micrographs of embryos laid by control or mutant females stained for the pan-neuronal marker Elav. Scale bars: 50 μm.

References

    1. Adhikari S, Nice EC, Deutsch EW, Lane L, Omenn GS, Pennington SR, et al. A high-stringency blueprint of the human proteome. Nat Commun. 2020;11:5301. doi: 10.1038/s41467-020-19045-9 - DOI - PMC - PubMed
    1. Sinha S, Eisenhaber B, Jensen LJ, Kalbuaji B, Eisenhaber F. Darkness in the human gene and protein function space: widely modest or absent illumination by the life science literature and the trend for fewer protein function discoveries since 2000. Proteomics. 2018;18:e1800093. doi: 10.1002/pmic.201800093 - DOI - PMC - PubMed
    1. Wood V, Lock A, Harris MA, Rutherford K, Bähler J, Oliver SG. Hidden in plain sight: what remains to be discovered in the eukaryotic proteome? Open Biol. 2019;9:180241. doi: 10.1098/rsob.180241 - DOI - PMC - PubMed
    1. Edwards AM, Isserlin R, Bader GD, Frye SV, Willson TM, Yu FH. Too many roads not taken. Nature. 2011;470:163–165. doi: 10.1038/470163a - DOI - PubMed
    1. Peña-Castillo L, Hughes TR. Why are there still over 1000 uncharacterized yeast genes? Genetics. 2007;176:7–14. doi: 10.1534/genetics.107.074468 - DOI - PMC - PubMed

Publication types

LinkOut - more resources