. 2023 Aug 15;120(33):e2211019120.
doi: 10.1073/pnas.2211019120. Epub 2023 Aug 8.

Natural selection has driven the recurrent loss of an immunity gene that protects Drosophila against a major natural parasite

Affiliations

Natural selection has driven the recurrent loss of an immunity gene that protects Drosophila against a major natural parasite

Ramesh Arunkumar et al. Proc Natl Acad Sci U S A. .

Abstract

Polymorphisms in immunity genes can have large effects on susceptibility to infection. To understand the origins of this variation, we have investigated the genetic basis of resistance to the parasitoid wasp Leptopilina boulardi in Drosophila melanogaster. We found that increased expression of the gene lectin-24A after infection by parasitic wasps was associated with a faster cellular immune response and greatly increased rates of killing the parasite. lectin-24A encodes a protein that is strongly up-regulated in the fat body after infection and localizes to the surface of the parasite egg. In certain susceptible lines, a deletion upstream of the lectin-24A has largely abolished expression. Other mutations predicted to abolish the function of this gene have arisen recurrently in this gene, with multiple loss-of-expression alleles and premature stop codons segregating in natural populations. The frequency of these alleles varies greatly geographically, and in some southern African populations, natural selection has driven them near to fixation. We conclude that natural selection has favored the repeated loss of an important component of the immune system, suggesting that in some populations, a pleiotropic cost to lectin-24A expression outweighs the benefits of resistance.

Keywords: C-type lectin; Leptopilina boulardi; cis-regulatory polymorphism; loss of function; melanization.


Conflict of interest statement

The authors declare no competing interest.

Figures

Fig. 1.
Fig. 1.
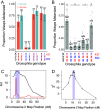
Genetic differences in the immune response to parasitoid infection. (A) The proportion of L. boulardi wasp embryos melanized in two inbred lines, DGRP-437 and DGRP-892. Each point is an independent replicate (six/line), bars are 95% CIs, and the number of larvae across all assays is above the bar. (B) Wasp embryo melanization at 18, 24, and 26 h after infection. (C and D) Larvae were injected with oil droplets containing homogenized L. boulardi (C, nDGRP-437 = 853, nDGRP-892 = 816) or A. tabida (D, nDGRP-437 = 128, nDGRP-892 = 128). Bars represent SEs.
Fig. 2.
Fig. 2.
A single locus on chromosome II is associated with resistance to parasitoid wasp infection. (A) The mean proportion of wasps melanized in the F1 progeny of crosses between two Drosophila lines. Bars are 95% CIs. (B) The mean proportion of wasps melanized in lines with different chromosome combinations. Bars are SEs, and points are replicates of 20 larvae. Letters show significantly different groups (Tukey’s test, P < 0.05 between groups). Numbers above bars in (A) and (B) indicate the number of larvae that were assayed. (C) QTL on chromosome II associated with the melanization rate measured by dissecting larvae. The black line is interval mapping and the red line composite interval mapping. The blue region is the CI on the QTL location (1.5 LOD drop). X axis ticks are marker locations. (D) Fine-scale QTL in the region containing the gene. Only informative recombinants were genotyped. The χ2 statistic represents the deviation from the expected Mendelian frequency (0.5) of each marker among 152 adults that contained a capsule and tested positive for parasitoid wasp DNA. The shaded region indicates the 95% CI (χ2 drop of 4.6).
Fig. 3.
Fig. 3.
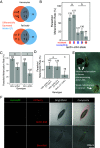
lectin-24A is required for parasitoid resistance. (A) Protein-coding genes within the QTL and differentially expressed after immune induction (log2 fold change > 2). The gene in the intersection of the fat body Venn diagram is lectin-24A. (B) Mean parasitoid melanization rate in lines with resistant, susceptible, and mutated (open inverted triangles, Δ129) lectin-24A. Error bars represent 95% CIs. Tukey’s test, P < 0.05 between groups. (C) Mean parasitoid melanization rates in larvae expressing Act-Cas9 and guide RNAs targeting lectin-24A compared to control larvae. Guide RNAs on either the X or the III chromosome were used, and 2Ar5 and 68A4 are the lines in which the construct was microinjected. Each of these lines was crossed to Act-Cas9; II437; III437, and the F1 heterozygotes were assayed. Error bars represent 95% CIs. A Fisher’s exact test was used to identify significant differences for each pair of comparisons. (D) Mean parasitoid melanization rates in larvae overexpressing lectin-24A under the C7-GAL4 driver in the larval fat body compared to control larvae. UAS-lectin-1 and UAS-lectin-2 are independent insertions of a construct expressing guide RNAs targeting lectin-24A, and 2Ar5 is the original line in which the construct is microinjected into. Error bars represent 95% CIs. Tukey’s test, P < 0.05 between groups. Numbers above bars in (BD) indicate the number of larvae that were assayed. (E) Representative image of partially melanized wasp larva and melanized wasp eggs in Drosophila larvae overexpressing lectin-24A and control larvae. (F) Confocal microscopy image of wasp eggs dissected 2 to 12 h post-infection. The presence of hemocytes (arrows) was checked with HmlΔ-GAL4 UAS-GFP and confirmed in the brightfield (BF) channel. lectin-24A-mCherry can be observed on the egg chorion in regions without hemocytes (top row). The same is not observed in secreted-mCherry alone (bottom row). The scale bar represents 100 μm.
Fig. 4.
Fig. 4.
Cis-regulatory polymorphisms in lectin-24A. (A) Expression of lectin-24A 6 and 18 h post-infection (hpi) with parasitoid wasp. (B) Allele-specific expression of lectin-24A in heterozygous flies. Read counts (depth) of the resistant (DGRP-437) and susceptible (DGRP-892) allele for complementary DNA (cDNA) and genomic DNA (gDNA). Asterisks indicate a Welch t test, P < 0.0001. (C) Expression of Venus driven by the sequence upstream of the susceptible (LP892) or resistant lectin-24A (LP437) imaged 24 hpi under brightfield (Left) or GFP filter (Right). (D) Reporter constructs with different combinations of variants upstream of lectin-24A in the susceptible (DGRP-892, blue) and resistant (DGRP-437, red) lines and expression of Venus. Each point represents a sample of 15 larvae. Letters are Tukey’s test, P < 0.05 between groups, P > 0.05 within groups. (E) Putative binding site of the NF-κB transcription factors in the lectin-24A promoter regions of DGRP-437 and DGRP-892.
Fig. 5.
Fig. 5.
The frequency of predicted loss-of-function alleles of lectin-24A in natural populations. (A) Twenty-four hours post-infection, lectin-24A complementary DNA (cDNA) and genomic DNA (gDNA) was sequenced in the F1 progeny of a cross between DGRP-437 and 20 different inbred DGRP lines. The lines are grouped by their indel haplotype, which is ordered as c.-439_-433del, c.-334_-333insACATTCAT, and the 21 bp indel (c.-171_-151del), and the deletion “D” or insertion “I” state for each indel is depicted. We estimated the frequency of reads from the test line as opposed to DGRP-437. We had two technical and two biological replicates per cross. Data for DGRP-892 are also presented in Fig. 3. (B) Melanization rates in adult flies from 145 DGRP lines where the three upstream lectin-24A indels were characterized. Lines are grouped by whether they have the upstream indel haplotypes capable of expressing lectin-24A at a high level. The 2 to 10 replicate measurements for melanization rates per DGRP line are shown as individual points. A total of 123 lines have the lectin-24A expressing haplotypes (DII, IDI, III), and 22 lines have the haplotypes that do not express lectin-24A (DDD, DDI). A Welch two-sample t test was used to identify significant differences between the line means of the two groups. (C) The frequency of variants that abolish expression (the 21 bp indel as known as c.-171_-151del) or introduce premature stop codons (other variants). Multiple refers to the co-occurrence of any two loss-of-function variants. Analysis used 672 genome sequences genotyped for >50% of the lectin-24A gene.
Fig. 6.
Fig. 6.
Evidence of local adaptation in lectin-24A. (A) Per site Weir and Cockerham FST (dm5; 2L:3715513–3719050) across 26 global fly populations. FST for the top 1% and 0.1% of 23,635 variants in short introns is indicated by dotted red lines. Red inverted triangles indicate loss-of-function variants. (B) FST for lectin-24A protein coding sequence from pairwise comparisons between seven geographic regions. (C) Population branch statistic (PBS) for 4,433 variants in short introns and three lectin-24A premature stop codons for the three largest geographic regions. The premature stop codons are indicated with arrows. The red dotted line is the 95th percentile. (D) PBS trees for the polymorphic stop codon p.Gln254* and a genome-wide tree based on 4,433 variants in short introns. Both trees are on the same scale.

Similar articles

Cited by

References

    1. Sabeti P. C., et al. , Genome-wide detection and characterization of positive selection in human populations. Nature 449, 913–918 (2007). - PMC - PubMed
    1. Howes R. E., et al. , The global distribution of the Duffy blood group. Nat. Commun. 2, 266 (2011). - PMC - PubMed
    1. Burgner D., Jamieson S. E., Blackwell J. M., Genetic susceptibility to infectious diseases: Big is beautiful, but will bigger be even better? The Lancet Infectious Dis. 6, 653–663 (2006). - PMC - PubMed
    1. Chapman S. J., Hill A. V., Human genetic susceptibility to infectious disease. Nat. Rev. Genet. 13, 175–188 (2012). - PubMed
    1. Salvaudon L., Giraud T., Shykoff J. A., Genetic diversity in natural populations: A fundamental component of plant-microbe interactions. Curr. Opin. Plant Biol. 11, 135–143 (2008). - PubMed

Publication types

LinkOut - more resources