. 2023 Aug 8;16(797):eade0385.
doi: 10.1126/scisignal.ade0385. Epub 2023 Aug 8.

TGF-β uncouples glycolysis and inflammation in macrophages and controls survival during sepsis

Affiliations

TGF-β uncouples glycolysis and inflammation in macrophages and controls survival during sepsis

Thierry Gauthier et al. Sci Signal. .

Abstract

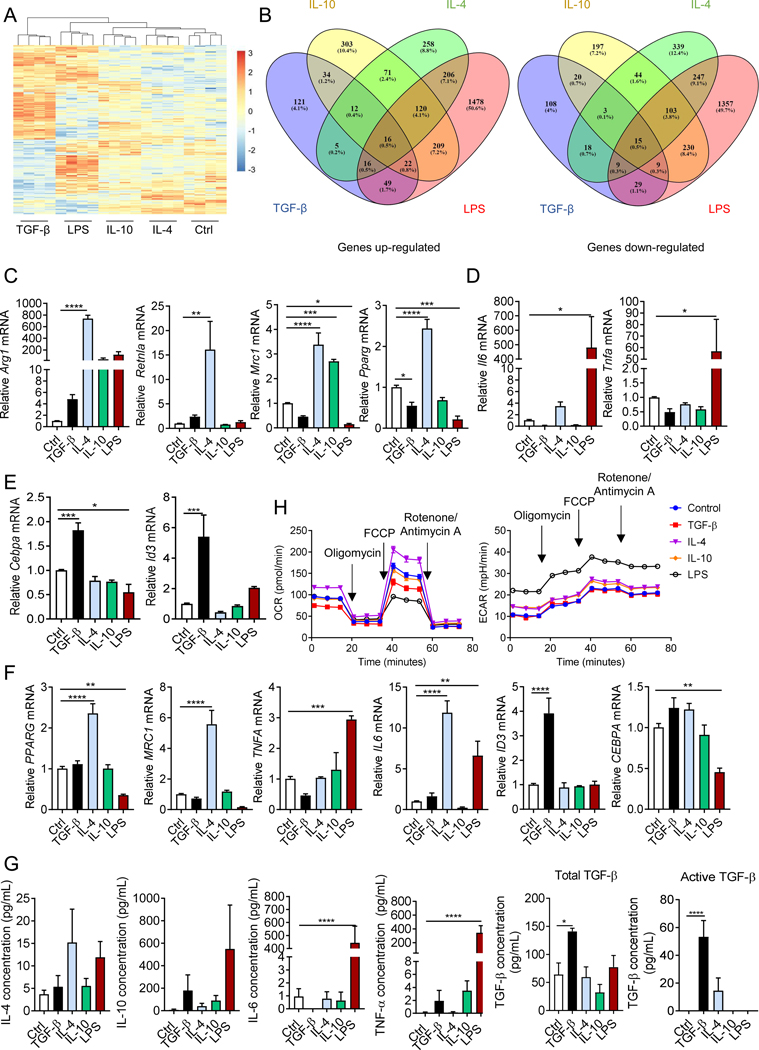
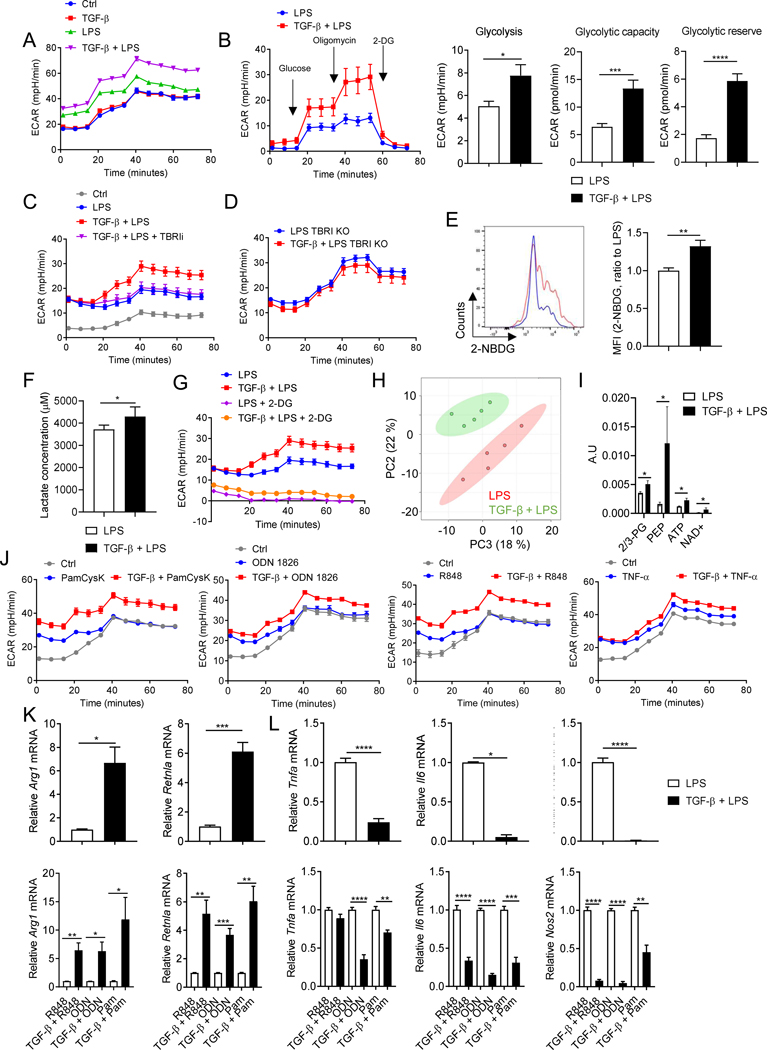
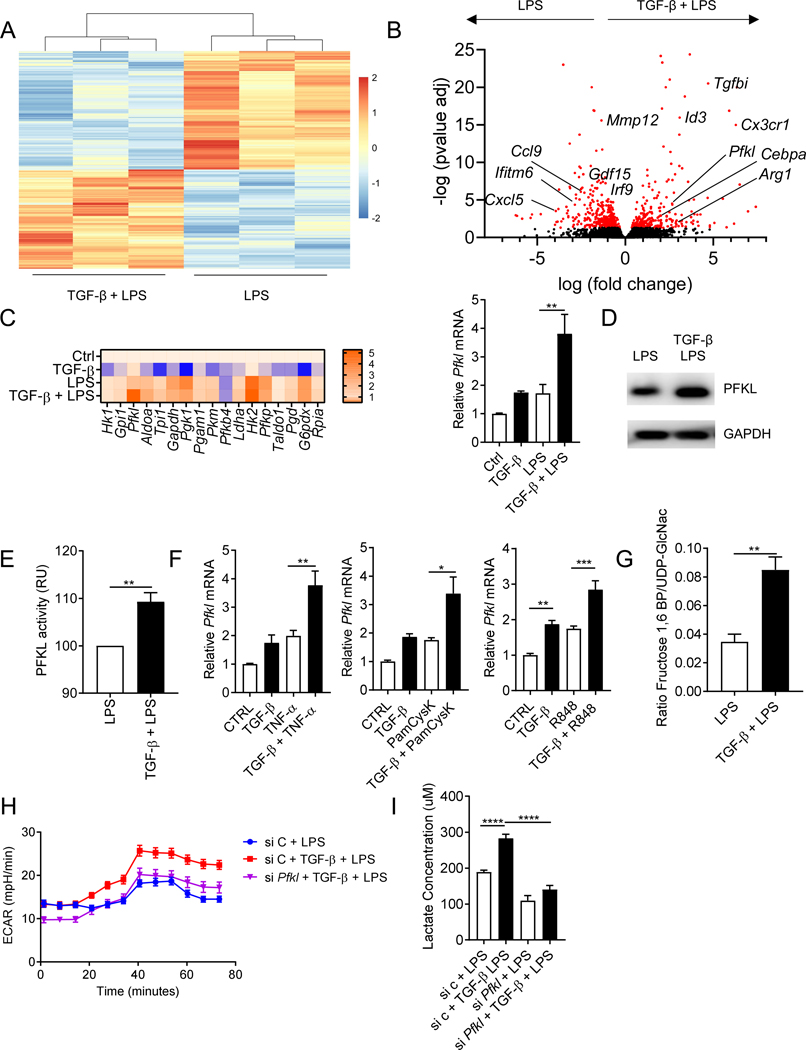
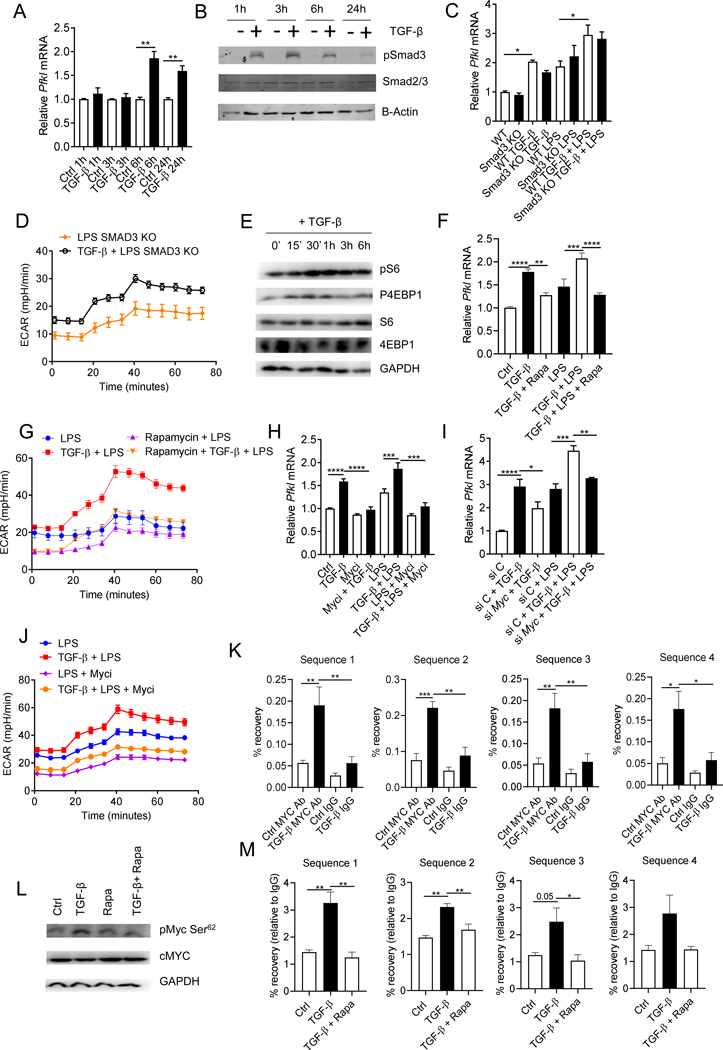
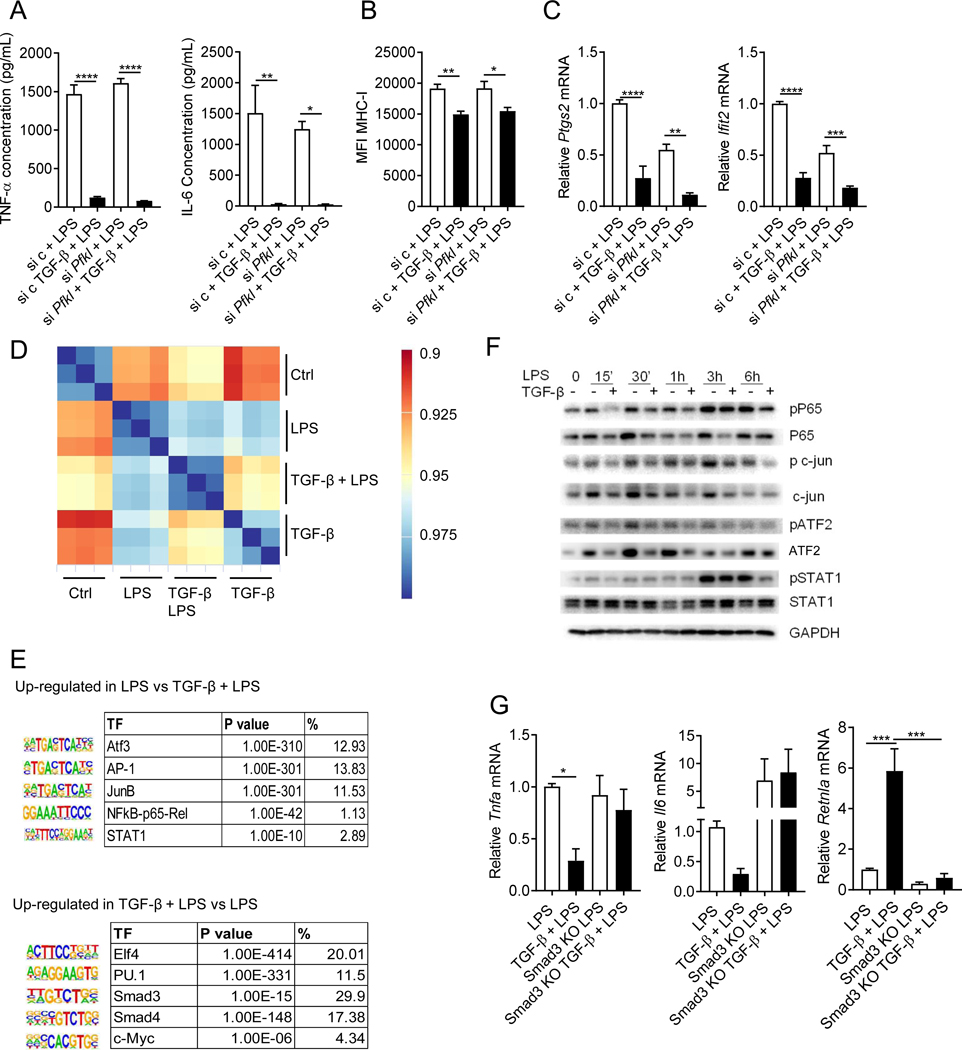
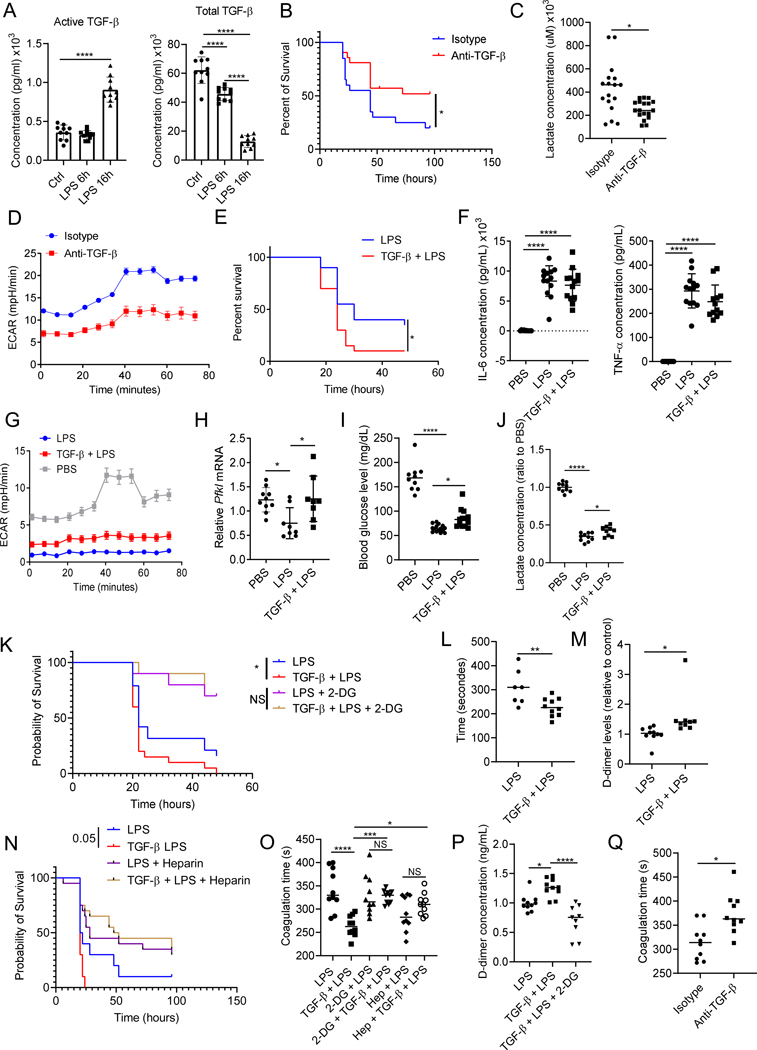
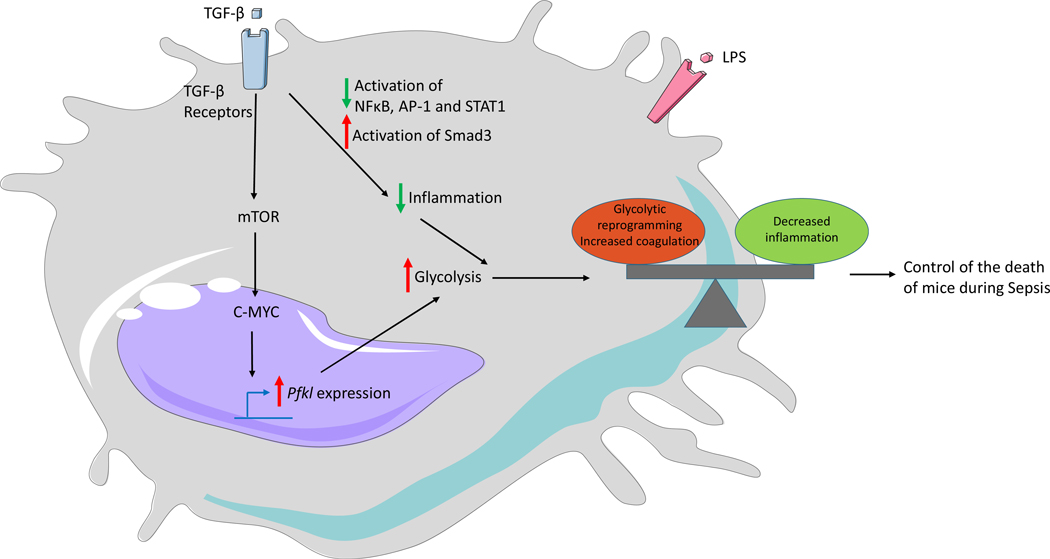
Changes in metabolism of macrophages are required to sustain macrophage activation in response to different stimuli. We showed that the cytokine TGF-β (transforming growth factor-β) regulates glycolysis in macrophages independently of inflammatory cytokine production and affects survival in mouse models of sepsis. During macrophage activation, TGF-β increased the expression and activity of the glycolytic enzyme PFKL (phosphofructokinase-1 liver type) and promoted glycolysis but suppressed the production of proinflammatory cytokines. The increase in glycolysis was mediated by an mTOR-c-MYC-dependent pathway, whereas the inhibition of cytokine production was due to activation of the transcriptional coactivator SMAD3 and suppression of the activity of the proinflammatory transcription factors AP-1, NF-κB, and STAT1. In mice with LPS-induced endotoxemia and experimentally induced sepsis, the TGF-β-induced enhancement in macrophage glycolysis led to decreased survival, which was associated with increased blood coagulation. Analysis of septic patient cohorts revealed that the expression of PFKL, TGFBRI (which encodes a TGF-β receptor), and F13A1 (which encodes a coagulation factor) in myeloid cells positively correlated with COVID-19 disease. Thus, these results suggest that TGF-β is a critical regulator of macrophage metabolism and could be a therapeutic target in patients with sepsis.


Conflict of interest statement

Competing Interests

The authors declare that they have no competing interests.

Figures

Figure 1.
Figure 1.. TGF-β induces a distinct population of macrophages.
(A) Heatmap representing significantly regulated genes (p<0.05) in macrophages treated with or without TGF-β, IL-4, IL-10 or LPS during 24 h. (B) Venn diagrams depicting up-regulated (left) and down-regulated (right) genes from the RNAseq analysis. (C to E) RT-qPCR analysis for IL-4/IL-10-induced genes (C), LPS-induced genes (D) or TGF-β-induced genes (E) in mouse macrophages treated for 24 h. (F) RT-qPCR analysis for the indicated genes in human macrophages treated for 24 h with TGF-β, IL-4, IL-10, or LPS or not treated. (G) ELISA quantification of different cytokines in macrophages treated for 24 h with TGF-β, IL-4, IL-10, or LPS or not treated. (H) Quantification of OCR (left) and ECAR (right) in macrophages treated for 24 h with or without TGF-β, IL-4, IL-10, or LPS. For (A) and (B), n=4 biological replicates per group. For (C) to (G), n≥3 biological replicates per group from at least 2 independent experiments. For (H), representative of n≥3 biological replicates per group from one experiment repeated twice with similar results (see Fig S12 for the data from the second experiment). * p<0.05, ** p<0.01, *** p<0.005, **** p<0.001 by Anova one-way.
Figure 2.
Figure 2.. TGF-β increases glycolysis but suppresses proinflammatory cytokines in activated macrophages.
(A) Quantification of ECAR (as assessed by the mitochondrial stress test) in macrophages treated for 24 h with or without TGF-β (5 ng/mL), then with LPS (10 ng/mL) for 24 h. (B) Quantificant of ECAR (assessed by the glycolysis stress test; left) and glycolysis, glycolytic capacity and glycolytic reserve (right) in macrophages treated for 24 h with or without TGF-β, then with LPS for 24 h (left). (C) Quantification of ECAR in macrophages treated for 24 h with or without TGF-β, then with LPS for 24 h, in the presence or absence of TBRI inhibitor (TBRIi). (D to F) Quantification of ECAR (D), uptake of the glucose analog 2-NBDG (E), and lactate production (F) in macrophages (BMDM) from TBRI KO mice treated for 24 h with or without TGF-β, then with LPS stimulation for 24 h. (G) Quantification of ECAR in macrophages treated for 24 h with or without TGF-β, then with LPS, in the presence or absence of 2-DG (1 mM). (H) Principal component analysis (PCA) of metabolomic changes (LC/MS) in macrophages treated for 24 h with or without TGF-β, then with LPS for 24 h. (I) Quantification of several glycolytic metabolites by LC/MS. A.U.= arbitrary units. (J) Quantification of ECAR in macrophages treated for 24 h with or without TGF-β, then with PamCysK, ODN1826, R848 or TNF-α for 24 h. (K and L) RT-qPCR analysis for the indicated genes in macrophages treated for 24 h with or without TGF-β, then with LPS, PamCysK, ODN1826 or R848 for 24 h. Data are presented as means ±SEM. For (B) (right), (E), (F), (K), and (L), n≥3 biological replicates per group from 2 independent experiments. For (H) and (I), data are from n=5 biological replicates per group. For (A), (B) (left), (C), (D), (G) and (J), the graphs are representative of n≥3 biological replicates per group from one experiment repeated twice with similar results (see Fig S12 for the data from the second experiment). * p<0.05, ** p<0.01, *** p<0.005, **** p<0.001 by Student’s T test. For Arg1 in (K) and Il6 in (L), data did not follow normal distribution and Wilcoxon rank sum test was used for analysis.
Figure 3.
Figure 3.. TGF-β increases glycolysis through PFKL.
(A) Heatmap representing significantly regulated genes (p<0.05) in macrophages treated for 24 h with or without TGF-β, then with LPS for 6 h. (B) Volcano plots depicting up-regulated (right) and down-regulated (left) genes obtained from the RNAseq analysis. (C) Heatmap representing RT-qPCR analysis of the expression of genes in the glycolytic and pentose phosphate pathways in macrophages treated for 24 h with or without TGF-β, then with LPS for 24 h. (D) Protein level of PFKL in macrophages treated for 24 h with or without TGF-β, then with LPS for 24 h. (E) PFKL activity in macrophages treated for 24 h with or without TGF-β, then with LPS for 24 h. (F) RT-qPCR analysis of Pfkl expression in macrophages treated or 24 h with or without TGF-β, then with TNF-α, PamCysK or R848 for 24 h. (G) Ratio of fructose 1,6 bisphosphate to UDP-GlcNac levels in macrophages treated for 24 h with or without TGF-β, then with LPS for 24 h. (H) Quantification of ECAR in macrophages treated for 24 h with or without TGF-β, then with LPS for 24 h, in the presence or absence of Pfkl siRNA. (I) Lactate levels in the supernatant of macrophages treated for 24 h with or without TGF-β, then with LPS for 24 h, in the presence or absence of Pfkl siRNA. Data are presented as means ±SEM. For (A) and (B), data are from 3 biological replicates per group. For (C) to (I), excluding (H) n≥3 biological samples per group from at least 2 independent experiments. For (G), data are from 5 biological replicates per group. For (H), the graph is representative of n≥3 biological replicates per group from one experiment repeated twice with similar results (see Fig S12 for the data from the second experiment). * p<0.05, ** p<0.01, *** p<0.005 **** p<0.001 by Anova one-way (C, G, I) or Student’s T test (E and F).
Figure 4.
Figure 4.. TGF-β increases Pfkl expression through a SMAD3-independent, mTOR-C-MYC dependent pathway.
(A) RT-qPCR analysis of Pfkl expression in macrophages treated for 1, 3, 6 and 24 h with TGF-β. (B) Western blot of phosphorylated SMAD3 (p-SMAD3), SMAD2/3 and β-Actin in macrophages treated for 1, 3, 6 and 24 h with TGF-β. (C) RT-qPCR analysis of Pfkl expression in macrophages from WT or SMAD3 KO mice treated for 24 h with or without TGF-β, then with LPS for 24 h. (D) Quantification of ECAR in macrophages from SMAD3 KO mice treated for 24 h with or without TGF-β, then with LPS for 24 h. (E) Abundance of the indicated proteins in macrophages treated for different times with TGF-β. (F) RT-qPCR analysis of Pfkl expression in macrophages treated for 24 h with or without TGF-β, then with LPS for 24 h, in the presence or absence of the mTOR inhibitor rapamycin (Rapa). (G) Quantification of ECAR in macrophages treated for 24 h with or without TGF-β, then with LPS for 24 h, in the presence or absence of rapamycin. (H) RT-qPCR analysis of Pfkl expression in macrophages treated for 24 h with or without TGF-β, then with LPS for 24 h, in the presence or absence of c-MYC inhibitor (Myci). (I) RT-qPCR analysis of Pfkl expression in macrophages treated for 24 h with or without TGF-β, then with LPS for 24 h. Cells were pre-treated with an siRNA directed against c-Myc (si Myc) or a non-targeting sequence (si C). (J) Quantification of ECAR in macrophages treated for 24 h with or without TGF-β, then with LPS for 24 h, in the presence or absence of C-MYC inhibitor (Myci). (K) ChIP-coupled real-time PCR analysis of c-MYC enrichment in the promoter region of Pfkl gene in macrophages treated for 24 h with or without TGF-β. Data are presented relative to input. (L) Abundance of the indicated proteins in macrophages pre-treated or not with rapamycin, then treated for 3 h with TGF-β. (M) ChIP-coupled real-time PCR analysis of c-MYC enrichment in the promoter region of Pfkl gene of macrophages pre-treated or not with rapamycin, then treated for 24 h with or without TGF-β. Data are presented relative to input and compared to control IgG. Data are presented as means ±SEM. For (A), (C), (F) (H), (I), (K), and (M), N≥3 biological replicates per group from at least 2 independent experiments. For (B), (E), and (L), the Western blots are representative of 3 independent experiments. For (D), (G) and (J), the graphs are representative of n≥3 biological replicates per group from one experiment repeated twice with similar results (see Fig S12 for the data from the second experiment). * p<0.05, ** p<0.01, *** p<0.005, **** p<0.001 by Anova one-way (C, F, H, I, K and M) or Student’s T test (A).
Figure 5.
Figure 5.. TGF-β suppresses inflammatory cytokines through Smad3 in activated macrophages.
(A to C) Macrophages were pre-treated with an siRNA directed against Pfkl (si Pfkl) or a non-targeting sequence (si C), then treated for 24 h with or without TGF-β and with LPS for 24 h. ELISA for TNF-α and IL-6 production (A). Flow cytometry analysis of MHC-I (B). RT-qPCR analysis of the expression of the indicated genes (C). (D) Unsupervised hierarchical clustering of the Pearson correlation values between the following groups: Ctrl, TGF-β, LPS, TGF-β LPS. (E) De novo motif search within ATAC-seq peaks associated with a corresponding cell type-specific gene. Consensus motif, transcription factor (TF), P value, and percentage of targets are shown. (F) Abundance of the indicated proteins in macrophages treated or not for 24 h with or without TGF-β, then with LPS for the indicated times. (G) RT-qPCR analysis of of Tnfa, Il6 and Retnla expression in macrophages from WT or SMAD3 KO mice treated for 24 h with or without TGF-β, then with LPS for 24 h. Data are means ±SEM. For (A) to (E) and (G), n≥3 biological replicates per group from at least 2 independent experiments. For (F), the Western blots are representative of 3 independent experiments. * p<0.05, ** p<0.01, *** p<0.005, **** p<0.001 by Anova one-way.
Figure 6.
Figure 6.. TGF-β mediated increase in macrophage glycolysis exacerbates sepsis in mice.
(A) Active and total levels of TGF-β in the serum of mice injected with LPS for 6 or 16 hours. (B) Survival of mice injected intraperitoneally (i.p) with anti-TGF-β antibody or isotype, then with LPS. (C) Blood lactate level in mice injected i.p with anti-TGF-β antibody or isotype, then with LPS for 16 h. (D) Quantification of ECAR in peritoneal macrophages harvested from mice treated with anti-TGF-β or isotype, then with LPS injection for 16 h. (E) Survival of mice injected i.p with or without TGF-β for 24 h, then with LPS. (F) TNF-α and IL-6 levels in serum from mice injected i.p with or without TGF-β for 24 h, then with LPS for 3 h. (G) Quantification of ECAR in peritoneal macrophages harvested from mice treated with TGF-β for 24 h, then with LPS for 24 h. (H) RT-qPCR analysis of Pfkl expression in peritoneal macrophages from mice treated with TGF-β for 24 h, then with LPS for 6 h. (I) Blood glucose levels in mice injected i.p with or without TGF-β for 24 h, then with LPS for 16 h. (J) Blood lactate levels in mice injected i.p with or without TGF-β for 24 h, then with LPS for 16 h. (K) Survival of mice injected i.p with or without TGF-β for 24 h, then with LPS for 24 h, in the presence or absence of 2-DG. (L) Coagulation time measured in the blood of mice injected i.p with or without TGF-β for 24 h, then with LPS for 16 h. (M) D-dimer levels (relative to control) measured in the blood of mice injected i.p with or without TGF-β for 24 h, then with LPS for 16 h. (N) Survival of mice injected i.p with or without TGF-β during 24 h, then with LPS in the presence or absence of heparin. (O) Coagulation time measured in the blood of mice injected i.p with or without TGF-β for 24 h, then with LPS for 16 h in the presence of 2-DG or heparin. (P) D-dimer levels (relative to LPS) measured from the blood of mice injected i.p with or without TGF-β for 24 h, then with LPS for 16 h in the presence of 2-DG. (Q) Coagulation time measured from mice injected i.p with anti-TGF-β antibody or isotype, then with LPS for 16 h. Data are presented as means ±SEM. For (A) to (C), (E), (F), and (H)_to (Q), n≥3 mice per group from at least 2 independent experiments. For (D) and (G), the graphs are representative of n≥3 mice replicates per group from one experiment repeated twice with similar results (see Fig S12 for the data from the second experiment). * p<0.05, ** p<0.01, *** p<0.005, **** p<0.001 by Anova one-way (A, F, H, I, J, O and P), Student’s T test (C, L, M and Q) or Log-rank (Mantel-Cox test, B, E, K and N).
Figure 7.
Figure 7.. TGF-β controls macrophage immunometabolism during inflammation.
In macrophages activated by pro-inflammatory stimuli, TGF-β increases the expression of Pfkl through a mTOR-MYC dependent pathway, which leads to an increase in glycolysis. TGF-β also uncouples glycolysis and inflammation by reducing inflammation in a SMAD3-dependent manner and by decreasing the activation of NF-κB, AP-1 and STAT1. The increased levels of glycolysis therefore drive dysregulation in coagulation in septic mice, resulting in decreased survival.

Similar articles

Cited by

References

    1. Lavin Y, Mortha A, Rahman A. & Merad M. Regulation of macrophage development and function in peripheral tissues. Nat Rev Immunol 15, 731–744 (2015). - PMC - PubMed
    1. DeNardo DG & Ruffell B. Macrophages as regulators of tumour immunity and immunotherapy. Nat Rev Immunol 19, 369–382 (2019). - PMC - PubMed
    1. Watanabe S, Alexander M, Misharin AV & Budinger GRS The role of macrophages in the resolution of inflammation. J Clin Invest 129, 2619–2628 (2019). - PMC - PubMed
    1. Bonnefoy F. et al. Factors Produced by Macrophages Eliminating Apoptotic Cells Demonstrate Pro-Resolutive Properties and Terminate Ongoing Inflammation. Front Immunol 9, 2586 (2018). - PMC - PubMed
    1. Colegio OR et al. Functional polarization of tumour-associated macrophages by tumour-derived lactic acid. Nature 513, 559–563 (2014). - PMC - PubMed

Publication types