Comment
. 2023 Aug 2;25(9):euad243.
doi: 10.1093/europace/euad243.

Leak current, even with gigaohm seals, can cause misinterpretation of stem cell-derived cardiomyocyte action potential recordings

Affiliations
Comment

Leak current, even with gigaohm seals, can cause misinterpretation of stem cell-derived cardiomyocyte action potential recordings

Alexander P Clark et al. Europace. .

Abstract

Aims: Human-induced pluripotent stem cell-derived cardiomyocytes (iPSC-CMs) have become an essential tool to study arrhythmia mechanisms. Much of the foundational work on these cells, as well as the computational models built from the resultant data, has overlooked the contribution of seal-leak current on the immature and heterogeneous phenotype that has come to define these cells. The aim of this study is to understand the effect of seal-leak current on recordings of action potential (AP) morphology.

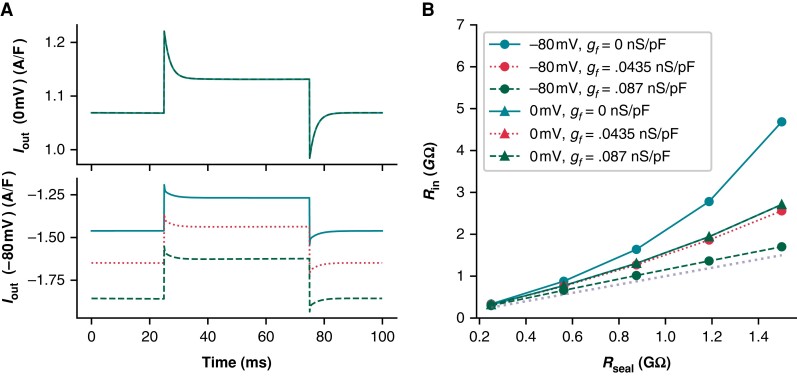
Methods and results: Action potentials were recorded in human iPSC-CMs using patch clamp and simulated using previously published mathematical models. Our in silico and in vitro studies demonstrate how seal-leak current depolarizes APs, substantially affecting their morphology, even with seal resistances (Rseal) above 1 GΩ. We show that compensation of this leak current is difficult due to challenges with obtaining accurate measures of Rseal during an experiment. Using simulation, we show that Rseal measures (i) change during an experiment, invalidating the use of pre-rupture values, and (ii) are polluted by the presence of transmembrane currents at every voltage. Finally, we posit that the background sodium current in baseline iPSC-CM models imitates the effects of seal-leak current and is increased to a level that masks the effects of seal-leak current on iPSC-CMs.

Conclusion: Based on these findings, we make recommendations to improve iPSC-CM AP data acquisition, interpretation, and model-building. Taking these recommendations into account will improve our understanding of iPSC-CM physiology and the descriptive ability of models built from such data.

Keywords: Arrhythmias; Computer simulation; Induced pluripotent stem cells; Ion channels; Patch clamp.


Conflict of interest statement

Conflict of interest: T.P.B. is an Editorial Consultant of EP Europace and was not involved in the peer review process or publication decision. All remaining authors have declared no conflicts of interest.

Figures

Graphical abstract
Graphical abstract
Figure 1
Figure 1
R seal cannot be measured directly once access is gained. Once access is gained, we can only measure the combined resistance Rin, which is equal to the parallel resistances of Rseal and Rm [Eq. (4)]. The presence of Rm introduces uncertainty when Rin is used to approximate Rseal, making it difficult to accurately correct for leak current effects. For simplicity, we have omitted other elements of this patch clamp diagram (e.g. series resistance and capacitance).
Figure 2
Figure 2
Effect of Rseal on Kernik and Paci APs. Simulations from the Kernik + leak (A) and Paci + leak (B) models, each with capacitance set to 50 pF (the experimental average), and Rseal set to values from 1 to 10 GΩ. The dashed (red) trace shows a baseline (leak-free) simulation. Four AP morphology metrics for the Kernik (C) and Paci (D) models are plotted against Rseal (displayed on log-scaled x-axis): MP, dV/dtmax, APD90, and CL. Grey boxes denote the Rseal values where the Kernik model is non-spontaneous. Abbreviations: APD90, action potential duration at 90% repolarization; CL, cycle length; dV/dtmax, maximum upstroke velocity.
Figure 3
Figure 3
Effect of Rseal on ToR-ORd adult cardiomyocyte APs at 50 and 153 pF. Simulations from the ToR-ORd + leak model paced at 1 Hz with Cm set to 50 (A) and 153 pF (B), and Rseal set to values from 1 to 10 GΩ. The dashed (red) trace shows a baseline (leak-free) simulation. Three AP morphology metrics for the 50 and 153 pF models are plotted against Rseal (displayed on log-scaled x-axis): APD90, action potential duration at 90% repolarization; dV/dtmax, maximum upstroke velocity; MP, minimum potential.
Figure 4
Figure 4
R in changes during iPSC-CM experiments. (A) Distribution of initial Rin measurements from iPSC-CMs acquired with a +5 mV step from 0 mV. (B) The percentage change in Rin plotted against the time elapsed between Rin measurements. The interval between measurements ranged from 1 to 10 min. Time was recorded to the nearest minute, leading to the appearance of banding in the ΔTime measure.
Figure 5
Figure 5
Ignoring the presence of If makes it impossible to accurately measure Rseal after gaining access. (A) Voltage clamp data acquired from an iPSC-CM before and after treatment with quinine, which is expected to block 32% of If at the concentration used. (B) Kernik model response at baseline and with 32% block of If. (C) Kernik + leak voltage clamp simulations conducted with Rseal = 1 GΩ, gK1 reduced by 90%, and gf set to 0 (solid line), 0.0435 (dotted line), or 0.087 nS/pF (dashed line). A voltage step from −80 to −75 mV was applied, as is commonly used to estimate Rin. This Rin value is sometimes used to approximate Rseal when the holding potential is near −80 mV. The amplifier-measured (Iout), total transmembrane (Iion), and leak currents (Ileak) are displayed. The Rin values calculated based on ΔIout are 2.03, 1.50, and 1.16 GΩ for the 0, 0.0435, and 0.087 nS/pF simulations, respectively. (D) Rin values are plotted against holding potential for Kernik + leak models with Rseal = 1 GΩ and gf equal to 0, 0.0435, or 0.087 nS/pF. The horizontal dotted line shows the true simulated Rseal value of 1 GΩ.
Figure 6
Figure 6
R in predictions of Rseal are overestimated at the reversal potential for leak current. (A) The current response (Iout) for Kernik + leak models with a 1 GΩ seal and gf of 0 (solid line), 0.0435 (dotted line), or 0.087 nS/pF (dashed line) to a 50 ms + 5 mV voltage clamp step from 0 mV (top) or −80 mV (bottom). (B) Effect of Rseal on Rin measures for models with gf set to 0 (solid), 0.0435 (dotted), or 0.087 nS/pF (dashed). Rin was calculated with Eq. (3). The +5 mV voltage steps were taken from either 0 or −80 mV. The Rseal = Rin line (dotted, without symbols) is provided as a reference for when Rin correctly predicts Rseal. The 0 mV lines are overlapping, illustrating that Rin is not sensitive to gf at this voltage. The gf = 0.0875 nS/pF model at −80 mV provides the best estimate of Rseal.
Figure 7
Figure 7
Cells appeared phenotypically heterogeneous, with uncorrelated variation in gin and Cm. (A) Current clamp recordings from three cells show phenotypic heterogeneity: non-spontaneous (green), spontaneous AP with short APD (teal), and spontaneous AP with long APD (red). (B) MP and APD90 for spontaneously beating cells (n = 25). Note the broken x-axis that allows us to display an outlying data point. (C) The relationship between Cm and gin for all cells (n = 37). Non-spontaneous cell data points are denoted with squares, whilst spontaneous are circles. APD90, action potential duration at 90% repolarization; MP, minimum potential.
Figure 8
Figure 8
Relationship between gin/Cm and AP biomarkers. (A) gin/Cm plotted against MP. Spontaneously firing cells are denoted as teal circles and non-firing cells as red squares. Linear regression fits to data from spontaneous (teal dashed, R = 0.47, P < 0.05), and non-firing (red dotted, R = 0.76, P < 0.05) cells are overlaid on the plot. No statistically significant relationship was found between gin/Cm and APD90 (B), CL (C), or dV/dtmax (D). APD90, action potential duration at 90% repolarization; CL, cycle length; dV/dtmax, maximum upstroke velocity; MP, minimum potential.
Figure 9
Figure 9
A simulated example of how leak can be absorbed into background currents: Kernik baseline model fit to Kernik + leak model. The IbNa and IbCa conductances (gbNa and gbCa) of the baseline Kernik model were fit to a Kernik + leak model (i.e. original + leak) with Rseal set to 5 GΩ using a genetic algorithm. (A) The conductances for all individuals (teal circles) and the best fit individual (red square) from the last generation. (B) Traces from the original baseline Kernik + leak model with a 5 GΩ seal (teal solid), the best fit model from the last generation (red dashed), and the original baseline Kernik model (green dotted).

Comment in

Comment on

References

    1. Terrenoire C, Wang K, Chan Tung KW, Chung WK, Pass RH, Lu JTet al. . Induced pluripotent stem cells used to reveal drug actions in a long QT syndrome family with complex genetics. J Gen Physiol 2013;141:61–72. - PMC - PubMed
    1. Han L, Li Y, Tchao J, Kaplan AD, Lin B, Li Yet al. . Study familial hypertrophic cardiomyopathy using patient-specific induced pluripotent stem cells. Cardiovasc Res 2014;104:258–69. - PMC - PubMed
    1. Mathur A, Loskill P, Shao K, Huebsch N, Hong SG, Marcus SGet al. . Human iPSC-based cardiac microphysiological system for drug screening applications. Sci Rep 2015;5:1–7. - PMC - PubMed
    1. Blinova K, Schocken D, Patel D, Daluwatte C, Vicente J, Wu JCet al. . Clinical trial in a dish: personalized stem cell–derived cardiomyocyte assay compared with clinical trial results for two QT-prolonging drugs. Clin Transl Sci 2019;12:687–97. - PMC - PubMed
    1. Jæger KH, Wall S, Tveito A. Computational prediction of drug response in short QT syndrome type 1 based on measurements of compound effect in stem cell-derived cardiomyocytes. PLoS Comput Biol 2021;17:e1008089. - PMC - PubMed