. 2023 Nov;33(6):e13192.
doi: 10.1111/bpa.13192. Epub 2023 Aug 8.

Peripheral macrophages drive CNS disease in the Ndufs4(-/-) model of Leigh syndrome

Affiliations

Peripheral macrophages drive CNS disease in the Ndufs4(-/-) model of Leigh syndrome

Allison R Hanaford et al. Brain Pathol. 2023 Nov.

Abstract

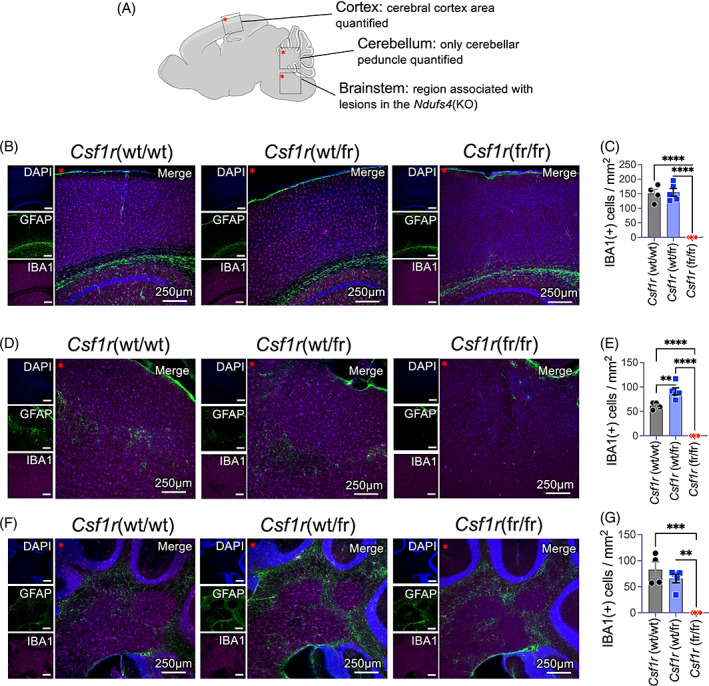
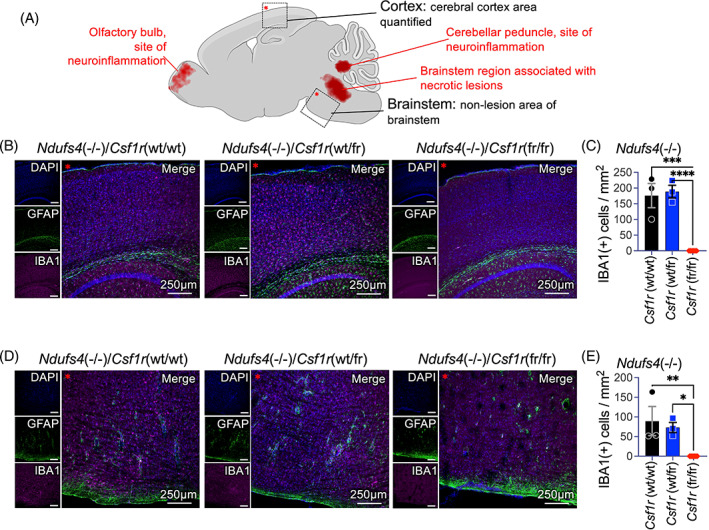
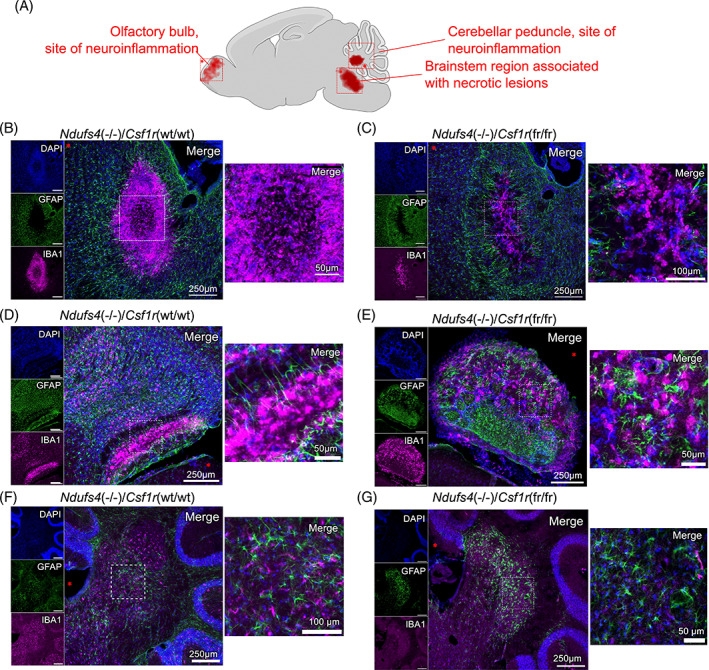
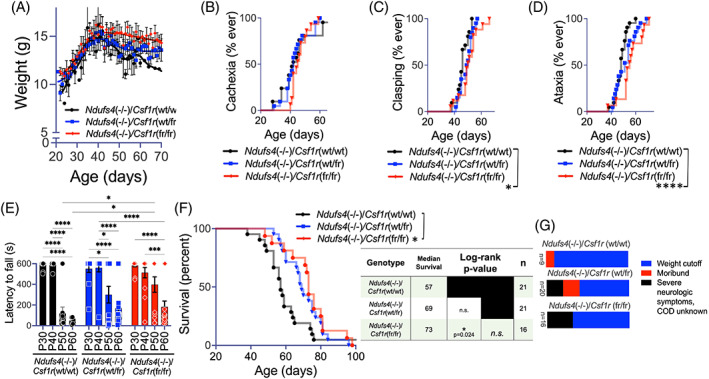
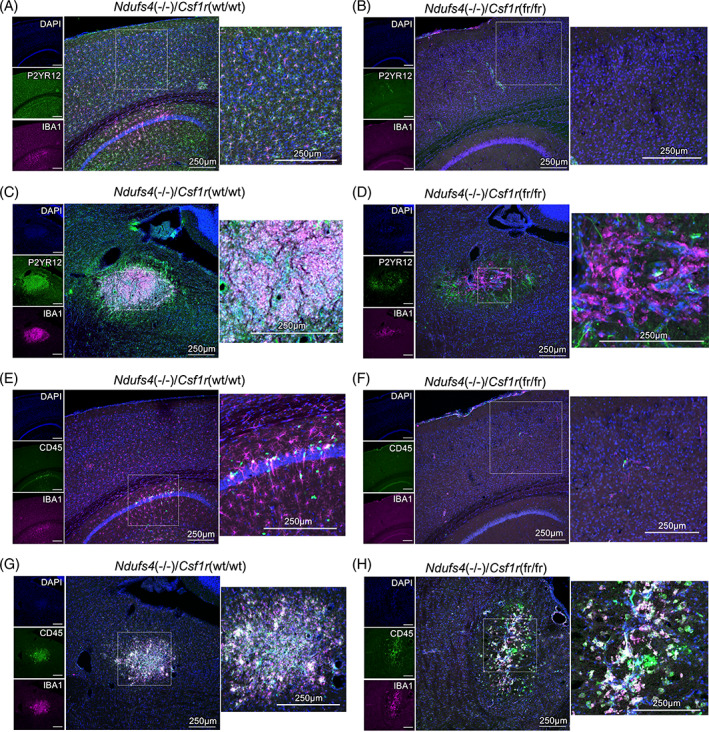
Subacute necrotizing encephalopathy, or Leigh syndrome (LS), is the most common pediatric presentation of genetic mitochondrial disease. LS is a multi-system disorder with severe neurologic, metabolic, and musculoskeletal symptoms. The presence of progressive, symmetric, and necrotizing lesions in the brainstem are a defining feature of the disease, and the major cause of morbidity and mortality, but the mechanisms underlying their pathogenesis have been elusive. Recently, we demonstrated that high-dose pexidartinib, a CSF1R inhibitor, prevents LS CNS lesions and systemic disease in the Ndufs4(-/-) mouse model of LS. While the dose-response in this study implicated peripheral immune cells, the immune populations involved have not yet been elucidated. Here, we used a targeted genetic tool, deletion of the colony-stimulating Factor 1 receptor (CSF1R) macrophage super-enhancer FIRE (Csf1rΔFIRE), to specifically deplete microglia and define the role of microglia in the pathogenesis of LS. Homozygosity for the Csf1rΔFIRE allele ablates microglia in both control and Ndufs4(-/-) animals, but onset of CNS lesions and sequalae in the Ndufs4(-/-), including mortality, are only marginally impacted by microglia depletion. The overall development of necrotizing CNS lesions is not altered, though microglia remain absent. Finally, histologic analysis of brainstem lesions provides direct evidence of a causal role for peripheral macrophages in the characteristic CNS lesions. These data demonstrate that peripheral macrophages play a key role in the pathogenesis of disease in the Ndufs4(-/-) model.

Keywords: CNS lesions; Leigh syndrome; microglia; mitochondrial disease; pediatric disease; subacute necrotizing encephalomyelopathy.


Conflict of interest statement

The authors declare no conflicts of interest.

Figures

FIGURE 1
FIGURE 1
Depletion of microglia in Csf1r(fr/fr)mice. (A) Diagram of brain regions imaged and analyzed. In cortex, microglia numbers were only quantified in the cerebral cortex area. In cerebellum, microglia were quantified in the peduncle. In the brainstem, microglia were quantified within the brainstem region where CNS lesions develop in the Ndufs4(−/−) model, adjacent to the fourth ventricle and inferior to the cerebellum. Only Ndufs4 controls are assessed in this figure (see Section 4 for genotype details, Figures 3 and 4). For all immunofluorescence panels, location of red asterisks in diagram (A) and in merged immunofluorescence images show relative orientation. (B) Representative images of cortex from Csf1r(wt/wt), Csf1r(wt/fr), and Csf1r(fr/fr), Ndufs4(control), mice. (C) Quantification of microglia numbers within the cerebral cortex. ****p < 0.0001 by one‐way ANOVA. (D) Representative images of the LS CNS lesion associated region of the brainstem in Csf1r(wt/wt), Csf1r(wt/fr), and Csf1r(fr/fr), Ndufs4(control), mice. (E) Quantification of microglia numbers within the lesion‐associated brainstem region. ****p < 0.0001 by one‐way ANOVA. (F) Representative images of the cerebellar peduncle in Csf1r(wt/wt), Csf1r(wt/fr), and Csf1r(fr/fr), Ndufs4(control), mice. (G) Quantification of microglia numbers within the cerebellar peduncle. ***p = 0.003 by one‐way ANOVA. (C,E,G) Error bars are standard error of the mean. Tukey's multiple comparisons corrected p‐values for pairwise comparisons. **p < 0.005, ***p < 0.0005, ****p < 0.00005. n = 4 biological replicates per group per brain regions (see Section 4). (B–G) tissues collected from animals aged P60–65. See Figures [Link], [Link] for enlargements of panels in Figure 1.
FIGURE 2
FIGURE 2
Depletion of microglia in Ndufs4(−/−)/Csf1r(fr/fr)mice. (A) Diagram of brain regions associated with neuroinflammatory lesions in the Ndufs4(−/−) model (red highlighted), and the cortex and brainstem regions imaged and analyzed in this figure. For all immunofluorescence panels, location of red asterisks in diagram (A) and in merged immunofluorescence images show relative orientation. (B) Representative images of cortex from Ndufs4(−/−)/Csf1r(wt/wt), Ndufs4(−/−)/Csf1r(wt/fr), and Ndufs4(−/−)/Csf1r(fr/fr) mice. (C) Quantification of microglia numbers within the cerebral cortex. ****p < 0.0001 by one‐way ANOVA. (D) Representative images of ventral brainstem region adjacent to areas of lesion formation in Ndufs4(−/−)/Csf1r(wt/wt), Ndufs4(−/−)/Csf1r(wt/fr), and Ndufs4(−/−)/Csf1r(fr/fr) mice. (E) Quantification of microglia numbers within the lesion‐associated brainstem region. ****p < 0.0001 by one‐way ANOVA. (C,E) Error bars are standard error of the mean. Tukey's multiple comparisons corrected p‐values for pairwise comparisons. **p < 0.005, ***p < 0.0005, ****p < 0.00005. n = 2–3 biological replicates per group per brain regions (see Section 4). Tissues collected from animals aged P55–66. See Figures [Link], [Link] for enlargements of panels in Figure 2.
FIGURE 3
FIGURE 3
CNS lesions in Ndufs4(−/−)/Csf1r(wt/wt) and Ndufs4(−/−)/Csf1r(fr/fr) mice. (A) Diagram of brain regions associated with neuroinflammatory lesions in the Ndufs4(−/−) model and the regions shown in this figure. For all immunofluorescence panels, location of red asterisks in diagram (A) and in merged immunofluorescence images show relative orientation. (B,C) Brainstem CNS lesions in Ndufs4(−/−)/Csf1r(wt/wt) (B) and Ndufs4(−/−)/Csf1r(fr/fr) (C) mice. (D,E) Olfactory bulb CNS neuroinflammation in Ndufs4(−/−)/Csf1r(wt/wt) (D) and Ndufs4(−/−)/Csf1r(fr/fr) (E) mice. (F–G) Cerebellar peduncle in Ndufs4(−/−)/Csf1r(wt/wt) (F) and Ndufs4(−/−)/Csf1r(fr/fr) (G) mice. IBA1(+) cells remain absent in this LS neuroinflammation associated region in Ndufs4(−/−)/Csf1r(fr/fr) mice. (B–G) All images are representative from staining of at least three biological replicates. Tissues collected from animals aged P55–66. See Figures [Link], [Link] for enlargements of panels in Figure 3.
FIGURE 4
FIGURE 4
Genetic depletion of microglia provides limited benefits in the Ndufs4(−/−) model of LS. (A) Average weights of Ndufs4(−/−)/Csf1r(wt/wt), Ndufs4(−/−)/Csf1r(wt/fr), and Ndufs4(−/−)/Csf1r(fr/fr) mice. Disease onset, including onset of weight loss, occurs around the age of P37 in the Ndufs4(−/−) model of LS. Data shown are population averages with standard error of the mean (SEM) and Locally Weighted Scatterplot Smoothing (LOWESS) curves to reveal overall trends. (B) Onset of cachexia, defined as the date when progressive weight loss began, in Ndufs4(−/−)/Csf1r(wt/wt), Ndufs4(−/−)/Csf1r(wt/fr), and Ndufs4(−/−)/Csf1r(fr/fr) mice. (C) Onset of forelimb clasping in Ndufs4(−/−)/Csf1r(wt/wt), Ndufs4(−/−)/Csf1r(wt/fr), and Ndufs4(−/−)/Csf1r(fr/fr) mice. *p < 0.05 by log‐rank test. (D) Onset of ataxia in Ndufs4(−/−)/Csf1r(wt/wt), Ndufs4(−/−)/Csf1r(wt/fr), and Ndufs4(−/−)/Csf1r(fr/fr) mice. **p < 0.005 by log‐rank test. (E) Rotarod performance, as assesed by latency to fall (see Section 4), in Ndufs4(−/−)/Csf1r(wt/wt), Ndufs4(−/−)/Csf1r(wt/fr), and Ndufs4(−/−)/Csf1r(fr/fr) mice as a function of age. Two‐way ANOVA row factor (age) ****p < 0.0001, column factor (genotype) *p < 0.05. *p < 0.05, **p < 0.005, ****p < 0.00005 by Tukey's multiple comparisons corrected t‐test, all rows and columns compared. (F) Survival of Ndufs4(−/−)/Csf1r(wt/wt), Ndufs4(−/−)/Csf1r(wt/fr), and Ndufs4(−/−)/Csf1r(fr/fr) mice. Median survival and statistical significance, by log‐rank test, as shown. (G) Cause of death in Ndufs4(−/−)/Csf1r(wt/wt), Ndufs4(−/−)/Csf1r(wt/fr), and Ndufs4(−/−)/Csf1r(fr/fr) animals. See Figure S22 for respiratory function data.
FIGURE 5
FIGURE 5
Peripheral macrophages in the CNS lesions characteristic of Leigh syndrome. For all panels, orientation is as in Figures 1, 2, 3 for the same brain regions. (A,B) Cortex of Ndufs4(−/−)/Csf1r(wt/wt) (A) and Ndufs4(−/−)/Csf1r(fr/fr) (B) mice stained for the pan‐macrophage marker IBA1 (red) and the microglia‐specific marker P2YR12 (green); DNA is co‐stained with DAPI (blue). Microglia are absent by both IBA1 and P2YR12 staining in the Ndufs4(−/−)/Csf1r(fr/fr) cortex. (C,D) Brainstem lesions from Ndufs4(−/−)/Csf1r(wt/wt) (C) and Ndufs4(−/−)/Csf1r(fr/fr) (D) mice stained for the pan‐macrophage marker IBA1 and the microglia‐specific marker P2YR12. Cells positive for IBA1, the pan‐macrophage marker, are present in both genotypes, while P2YR12 staining is absent in cells in the brainstem lesions of Ndufs4(−/−)/Csf1r(fr/fr) animals. The P2YR12 staining surrounding the lesion site does not appear to be cellular in origin, and is thought to reflect the presence of aggregated platelets, which are P2YR12 positive. (E,F) Cortex of Ndufs4(−/−)/Csf1r(wt/wt) (E) and Ndufs4(−/−)/Csf1r(fr/fr) (F) mice stained for the pan‐macrophage marker IBA1 (red) and the peripheral leukocyte marker CD45 (green); DNA is co‐stained with DAPI (blue). Microglia are absent in the Ndufs4(−/−)/Csf1r(fr/fr) cortex, and microglia (by IBA1 positivity and morphology) do not express CD45 (E). A few compact cells with CD45 positivity are present in both genotypes, presumed to be circulating leukocytes. (G,H) Brainstem lesions in Ndufs4(−/−)/Csf1r(wt/wt) (G) and Ndufs4(−/−)/Csf1r(fr/fr) (H) mice stained for the pan‐macrophage marker IBA1 and the peripheral leukocyte marker CD45. CD45 positive cells are present in both in the Ndufs4(−/−)/Csf1r(fr/fr) and Ndufs4(−/−)/Csf1r(wt/wt) lesions, while most or all IBA1 positive cells in the Ndufs4(−/−)/Csf1r(fr/fr) lesion appear to be positive for the peripheral leukocyte marker CD45. Co‐staining of CD45 and IBA1 is indicative of peripheral macrophages. Tissues collected from animals aged P55–66 in Ndufs4(−/−)/Csf1r(wt/wt), and P75‐80 in Ndufs4(−/−)/Csf1r(fr/fr). Specific ages of tissue collection were determined by according to euthanasia criteria (i.e., animals were synchronized by relative disease stage), see Section 4. See Figures [Link], [Link] for enlargements of panels in Figure 1.

Similar articles

Cited by

References

    1. Lake NJ, Bird MJ, Isohanni P, Paetau A. Leigh syndrome: neuropathology and pathogenesis. J Neuropathol Exp Neurol. 2015;74:482–492. 10.1097/NEN.0000000000000195 - DOI - PubMed
    1. Lake NJ, Compton AG, Rahman S, Thorburn DR. Leigh syndrome: one disorder, more than 75 monogenic causes. Ann Neurol. 2016;79:190–203. 10.1002/ana.24551 - DOI - PubMed
    1. Hong CM, Na JH, Park S, Lee YM. Clinical characteristics of early‐onset and late‐onset Leigh syndrome. Front Neurol. 2020;11:267. 10.3389/fneur.2020.00267 - DOI - PMC - PubMed
    1. Kruse SE, Watt WC, Marcinek DJ, Kapur RP, Schenkman KA, Palmiter RD. Mice with mitochondrial complex I deficiency develop a fatal encephalomyopathy. Cell Metab. 2008;7:312–320. 10.1016/j.cmet.2008.02.004 - DOI - PMC - PubMed
    1. van de Wal MAE, Adjobo‐Hermans MJW, Keijer J, Schirris TJJ, Homberg JR, Wieckowski MR, et al. Ndufs4 knockout mouse models of Leigh syndrome: pathophysiology and intervention. Brain. 2022;145:45–63. 10.1093/brain/awab426 - DOI - PMC - PubMed

Publication types

Substances