. 2023 Aug 15;4(8):101147.
doi: 10.1016/j.xcrm.2023.101147. Epub 2023 Aug 7.

High-dimensional profiling of pediatric immune responses to solid organ transplantation

Affiliations

High-dimensional profiling of pediatric immune responses to solid organ transplantation

Mahil Rao et al. Cell Rep Med. .

Abstract

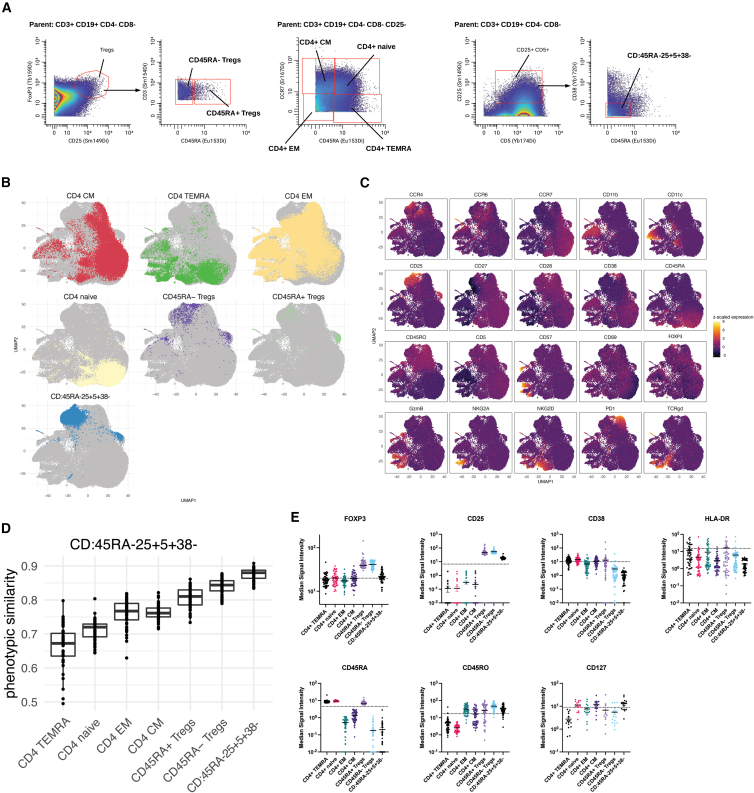
Solid organ transplant remains a life-saving therapy for children with end-stage heart, lung, liver, or kidney disease; however, ∼33% of allograft recipients experience acute rejection within the first year after transplant. Our ability to detect early rejection is hampered by an incomplete understanding of the immune changes associated with allograft health, particularly in the pediatric population. We performed detailed, multilineage, single-cell analysis of the peripheral blood immune composition in pediatric solid organ transplant recipients, with high-dimensional mass cytometry. Supervised and unsupervised analysis methods to study cell-type proportions indicate that the allograft type strongly influences the post-transplant immune profile. Further, when organ-specific differences are considered, graft health is associated with changes in the proportion of distinct T cell subpopulations. Together, these data form the basis for mechanistic studies into the pathobiology of rejection and allow for the development of new immunosuppressive agents with greater specificity.

Trial registration: ClinicalTrials.gov NCT02182986.

Keywords: CyTOF; allograft; pediatric; rejection; transplantation.


Conflict of interest statement

Declaration of interests The authors declare no competing interests.

Figures

None
Graphical abstract
Figure 1
Figure 1
Experimental approach and sample processing workflow (A) Patient samples were obtained from a biobank constructed as a part of the Clinical Trials in Organ Transplantation-06 (CTOTC-06) study. Patients were classified as “stable” if they had no evidence of rejection for 12 months before and 12 months after sample collection; patients were classified as “rejection” if they developed biopsy-proven rejection 30 days or less after sample collection. (B) PBMCs from donors were thawed, “barcoded” with palladium isotopes, stained with a combination of intracellular and extracellular markers, and analyzed on a mass cytometer. Normalized and debarcoded mass cytometer data were analyzed as described in STAR Methods. (C) For each patient sample, live singlets were identified based on DNA content, event length, and live/dead staining. Twenty-nine subpopulations were identified using previously published combinations of surface and intracellular markers. (D) The events in the terminally differentiated branches of the tree outlined in (C) from all clinical samples were pooled and used to construct a single-cell UMAP (clustering markers CCR7, CD8, CD45RA, CD25, CD3, CD5, CD4, FOXP3, CD56, CD38, GzmB, CD16, CD19, CD20, CD14, TCRγδ, CD11c, CD25, LAG3) to show the phenotypic relationship between the terminally differentiated populations. Cells are colored by their manually gated population. (E) Hierarchically clustered heatmap visualizes the relationships between populations and correlations between marker expression. The median expression of each marker used for gating was then assessed for each of the populations identified in (C).
Figure 2
Figure 2
The post-transplant immune profile depends on the allograft type (A) Biaxial plot of PC1 and PC2, colored by graft health. (B) Biaxial plot of PC1 vs. PC2 and PC1 vs. PC3, colored by graft. (C) Proportions by lineage for each cell type across the different grafts. Error bars indicate standard deviation. (D) Hierarchically clustered heatmap of mean cell-type proportions for each graft. (E) Volcano plot summarizing results of differential proportions analysis between pairs of different grafts (excluding intestine). Cell-type proportions compared using Wilcoxon signed-rank test, corrected for multiple hypotheses with an adjusted p value cutoff at 0.1. (F) Biaxial plot of LD1 and LD2 from LDA of immune cell-type proportions by graft. Lines indicate cell-type importance for the top contributing immune cell types separating grafts along LD1 and LD2. (G) Cell-type importance results from LDA in (F) for LD1, LD2, and LD3.
Figure 3
Figure 3
Rejection is associated with changes in proportions of distinct lymphocyte subpopulations (A) Biaxial plot showing results of linear mixed modeling analysis to calculate the fraction of variance explained by graft and graft health. Color indicates cell-type lineage. (B) Hierarchically clustered heatmap of mean cell-type proportions across each clinical subset of graft and graft health. Boxes highlight key populations from (A). (C) Confidence intervals for statistically comparing cell-type populations that vary with graft health using generalized linear models: p ≤ 0.05. (D) Selected cell-type results from a lasso-regularized logistic regression model.
Figure 4
Figure 4
CD:45RA25+5+38 cells have phenotypic similarities to regulatory T cells (A) Gating strategy used to define key subpopulations of CD4+ T cells. (B) The events in the seven CD4+ T cell subpopulations outlined in (A) from all clinical samples were pooled and used to construct a single-cell faceted UMAP using markers known to be expressed on CD4+ T cells (CCR4, CCR6. CCR7, CD11b, CD11c, CD25, CD27, CD28, CD38, CD45RA, CD45RO, CD5, CD57, CD69, FOXP3, GzmB, NKG2A, NKG2D, PD1, and TCRγδ) to show the phenotypic relationship between these CD4+ subpopulations. (C) A faceted UMAP using the same events in (B) shows the expression levels of various T cell markers. (D) Cosine similarity analysis of CD4+ subpopulations identified in (A). (E) The median signal intensity of selected markers for each of the CD4+ subpopulations identified in (A).

References

    1. Alessiani M., Kusne S., Martin F.M., Fung J.J., Jain A., Todo S., Simmons R., Starzl T.E. Infections with FK 506 immunosuppression: preliminary results with primary therapy. Transplant. Proc. 1990;22:44–46. - PMC - PubMed
    1. Williams D., Haragsim L. Calcineurin nephrotoxicity. Adv. Chronic Kidney Dis. 2006;13:47–55. doi: 10.1053/j.ackd.2005.11.001. - DOI - PubMed
    1. Absalon M.J., Khoury R.A., Phillips C.L. Post-transplant lymphoproliferative disorder after solid-organ transplant in children. Semin. Pediatr. Surg. 2017;26:257–266. doi: 10.1053/j.sempedsurg.2017.07.002. - DOI - PubMed
    1. Colvin M., Smith J.M., Ahn Y., Skeans M.A., Messick E., Goff R., Bradbrook K., Foutz J., Israni A.K., Snyder J.J., Kasiske B.L. OPTN/SRTR 2019 Annual Data Report: Heart. Am. J. Transplant. 2021;21(Suppl 2):356–440. doi: 10.1111/ajt.16492. - DOI - PubMed
    1. Horslen S.P., Smith J.M., Ahn Y., Skeans M.A., Cafarella M., Noreen S.M., Snyder J.J., Israni A.K. OPTN/SRTR 2019 Annual Data Report: Intestine. Am. J. Transplant. 2021;21(Suppl 2):316–355. doi: 10.1111/ajt.16498. - DOI - PubMed

Publication types

Associated data