. 2023 Sep 7;83(17):3064-3079.e5.
doi: 10.1016/j.molcel.2023.07.009. Epub 2023 Aug 7.

G-quadruplexes associated with R-loops promote CTCF binding

Affiliations

G-quadruplexes associated with R-loops promote CTCF binding

Phillip Wulfridge et al. Mol Cell. .

Abstract

CTCF is a critical regulator of genome architecture and gene expression that binds thousands of sites on chromatin. CTCF genomic localization is controlled by the recognition of a DNA sequence motif and regulated by DNA modifications. However, CTCF does not bind to all its potential sites in all cell types, raising the question of whether the underlying chromatin structure can regulate CTCF occupancy. Here, we report that R-loops facilitate CTCF binding through the formation of associated G-quadruplex (G4) structures. R-loops and G4s co-localize with CTCF at many genomic regions in mouse embryonic stem cells and promote CTCF binding to its cognate DNA motif in vitro. R-loop attenuation reduces CTCF binding in vivo. Deletion of a specific G4-forming motif in a gene reduces CTCF binding and alters gene expression. Conversely, chemical stabilization of G4s results in CTCF gains and accompanying alterations in chromatin organization, suggesting a pivotal role for G4 structures in reinforcing long-range genome interactions through CTCF.

Keywords: CTCF; G-quadruplex; R-loops; genome organization.


Conflict of interest statement

Declaration of interests The authors declare no competing interests.

Figures

Figure 1.
Figure 1.. A subset of CTCF peaks localize with R-loops and G-quadruplex structures.
(A) Heatmap of CTCF, MapR, and G4 CUT&TAG signal across 61,541 CTCF peaks in mESCs. Peaks were grouped into high and low R-loop sites via k-means clustering (k = 2 clusters) based on MapR signal alone. (B) Genome browser view of the Alms1 gene showing RPM-normalized CTCF CUT&RUN, MapR, and G4 CUT&TAG signal in mESCs. Low and high R-loop CTCF peaks are highlighted. (C) Profile plot of CTCF CUT&RUN signal over 17,189 high and 44,352 low R-loop CTCF sites in mESCs. (D) Pie charts displaying distribution of high and low R-loop CTCF sites across genomic features. (E) Volcano plot showing log2 fold changes in CTCF binding between WT and ADNP KO mESCs on the x-axis and −log10 FDR on the y-axis. 2,592 sites gain (red) and 111 sites lose (blue) CTCF. Red dotted line, 0.05 FDR cutoff for significance. (F) Heatmap of MapR and CTCF CUT&RUN signal in WT and ADNP KO mESCs across 2,592 randomly sampled CTCF peaks that are invariant (top) or 2,592 gained CTCF peaks in ADNP KO (bottom). (G) Genome browser view of the Mmrn2 and Bmpr1a genes showing RPM-normalized CTCF CUT&RUN, MapR, and ADNP CUT&RUN signal in WT and ADNP KO mESCs. Invariant and gained CTCF peaks are highlighted. See also Figure S1
Figure 2.
Figure 2.. Genomic co-dependency of CTCF and R-loops.
(A) Top, heatmap of MapR, CTCF CUT&RUN, and EZH2 CUT&RUN signal in mESCs untreated or treated with RNase H across 38,219 CTCF peaks called in untreated mESCs. Bottom, boxplots summarizing read densities from heatmaps. p-value, Welch’s two-sided t-test. Box, 25th percentile – median – 75th percentile. Whiskers extend to 1.5x interquartile range; outliers not displayed. (B) Profile plot of CTCF CUT&RUN signal over 38,219 CTCF sites in untreated and RNase H-treated mESCs. *, p-value < 2.2X10⁻¹⁶ (Welch’s two-sided t-test). (C) Genome browser view of the Gm33738 gene showing RPM-normalized CTCF CUT&RUN and MapR signal in untreated and RNase H-treated mESCs. (D) Heatmap of CTCF CUT&RUN and MapR signal in CTCF-AID mESCs untreated or treated with auxin across 28,146 CTCF peaks called in CTCF-AID mESCs. (E) Heatmap of MapR signal in CTCF-AID mESCs untreated or treated with auxin and G4 CUT&TAG signal in WT mESCs across 3,437 CTCF peaks that overlap a G4 peak (top) or 3,437 randomly sampled CTCF peaks that do not overlap G4 (bottom). (F) Profile plot of MapR signal in untreated or auxin-treated CTCF-AID mESCs over CTCF sites that overlap a G4 peak (top) and CTCF sites that do not overlap G4 in untreated mESCs (bottom). (G) Genome browser view of the Cdk20 and Gm31218 genes showing RPM-normalized CTCF CUT&RUN and MapR signal in untreated and auxin-treated CTCF-AID mESCs and G4 CUT&TAG signal in WT mESCs. See also Figure S2
Figure 3.
Figure 3.. R-loops and G-quadruplexes reinforce CTCF binding to its consensus motif.
(A) Representative schematics and descriptions of the nucleic acid substrates used in EMSA experiments. CTCF motif sequences are highlighted in red and RNA components are colored in blue. Full sequences of all substrates are provided in Table S1. (B) EMSA with 0, 200, 400, or 800 nM CTCF and 0.1 nM dsDNA (left), DNA:RNA hybrid (center), or ssDNA (right) substrates. For all resolution assays, schematic structures of substrates from A are shown. Quantification of 3 or more independent experiments are shown as mean values ± SEM. Two-sided Student’s t test p-values are shown where applicable. (C) EMSA with 0, 200, 400, or 800 nM CTCF and 0.1 nM of substrates. Substrates are dsDNA (left), dsDNA with a downstream non-G4-containing R-loop (center), or dsDNA with a downstream G4-containing R-loop (right). (D) EMSA with 0, 200, 400, or 800 nM CTCF and 0.1 nM of substrates. Substrates are dsDNA (left), dsDNA with a downstream non-G4-containing DNA bubble (center), or dsDNA with a downstream G4-containing DNA bubble (right). (E) EMSA with 0, 200, 400, or 800 nM CTCF and 0.1 nM of dsDNA (left) or G4-forming ssDNA (right) substrates. (F) EMSA with 0, 200, 400, or 800 nM CTCF and 0.1 nM of substrates. Substrates are dsDNA (left), dsDNA with a downstream G4-containing DNA bubble (center), or a mixture of dsDNA and G4-forming ssDNA. See also Figure S3
Figure 4.
Figure 4.. Deletion of a G4 motif in Praf2 reduces CTCF binding and gene expression.
(A) Genome browser view of the Praf2 gene showing spike-in normalized CTCF CUT&RUN, MapR, and BG4 CUT&RUN signal in mESCs. Locations of the CTCF and G4 motifs in the region are indicated. (B) Genome browser view of the Praf2 gene showing spike-in normalized MapR signal in WT and Praf2ΔG4 deletion clones. Locations of the CTCF and G4 motifs in the region are indicated. (C) Genome browser view of the Praf2 gene showing spike-in normalized CTCF CUT&RUN signal in WT and Praf2ΔG4 deletion clones. Locations of the CTCF and G4 motifs in the region are indicated. (D) Bar chart quantifying average CTCF signal in WT and Praf2ΔG4 clones across the Praf2 peak displayed in (C). (E) Genome browser view of the Krt78 gene showing spike-in normalized CTCF CUT&RUN signal in WT and Praf2ΔG4 deletion clones. (F) Bar chart of Praf2 gene expression in WT and Praf2ΔG4 deletion clones. Bar chart represents mean values ± SEM from independent RNA-Seq samples. Individual values from each sample are shown as dots. (G) Volcano plot showing log2 fold changes in gene expression between WT and Praf2ΔG4 deletion mESCs on the x-axis and −log10 p-value on the y-axis. Praf2 gene expression is highlighted in red. See also Figure S4
Figure 5.
Figure 5.. G-quadruplex stabilization and concurrent CTCF increases alter genome organization.
(A) Heatmap of spike-in normalized BG4 CUT&RUN signal in mESCs untreated or treated with 2 μM pyridostatin across 15,035 BG4 peaks. (B) Left, heatmap of CTCF ChIP signal in mESCs treated with mock, 2 μM pyridostatin (PDS), 2 μM PhenDC3, 2 μM PDS + 5 μg/ml actinomycin D, or 2 μM PhenDC3 + 5 μg/ml actinomycin D across 78,285 CTCF peaks called across mock-treated, PDS-treated, and PhenDC3-treated mESCs. Peaks are grouped into the quartile with the highest 25% of CTCF signal increase in PDS-treated cells, and the remaining 75% of peaks. Right, profile plot of CTCF signal in mock and drug-treated conditions across the same quartile groupings shown in heatmaps. (C) Genome browser view of the Thop1 gene showing CTCF ChIP (RPM) and BG4 CUT&RUN (spike-in normalized) signal in mock, PDS-treated, or PhenDC3 treated mESCs, with or without Actinomycin D (ActD) co-treatment. (D) 5-kb resolution Hi-C maps of a 4-Mb region of chromosome 2 showing observed contacts in mock (left) and PDS-treated (right) mESCs. Topologically associated domain (TAD) boundaries are indicated with arrows. (E) Bar chart indicating numbers of TADs called in mock and PDS-treated mESCs. (F) 5-kb resolution Hi-C map of a 4-Mb region of chromosome 2 showing observed contacts in mock-treated mESCs (top) and insulation scores in mock (blue) and PDS-treated (red) mESCs (bottom). TAD boundaries with increased boundary strength in PDS-treated cells are indicated by arrows. (G) Bar chart indicating numbers of chromatin loops called in mock and PDS-treated mESCs. (H) Normalized aggregate peak analysis (APA) at 10-kb resolution comparing chromatin loop strength in mock and PDS-treated mESCs across loops called in PDS-treated cells, grouped by whether they are loops shared with mock (top) or PDS-only (bottom). Peak to lower left (P2LL) ratios are indicated in the lower left corners of APA plots. Rightmost plots display the difference in scores between mock and PDS-treated cells. (I) 5-kb resolution Hi-C map of a 400-Kb region of chromosome 2 showing observed contacts in mock (upper right triangle) and PDS-treated (lower left triangle) mESCs. Loops with increased interaction in PDS-treated mESCs are indicated with arrows. CTCF CUT&RUN tracks for mock (blue) and PDS-treated (red) mESCs are displayed below the map. Peaks with gained CTCF in PDS-treated mESCs are indicated with arrows. (J) 5-kb resolution Hi-C map of a 700-Kb region of chromosome 4 showing observed contacts in mock (upper right triangle) and PDS-treated (lower left triangle) mESCs. Loop with increased interaction in PDS-treated mESCs is indicated with arrows. CTCF CUT&RUN tracks for mock (blue) and PDS-treated (red) mESCs are displayed below the map. Peaks with gained CTCF in PDS-treated mESCs are indicated with arrows. See also Figure S5
Figure 6.
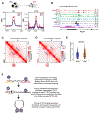
Figure 6.. Induction of G4 and CTCF by PDS resembles differentiation activation at bivalent genes.
(A) Top, schematic representing mESC differentiation to neural progenitor cells (NPCs). Bottom, profile plot of G4 CUT&TAG signal and CTCF ChIP signal in mESCs and NPCs across 6,631 bivalent chromatin regions associated with genes activated during NPC differentiation. (B) Genome browser view of the Pdcd4 gene showing CTCF ChIP (RPM) and G4 CUT&RUN (spike-in normalized) signal in mock and PDS-treated mESCs, CTCF ChIP and G4 CUT&TAG signal in mESCs and NPCs (RPM), and H3K4me3 and H3K27me3 ChIP signal in mESCs (fold change over input). (C) 5-kb resolution Hi-C map of a 700-Kb region of chromosome 19 showing observed contacts in mESCs (upper right triangle) and NPCs (lower left triangle). Pixels with increased interaction in NPCs are highlighted by blue arrows, squares, and insets. The location of the Pdcd4 promoter (region depicted in B) is indicated by black arrows on the sides. (D) 5-kb resolution Hi-C map of a 700-Kb region of chromosome 19 showing observed contacts in mock (upper right triangle) and PDS-treated (lower left triangle) mESCs. Pixels with increased interaction in PDS-treated cells are highlighted by blue arrows, squares, and insets. The location of the Pdcd4 promoter (region depicted in B) is indicated by black arrows on the sides. (E) Violin plot and boxplot of normalized interaction strength of 100 pixels centered around the Pdcd4 chromatin loop showing increased interactions in PDS-treated mESCs (area depicted in inset in D). Data points for individual pixels are represented as dots. Box, 25th percentile – median – 75th percentile. Whiskers extend to 1.5x interquartile range. (F) Model of R-loop and G4 reinforced CTCF binding. CTCF recognizes and binds to its consensus motifs genome-wide. At weaker sequences that are more divergent from the consensus motif, CTCF weakly binds in the absence of other factors, and this level of binding is not sufficient to participate in chromatin looping. Upon R-loop formation near the weak CTCF site, G4s strengthen CTCF binding and promote higher CTCF occupancy, resulting in the formation of de novo chromatin loops. See also Figure S6

References

    1. Thomas M, White RL, and Davis RW (1976). Hybridization of RNA to double-stranded DNA: formation of R-loops. Proc Natl Acad Sci U S A 73, 2294–2298. 10.1073/pnas.73.7.2294. - DOI - PMC - PubMed
    1. Garcia-Muse T, and Aguilera A (2019). R Loops: From Physiological to Pathological Roles. Cell 179, 604–618. 10.1016/j.cell.2019.08.055. - DOI - PubMed
    1. Niehrs C, and Luke B (2020). Regulatory R-loops as facilitators of gene expression and genome stability. Nat Rev Mol Cell Biol 21, 167–178. 10.1038/s41580-019-0206-3. - DOI - PMC - PubMed
    1. Petermann E, Lan L, and Zou L (2022). Sources, resolution and physiological relevance of R-loops and RNA-DNA hybrids. Nat Rev Mol Cell Biol. 10.1038/s41580-022-00474-x. - DOI - PubMed
    1. Brickner JR, Garzon JL, and Cimprich KA (2022). Walking a tightrope: The complex balancing act of R-loops in genome stability. Mol Cell 82, 2267–2297. 10.1016/j.molcel.2022.04.014. - DOI - PMC - PubMed

Publication types