. 2023 Aug;13(8):230081.
doi: 10.1098/rsob.230081. Epub 2023 Aug 9.

Spatial positioning of preimplantation mouse embryo cells is regulated by mTORC1 and m7G-cap-dependent translation at the 8- to 16-cell transition

Affiliations

Spatial positioning of preimplantation mouse embryo cells is regulated by mTORC1 and m7G-cap-dependent translation at the 8- to 16-cell transition

Lenka Gahurova et al. Open Biol. 2023 Aug.

Abstract

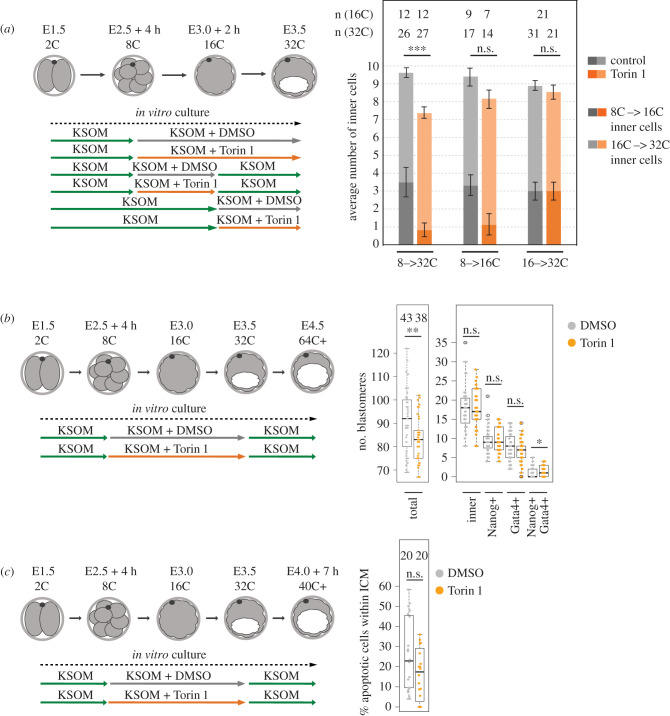
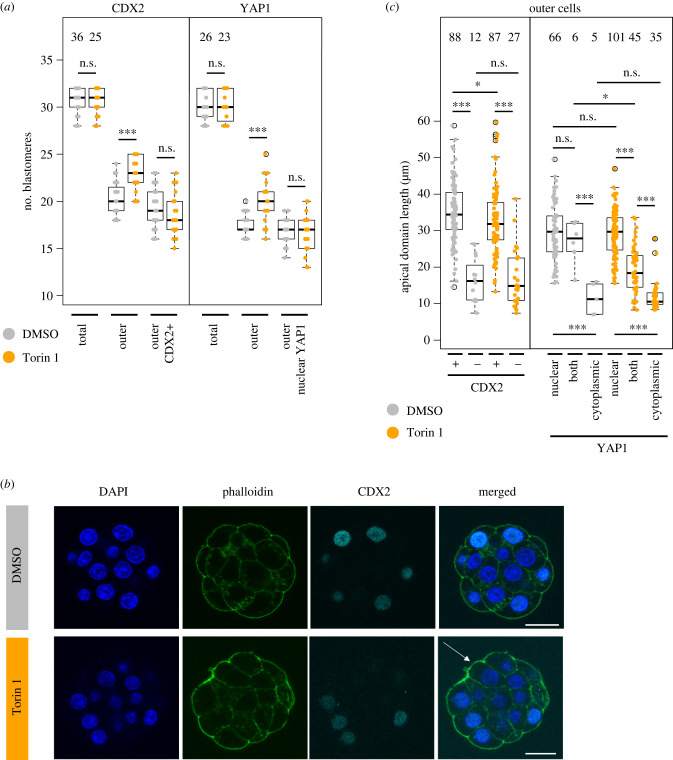
Preimplantation mouse embryo development involves temporal-spatial specification and segregation of three blastocyst cell lineages: trophectoderm, primitive endoderm and epiblast. Spatial separation of the outer-trophectoderm lineage from the two other inner-cell-mass (ICM) lineages starts with the 8- to 16-cell transition and concludes at the 32-cell stages. Accordingly, the ICM is derived from primary and secondary contributed cells; with debated relative EPI versus PrE potencies. We report generation of primary but not secondary ICM populations is highly dependent on temporal activation of mammalian target of Rapamycin (mTOR) during 8-cell stage M-phase entry, mediated via regulation of the 7-methylguanosine-cap (m7G-cap)-binding initiation complex (EIF4F) and linked to translation of mRNAs containing 5' UTR terminal oligopyrimidine (TOP-) sequence motifs, as knockdown of identified TOP-like motif transcripts impairs generation of primary ICM founders. However, mTOR inhibition-induced ICM cell number deficits in early blastocysts can be compensated by the late blastocyst stage, after inhibitor withdrawal; compensation likely initiated at the 32-cell stage when supernumerary outer cells exhibit molecular characteristics of inner cells. These data identify a novel mechanism specifically governing initial spatial segregation of mouse embryo blastomeres, that is distinct from those directing subsequent inner cell formation, contributing to germane segregation of late blastocyst lineages.

Keywords: EIF4EBP1/4EBP1; TOP-motif; cell fate; inner cell mass/ICM and cell positioning; mTOR/mTORC1; preimplantation mouse embryo.


Conflict of interest statement

All authors declare a complete lack of conflict of interest arising from the reported research.

Figures

Figure 1.
Figure 1.
Enhanced mTOR-dependent expression levels of pEIF4EBP1 during the 8- to 16-cell cleavage division. (a) Example IF staining micrographs of pEIF4EBP1 (Thr37/46) and pan-EIF4EBP1 at either 8- or 16-cell interphase and the individual stages of mitotic division from 8- to 16-cell stage in individual blastomeres (left), as quantified separately for nucleus (interphase cells)/chromosomal area defined by DAPI staining (mitotic cells) and cytoplasm (right). EIF4EBP1 visualized in greyscale, DAPI in blue, representative confocal z-stacks for individual stages shown. Scale: 20 µm. (b) Quantification of IF staining of pEIF4EBP1 (Thr37/46) and pan-EIF4EBP1 in 8- and 16-cell interphase and dividing blastomeres, +/− Torin1. (c) Quantification of nascent translation by O-propargyl-puromycin (OPP) polypeptide incorporation and fluorescent labelling assay in 8- and 16-cell interphase and dividing blastomeres, +/− Torin1. In all graphs, numbers of analysed blastomeres are shown.
Figure 2.
Figure 2.
mTOR-regulated m7G-cap-dependent translation plays a role in primary ICM cell generation. (a) Experimental scheme, visualization of example outer, inner and SAD cells, and quantification of the number of inner and SAD cells in 16-cell embryos, +/− Torin1. (b) Experimental scheme with shorter inhibition period and quantification of inner and SAD cells in 16-cell embryos, +/− Torin1 or +/− 4EGI-1. (c) Experimental scheme and quantification of inner and SAD cells in injected (i.e. indicated siRNA/mRNA) and non-injected clones of 16-cell stage embryos. In all graphs, ‘×’ marks the average value, and numbers of analysed embryos are shown.
Figure 3.
Figure 3.
Trends associated with 8-cell stage blastomere nuclear positioning and mitotic spindle angles and the generation of primary ICM cells are not applicable under mTORi conditions. (a) Scheme of the identified association between 8-cell stage blastomere nuclear position and spatial positions of daughter cells post-division [24]. (b) Quantification of the position of the immediately pre-M-phase 8-cell stage nucleus on the intra-cellular apico-basolateral axis (i.e. embryonic radial axis), +/− Torin1; in all blastomeres, or those that generated two outer cells or one outer and one inner/SAD daughter cell at the 16-cell stage. Numbers of analysed blastomeres are shown. (c) Scheme of the reported association between mitotic spindle angle and spatial positions of daughter blastomeres after 8-cell stage cell division; note: spindle angle is denoted by the angle of lines bisecting the two spindle poles and the radial axis of the embryo from each individual blastomere’s most apical membrane domain. (d) Quantification of the average spindle angle of 8-cell dividing blastomeres, +/− Torin1. Numbers of analysed blastomeres are shown. (e) Quantification of the spindle angle versus resulting spatial positions of daughter blastomeres, +/− Torin1. Each bar represents at least 15 blastomeres. Numbers of analysed blastomeres are shown.
Figure 4.
Figure 4.
RNAi-mediated knockdown of candidate TOP-motif containing mRNAs also impairs the generation of primary ICM cells. Experimental scheme and quantification of inner and SAD cell numbers in gene/transcript specific RNAi (Ank2, Dctn2 and Ddx21) injected and non-injected clones in 16-cell stage embryos. In all graphs, ‘×’ marks an average value. Numbers of analysed embryos are shown.
Figure 5.
Figure 5.
mTORi does not affect secondary ICM founder cell generation and ICM cell numbers recover during blastocyst maturation (E3.5–E4.5) after prior mTORi from the late 8-cell stage. (a) Experimental scheme and quantification of inner cell numbers at 32-cell stage, as contributed by primary and secondary ICM cells, +/− Torin1. Primary ICM cell count was estimated by fixation of some embryos at 16-cell stage and quantification of their number of inner cells, to allow for the number of such primary and secondary founders to be determined at the 32-cell stage, when deducting this number and allowing for the extra cell division. (b) Experimental scheme and quantification of total cell number, ICM cell number and the numbers of NANOG + GATA4− (EPI), NANOG− GATA4+ (PrE) and NANOG + GATA4+ ICM cells, +/− Torin1 (E4.5). (c) Experimental scheme and quantification of the proportion of apoptotic ICM cells (positive for cleaved Caspase-3 IF staining), +/− Torin1 (E4.0 + 7 h). In all graphs, numbers of analysed embryos are shown.
Figure 6.
Figure 6.
Supernumerary outer cells in mTORi 32-cell stage embryos exhibit molecular characteristics of ICM-like cells. (a) Quantification of total number of blastomeres, outer blastomeres, and CDX2 + outer blastomeres, or outer blastomeres with nuclear YAP1 without cytoplasmic YAP1 signal, +/− Torin1. Numbers of analysed embryos are shown. (b) Example IF staining micrographs of CDX2 staining in 32-cell stage embryos cultured under control and mTORi conditions. CDX2 visualized in cyan, DAPI in blue, phalloidin in green, representative confocal z-stacks for individual stages shown. Scale bar: 20 µm. An outer cell without CDX2 in mTORi condition marked by an arrow. (c) Quantification of apical domain length in single z-stack (with largest membrane length) in outer cells +/− CDX2 and nuclear, cytoplasmic or nuclear + cytoplasmic YAP1, +/− Torin1. Numbers of analysed blastomeres are shown.

Similar articles

Cited by

References

    1. Chazaud C, Yamanaka Y. 2016. Lineage specification in the mouse preimplantation embryo. Development 143, 1063-1074. (10.1242/dev.128314) - DOI - PubMed
    1. Plusa B, Piliszek A. 2020. Common principles of early mammalian embryo self-organisation. Development 147, dev183079. (10.1242/dev.183079) - DOI - PubMed
    1. Vinot S, Le T, Maro B, Louvet-Vallée S. 2004. Two PAR6 proteins become asymmetrically localized during establishment of polarity in mouse oocytes. Curr. Biol. 14, 520-525. (10.1016/j.cub.2004.02.061) - DOI - PubMed
    1. Vinot S, Le T, Ohno S, Pawson T, Maro B, Louvet-Vallée S. et al. 2005. Asymmetric distribution of PAR proteins in the mouse embryo begins at the 8-cell stage during compaction. Dev. Biol. 282, 307-319. (10.1016/j.ydbio.2005.03.001) - DOI - PubMed
    1. Louvet S, Aghion J, Santa-Maria A, Mangeat P. Maro B. 1996. Ezrin becomes restricted to outer cells following asymmetrical division in the preimplantation mouse embryo. Dev. Biol. 177, 568-579. (10.1006/dbio.1996.0186) - DOI - PubMed

Publication types

Substances

LinkOut - more resources