. 2023 Aug 8;6(10):e202302142.
doi: 10.26508/lsa.202302142. Print 2023 Oct.

De novo network analysis reveals autism causal genes and developmental links to co-occurring traits

Affiliations

De novo network analysis reveals autism causal genes and developmental links to co-occurring traits

Catriona J Miller et al. Life Sci Alliance. .

Abstract

Autism is a complex neurodevelopmental condition that manifests in various ways. Autism is often accompanied by other conditions, such as attention-deficit/hyperactivity disorder and schizophrenia, which can complicate diagnosis and management. Although research has investigated the role of specific genes in autism, their relationship with co-occurring traits is not fully understood. To address this, we conducted a two-sample Mendelian randomisation analysis and identified four genes located at the 17q21.31 locus that are putatively causal for autism in fetal cortical tissue (LINC02210, LRRC37A4P, RP11-259G18.1, and RP11-798G7.6). LINC02210 was also identified as putatively causal for autism in adult cortical tissue. By integrating data from expression quantitative trait loci, genes and protein interactions, we identified that the 17q21.31 locus contributes to the intersection between autism and other neurological traits in fetal cortical tissue. We also identified a distinct cluster of co-occurring traits, including cognition and worry, linked to the genetic loci at 3p21.1. Our findings provide insights into the relationship between autism and co-occurring traits, which could be used to develop predictive models for more accurate diagnosis and better clinical management.


Conflict of interest statement

The authors declare that they have no conflict of interest.

Figures
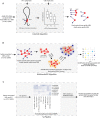
Figure 1.
Figure 1.. Schematic of the methods used in this study.
(A) Outline of generation of fetal and adult cortical tissue gene regulatory networks (GRN) using CoDeS3D. Hi-C chromatin libraries, derived from fetal brain-specific cortical plate and germinal zone neurons and adult dorsolateral prefrontal cortex cells, were downloaded from dbGaP (accession: phs001190.v1.p1) and GEO (https://www.ncbi.nlm.nih.gov/geo/, accession: GSE87112) respectively. (B) The Multimorbid3D algorithm was used to identify traits that co-occur with autism. Autism-associated SNPs (P < 5 × 10⁻⁸, n = 576; 2,753 SNPs including those in LD [r2 = 0.8, width = 5,000 bp]) from the GWAS Catalog (www.ebi.ac.uk/gwas; 08/05/2022) were used to query the fetal and adult cortical tissue GRNs to generate the autism-specific GRNs. STRING (version 11.5; https://string-db.org) was queried to create a multilevel protein–protein interaction network for the fetal and adult cortical tissue, separately. (C) SNPs were functionally annotated using Sei (Chen et al, 2022). 2,753 SNPs, including those in LD with the autism-associated SNPs (Table S2), were queried into Sei. SNPs were collated into LD loci and separated into three groups (loci containing fetal expression quantitative trait loci [eQTLs], loci containing adult eQTLs, and loci containing only SNPs that were not eQTLs). There was some overlap between the fetal and adult groups.
Figure S1.
Figure S1.. Two-sample Mendelian randomisation identified genes causal with autism.
(A) Outline of the methods followed using the TwoSampleMR R package (https://github.com/MRCIEU/TwoSampleMR/, version 0.5.6) (Hemani et al, 2018). The earlier output of CoDeS3D (Fig 1A) was used as exposure data for fetal and adult. Outcome data came from the iPSYCH-PGS 2017 ASD GWAS (Grove et al, 2019) and were downloaded from the IEU Open GWAS Project (Elsworth et al, 2020 Preprint). Numbers after each step refer to the number of rows (i.e., SNP–gene/exposure pairings). Only outcome data present in the exposure data were downloaded, giving the discrepancy between the adult and fetal numbers. (B) Effect size on autism of the four genes statistically significant, and therefore, potentially causal with autism, within the fetal cortical tissue group. Bars given show 90% confidence intervals.
Figure 2.
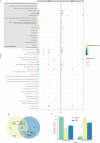
Figure 2.. Comparing traits identified during the multimorbid3D analysis for the fetal and adult groups.
(A) Traits identified during the Multimorbid3D analysis shared between the adult and fetal groups using the STRING database to expand the protein–protein interaction network (PPIN). Some traits appear on multiple levels. Circle size indicates the number of expression quantitative trait loci (eQTLs), whereas colour indicates the negative-logged P-value from bootstrapping. Y-axis labels are based on GWAS trait names. Traits which passed the hypergeometric test (P < 0.05) but were insignificant (P ≥ 0.05) after bootstrapping are shaded grey. Note: neuroticism has also been misspelt as neurociticism in the GWAS Catalog meaning it appears twice. (B) Venn diagram outlining shared and unique traits across the autism PPIN (level 0–4). 44 traits appeared in both groups, representing 46% of the fetal traits and 52% of the adult traits. (C) Bar graph outlining the number of traits identified at different levels of the PPIN. The graph shows that most of the shared traits are at level 0 (**** = P-value < 0.0001 for shared traits and fetal traits. No difference in adult traits between index and outer levels; ns = not significant P-value = 0.179).
Figure S2.
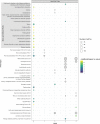
Figure S2.. Traits identified during the Multimorbid3D analysis unique to the adult group using the STRING database to expand the protein-protein interaction network.
–Some traits appear on multiple levels. Circle size indicates the number of expression quantitative trait loci, whereas colour indicates the negative-logged P-value from bootstrapping. Y-axis labels are based on GWAS trait names. Traits which passed the hypergeometric test (P < 0.05) but were insignificant after bootstrapping are shaded grey.
Figure S3.
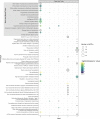
Figure S3.. Traits identified during the Multimorbid3D analysis unique to the fetal group using the STRING database to expand the protein-protein interaction network.
–Some traits appear on multiple levels. Circle size indicates the number of expression quantitative trait loci, whereas colour indicates the negative-logged P-value from bootstrapping. Y-axis labels are based on GWAS trait names. Traits which passed the hypergeometric test (P < 0.05) but were insignificant after bootstrapping are shaded grey.
Figure 3.
Figure 3.. De novo network analysis identified gene clusters and pleiotropic traits in the fetal gene regulatory networks for autism.
Bi-clustering was performed on the gene trait associations using eQTL frequency to identify clusters. eQTL–gene data were obtained using Multimorbid3D. Brain and mood-related traits are shaded grey. Text coloured based on gene clusters. Black outlines indicate—the chromosome 17 genes (KANSL1—RP11-259G18.1) relating to a range of mood and brain traits, the chromosome 3 groups (TMEM110—STAB1 and ITIH4—NT5DC2) relating to cognition and worry, and the set of genes at the intersection of autism and schizophrenia. See Table S4 for raw output.
Figure 4.
Figure 4.. De novo network analysis identified autism-associated gene clusters and pleiotropic traits within the adult cortex.
Bi-clustering was performed on gene trait associations using eQTL numbers. Data were derived from a Multimorbid3D analysis of the adult cortical gene regulatory networks. For simplicity, all rows with only one eQTL–gene connection were removed (see Table S5 for raw output).
Figure S4.
Figure S4.. De novo network analysis identified gene clusters and pleiotropic traits in the fetal group for autism on the outer levels (1–4).
Bi-clustering was performed on gene-trait associations using expression quantitative trait loci numbers to identify clusters. Data were derived from a Multimorbid3D analysis of the fetal cortical gene regulatory networks. For simplicity, all rows with only one expression quantitative trait loci-gene connection were removed (see Table S4 for raw output).
Figure S5.
Figure S5.. De novo network analysis identified gene clusters and pleiotropic traits in the adult group for autism on the outer levels (1–4).
Bi-clustering was performed on gene-trait associations using expression quantitative trait loci numbers to identify clusters. Data were derived from a Multimorbid3D analysis of the adult cortical gene regulatory networks. For simplicity, all rows with only one expression quantitative trait loci-gene connection were removed (see Table S5 for raw output).
Figure S6.
Figure S6.. Deep-learning algorithm Sei predicted regulatory activity in autism-associated SNPs.
(A) Venn diagram outlining the number of loci of autism-associated SNPs that were spatially constrained expression quantitative trait loci (eQTLs) within the fetal and adult cortical tissue gene regulatory networks. (B) Fetal (P-value < 0.05) and adult (P-value < 0.0001) eQTL containing loci were enriched for enhancers when compared with loci containing the non-eQTL SNPs (GWAS SNPs). Annotations were performed using Sei. (C) There was a significant increase in mean regulatory scores for fetal (P-value < 0.01) and adult eQTLs (P-value < 0.01) when compared with the non-eQTL SNPs (GWAS SNPs). Mean regulatory scores were calculated using the absolute maximum for each SNP, as output by Sei (Table S7).
Figure S7.
Figure S7.. Deep-learning algorithm Sei predicted regulatory activity in autism-associated SNPs.
The SNPs with the top 50 absolute maximum scores were selected and their scores for all 40 categories plotted in a heatmap. A positive score (red) indicates an increased Sei predicted value for that regulatory class compared with the reference SNP, whereas a negative score (blue) indicates a decreased Sei-predicted value. Bi-clustering was performed based on the scores for each category.
Figure S8.
Figure S8.. Deep-learning algorithm Sei predicted regulatory activity in autism-associated expression quantitative trait loci (eQTLs) within the fetal cortical tissue gene regulatory networks.
The same method as Fig S7 was undertaken; however, only the top 50 scoring fetal eQTLs were selected. Genes listed next to each eQTL are the genes associated with that eQTL in our Multimorbid3D analysis.
Figure S9.
Figure S9.. Deep-learning algorithm Sei predicted regulatory activity in autism-associated expression quantitative trait loci (eQTLs) within the adult cortical tissue gene regulatory networks.
The same method as Fig S7 was undertaken; however, only the top 50 scoring adult eQTLs were selected. Genes listed next to each eQTL are the genes associated with that eQTL in our Multimorbid3D analysis.
Figure 5.
Figure 5.. Odds ratios for conditions identified as co-occurring within autistic New Zealanders.
Conditions that occurred at significantly (P < 0.05 after multiple testing correction) different rates, when compared with the hospitalised New Zealand population, and overlapped traits identified by Multimorbid3D (i.e., Figs 3 and 4) are shown. Many conditions had multiple ICD-10 codes (e.g., childhood autism and Asperger’s syndrome for autism and multiple subcodes for schizophrenia).

References

    1. American Psychiatric Association (2013) Diagnostic and Statistical Manual of Mental Disorders (DSM-5 (R)). Washington, DC: American Psychiatric Association.
    1. Antaki D, Guevara J, Maihofer AX, Klein M, Gujral M, Grove J, Carey CE, Hong O, Arranz MJ, Hervas A, et al. (2022) A phenotypic spectrum of autism is attributable to the combined effects of rare variants, polygenic risk and sex. Nat Genet 54: 1284–1292. 10.1038/s41588-022-01064-5 - DOI - PMC - PubMed
    1. Autism Spectrum Disorders Working Group of The Psychiatric Genomics Consortium (2017) Meta-analysis of GWAS of over 16,000 individuals with autism spectrum disorder highlights a novel locus at 10q24.32 and a significant overlap with schizophrenia. Mol Autism 8: 21. 10.1186/s13229-017-0137-9 - DOI - PMC - PubMed
    1. Bahrami S, Shadrin A, Frei O, O’Connell KS, Bettella F, Krull F, Fan CC, Røssberg JI, Hindley G, Ueland T, et al. (2021) Genetic loci shared between major depression and intelligence with mixed directions of effect. Nat Hum Behav 5: 795–801. 10.1038/s41562-020-01031-2 - DOI - PMC - PubMed
    1. Bailey CDC, Alves NC, Nashmi R, de Biasi M, Lambe EK (2012) Nicotinic α5 subunits drive developmental changes in the activation and morphology of prefrontal cortex layer VI neurons. Biol Psychiatry 71: 120–128. 10.1016/j.biopsych.2011.09.011 - DOI - PMC - PubMed

Publication types

MeSH terms