. 2023 Aug 8;14(1):4754.
doi: 10.1038/s41467-023-40487-4.

SNIP1 and PRC2 coordinate cell fates of neural progenitors during brain development

Affiliations

SNIP1 and PRC2 coordinate cell fates of neural progenitors during brain development

Yurika Matsui et al. Nat Commun. .

Abstract

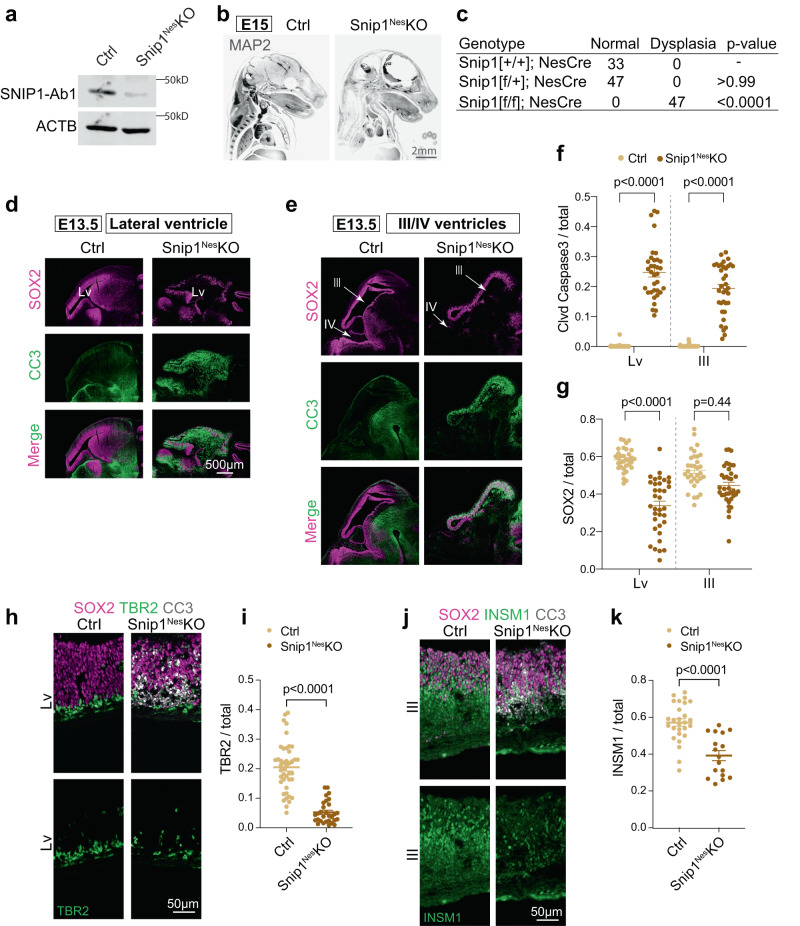
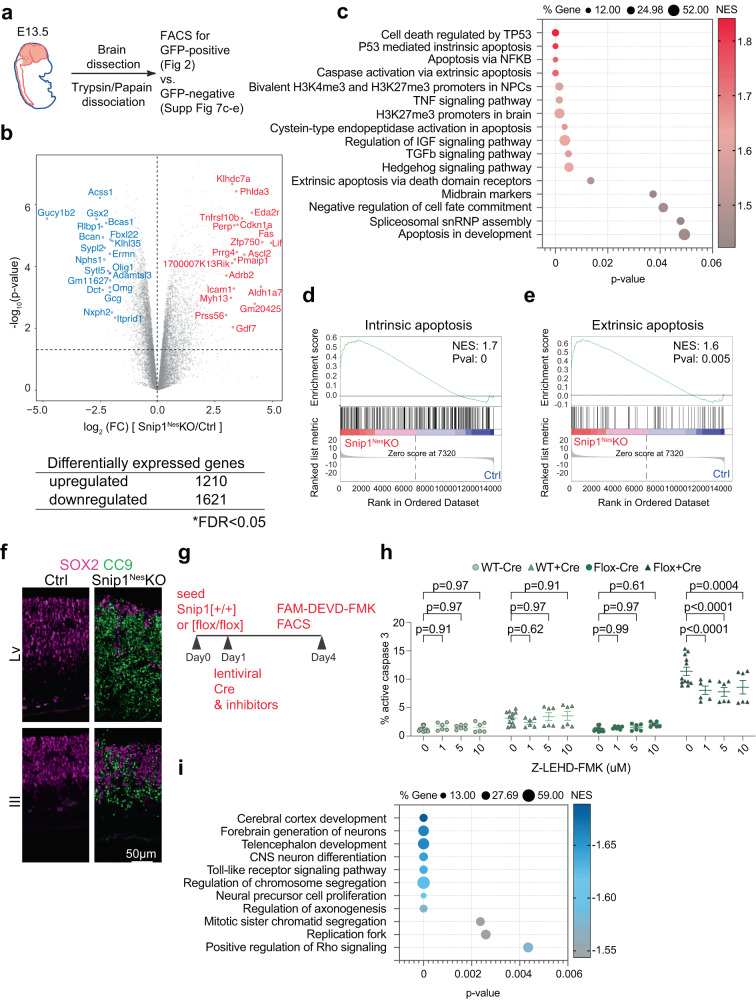
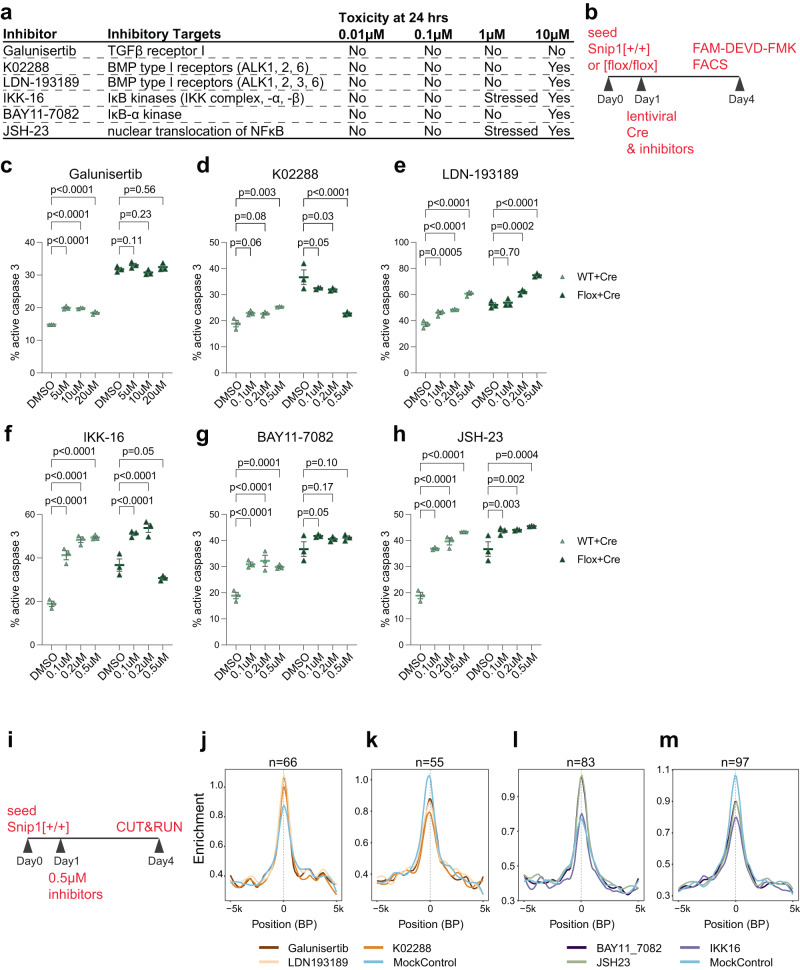
Stem cell survival versus death is a developmentally programmed process essential for morphogenesis, sizing, and quality control of genome integrity and cell fates. Cell death is pervasive during development, but its programming is little known. Here, we report that Smad nuclear interacting protein 1 (SNIP1) promotes neural progenitor cell survival and neurogenesis and is, therefore, integral to brain development. The SNIP1-depleted brain exhibits dysplasia with robust induction of caspase 9-dependent apoptosis. Mechanistically, SNIP1 regulates target genes that promote cell survival and neurogenesis, and its activities are influenced by TGFβ and NFκB signaling pathways. Further, SNIP1 facilitates the genomic occupancy of Polycomb complex PRC2 and instructs H3K27me3 turnover at target genes. Depletion of PRC2 is sufficient to reduce apoptosis and brain dysplasia and to partially restore genetic programs in the SNIP1-depleted brain in vivo. These findings suggest a loci-specific regulation of PRC2 and H3K27 marks to toggle cell survival and death in the developing brain.


Conflict of interest statement

The authors declare no competing interests.

Figures

Fig. 1
Fig. 1. Depletion of SNIP1 in NPCs causes brain dysplasia in mouse embryos.
a WB of control and Snip1Nes-KO NPCs at E13.5. At least 5 replicates of control and Snip1Nes-KO NPCs showed similar results. SNIP1-Ab1; anti-SNIP1 antibody from ProteinTech. b IF of MAP2 in control and Snip1Nes-KO embryos at E15. Embryos were cleared by the iDISCO method and imaged with light sheet microscopy. Two replicates of IF showed similar results. Bar, 2 mm. c Penetrance of brain dysplasia in E13.5 embryos. Brain dysplasia was determined by the thinning of the brain tissue. Statistical significance was calculated by Fisher’s exact test. d–e IF of SOX2 and cleaved caspase 3 (CC3) in sagittal cryosections of the E13.5 brain. Germinal zones around lateral ventricle (Lv, forebrain), third ventricle, (midbrain) and fourth (hindbrain) ventricle were examined. Bar, 500 μm. f, g Quantification of CC3-positive and SOX2-positive cells in the neuroepithelial lining of the ventricles of control and Snip1Nes-KO embryos at E13.5. DAPI staining was used to count the total number of cells. Each data point represents one image. Eight control embryos and 7 Snip1Nes-KO embryos were analyzed. In (f), for lateral ventricle, n = 38 images (control) and n = 34 (Snip1Nes-KO); for the third ventricle, n = 38 (control) and n = 36 (Snip1Nes-KO). In (g), for lateral ventricle, n = 33 (control) and n = 35 (Snip1Nes-KO); for the third ventricle, n = 32 (control) and n = 37 (Snip1Nes-KO). Data are presented as mean ± SEM, and two-way ANOVA was used for statistical analysis. h–j IF of SOX2 and CC3 overlayed with neural lineage markers TBR2 and INSM1 of the E13.5 brain. Bar, 50 μm. i, k Quantification of TBR2-positive or INSM1-positive cells in the neuroepithelial lining of lateral or third ventricles. Each data point represents one image. Five to 8 control embryos and 3-7 Snip1Nes-KO embryos were analyzed. In (i), n = 43 images (control) and n = 30 (Snip1Nes-KO); in (k), n = 27 (control) and n = 17 (Snip1Nes-KO). Data are presented as mean ± SEM, and two-way ANOVA was used for statistical analysis. Source data are provided in a Source Data file (a, f, g, i, k).
Fig. 2
Fig. 2. SNIP1 suppresses genes involved in apoptosis and signal transduction and promotes genes for brain development.
a Schematic of the brain NPC collection. b Volcano plot and the number of differentially expressed genes between the control and Snip1Nes-KO NPCs. The table shows the number of genes that passed the cutoff of FDR < 0.05. FDR was calculated by the Benjamini & Hochberg method. P values were calculated by two-sided Voom-limma t test. c, i Bubble plots of the enriched gene sets in upregulated genes and downregulated genes in Snip1Nes-KO vs. control NPCs. Differentially expressed genes were first ranked by their fold-change, p-value, and expression level before Gene Set Enrichment Analysis (GSEA) was performed. P-values were calculated by a right-sided permutation test with FDR adjustment. d, e Representative GSEA of upregulated genes in Snip1Nes-KO vs. control NPCs. Upregulated genes were enriched in gene sets related to both intrinsic and extrinsic apoptosis. Differentially expressed genes were first ranked by their fold-change and p-value before GSEA was performed. f IF of cleaved caspase 9 (CC9) overlayed with SOX2 in sagittal cryosections of the E13.5 brain. Bar, 50 μm. g Schematic of transduction with mCherry-Cre lentivirus and treatment with inhibitors in Snip1[+/+] and Snip1[flox/flox] NPCs. h The percentage of cells with active caspase 3 quantified by FACS. Caspase 9 inhibitor (Z-LEHD-FMK) was added at different concentrations along with mCherry-Cre lentivirus. The percentage of FAM-FLICA (active caspase 3)-positive population (out of total population) is shown. N = 12 for DMSO control and n = 6 for the rest of the sample. Data are presented as mean ± SEM, and two-way ANOVA was used for statistical analysis. The gating strategy and representative FACS plots are shown in Supplementary Information (Supplementary Fig. 4e, Supplementary Fig 14a). Source data are provided in a Source Data file (c, h, i).
Fig. 3
Fig. 3. SNIP1 binds to chromatin and affects H3K27me3 levels for regulating gene expression.
a Heatmaps representing the binding intensity of 2 biological replicates of SNIP1 CUT&RUN in control and Snip1Nes-KO NPCs. Binding intensity for 5 kb on either side of all 23,188 SNIP1 CUT&RUN peaks are shown. Blue indicates low intensity and red indicates high intensity. b Bar charts displaying the numbers of upregulated and downregulated genes (Snip1Nes-KO vs. control, FDR < 0.05) that are bound by SNIP1 at their gene body. c, d Bubble plots of the enriched gene sets in SNIP1-bound genes that became upregulated genes and downregulated genes in Snip1Nes-KO vs. control NPCs. When adding our H3K27me3/ac CUT&RUN data to the GSEA gene sets, H3K27me3 and H3K27ac levels showed anti-correlation and correlation with gene expression, respectively. Source data are provided in a Source Data file. e Representative GSEA of upregulated genes in Snip1Nes-KO NPCs vs. control NPCs that are bound by SNIP1 in control NPCs. Intrinsic apoptosis genes were mostly SNIP1-bound and were enriched in the upregulated genes in Snip1Nes-KO NPCs. Differentially expressed genes were first ranked by their fold-change and p-value before GSEA was performed. f Pie chart showing the proportions of intrinsic apoptosis genes that are upregulated in Snip1Nes-KO NPCs and/or bound by SNIP1. g Venn diagram displaying the numbers of upregulated intrinsic apoptosis genes in 3 categories. Using our SNIP1, H3K27me3, and H3K27ac CUT&RUN data, the 44 genes were categorized into 1) SNIP1-bound in control NPCs, 2) reduced H3K27me3 levels in Snip1Nes-KO vs. control NPCs (p < 0.05), and/or 3) increased H3K27ac levels in Snip1Nes-KO vs. control NPCs (p < 0.05). h H3K27me3 and SNIP1 CUT&RUN tracks visualized by Integrative Genomics Viewer (IGV) at upregulated intrinsic apoptosis genes. Cdkn1a, Chr17: 29,090,888 − 29,095,850. Trp73, Chr4: 154,132,565 − 154,143,373. Msx1, Chr5: 37,818,429 − 37,828,924.
Fig. 4
Fig. 4. Inhibitors to TGFβ and NFκB signaling pathways alter NPC survival and SNIP1 binding to chromatin.
a Inhibitors targeting components in TGFβ and NFκB signaling pathways and their cytotoxicity at different concentrations. b Schematic of inhibitor assay. On Day 1, WT or Snip1[flox/flox] NPCs were treated with inhibitor or DMSO and transduced with lentiviral Cre for SNIP1 depletion. FAM-DEVD-FMK was used for assaying cl-caspase 3 by FACS on Day 4. c–h The percentage of cells with active caspase 3 quantified by FACS. Inhibitors were added at different concentrations along with mCherry-Cre lentivirus. The percentage of FAM-FLICA (active caspase 3)-/ mCherry-double positive population (out of mCherry-positive population) is shown. N = 3 for each treatment. Data are presented as mean ± SEM, and two-way ANOVA was used for statistical analysis. The representative FACS plots are shown in Supplementary Fig. 14c, d. Source data are provided in a Source Data file. i Schematic of SNIP1 CUT&RUN with inhibitor treatment. At day 1, NPCs were treated with DMSO control or different inhibitors. Replicate SNIP1 CUT&RUN was performed for each of the 7 treatments on day 4. j–m Profile plots comparing the median binding intensity of SNIP1 in NPCs at the SNIP1-bound targets that had significantly higher or lower SNIP1 binding in inhibitors versus DMSO control treatment. n indicates region numbers. Regions were considered true SNIP1 targets when SNIP1 levels reduced in Snip1Nes-KO vs. control NPCs with p < 0.05.
Fig. 5
Fig. 5. SNIP1-bound regions are co-occupied by PRC2 on NPC chromatin.
a–d Co-immunoprecipitation followed by WB to examine the interaction between SNIP1 and PRC2. (a) SNIP1, (b) JARID2, (c) EZH2, or (d) EED was immunoprecipitated in the NPC nuclear extract. RBBP5 was a negative control. Source data are provided as a Source Data file. e Heatmaps aligning chromatin peaks enriched with SNIP1, SUZ12, and EZH2 in NPCs. Peaks from SNIP1 CUT&RUN–reChIP with IgG, EZH2, and H3K27me3 were aligned to SNIP1-bound peaks. Intensity for 5 or 10 kb on either side of 23,188 SNIP1-bound peaks are shown. A dark color indicates high intensity and a light color indicates low intensity. f Tracks of SNIP1 CUT&RUN–reChIP with IgG, EZH2, and H3K27me3 are visualized by Integrative Genomics Viewer (IGV). Mcm7, Chr5: 138,169,717 − 138,173,621. Aen, Chr7: 78,894,526 − 78,898,271. Lhx8, Chr3: 154,325,066 − 154,334,835. Eomes, Chr9: 118,474,178 − 118,480,775. g Profile plots comparing the median binding intensity of SNIP1, PRC2, and H3K27me3/ac in Snip1Nes-KO vs. control NPCs at the SNIP1 targets. Regions were considered true SNIP1 targets when SNIP1 levels were reduced in Snip1Nes-KO vs. control NPCs with p < 0.05. h, i Motifs of SNIP1- and SUZ12-bound regions where their levels significantly reduced in Snip1Nes-KO NPCs with fold-change >2 and p < 0.05. HOMER de novo analysis was performed and the five motifs with lowest p-values and had vertebrate motif matches are listed here. j, k Volcano plots of transcription factors whose binding to our differentially expressed genes (FDR < 0.05) has been reported. Genes were searched against ENCODE and ChEA consensus TFs from ChIP-X database using Enrichr. Darker colors show smaller p-values and large points passed p-value < 0.05. Transcription factors in bold were found in our CUT&RUN motif analyses in Fig. 5h, i.
Fig. 6
Fig. 6. EED depletion reduces apoptosis and brain dysplasia of the Snip1Nes-KO brain.
a Schematic of the genetic cross depleting both SNIP1 and EED for downstream assays. b, c IF analysis of CC3 overlayed with DAPI of the E13.5 brain. Bar, 50 μm. Each data point represents one image. Eight control embryos, 7 Snip1Nes-KO embryos, and 5 Snip1Nes-EedNes-dKO embryos were analyzed. For lateral ventricle, n = 38 images (control), n = 34 (Snip1Nes-KO), and n = 23 (Snip1Nes-EedNes-dKO). For third ventricle, n = 38 (control), n = 36 (Snip1Nes-KO), and n = 26 (Snip1Nes-EedNes-dKO). d–i IF of NPC marker SOX2, and intermediate progenitor markers TBR2 and INSM1 overlayed with DAPI of the E13.5 brain. Bar, 50 μm. The populations of (e) SOX2-positive, (g) TBR2-positive, or (i) INSM1-positive cells in the neuroepithelial lining of lateral and/or third ventricles were quantified. Each data point represents one image. In (g), n = 43 images (control), n = 30 (Snip1Nes-KO), and n = 29 (Snip1Nes-EedNes-dKO). In (i), n = 27 (control), n = 17 (Snip1Nes-KO), and n = 16 (Snip1Nes-EedNes-dKO). For Panels c, e, g, and i, data are presented as mean ± SEM, and two-way ANOVA was used for statistical analysis. j Unsupervised clustering of RNA-seq data from control (n = 3), Snip1Nes-KO (n = 3), and Snip1Nes-EedNes-dKO (n = 6) brains at E13.5. RNAs from forebrain and midbrain regions were sequenced and merged for downstream analyses. Blue indicates a negative correlation and red indicates a positive correlation. k, m Venn diagrams displaying the numbers of differentially expressed genes with FDR < 0.05. The lists of downregulated genes in Snip1Nes-KO vs. control and upregulated genes in Snip1Nes-EedNes-dKO vs. Snip1Nes-KO are compared in (k). The lists of upregulated genes in Snip1Nes-KO vs. control and downregulated genes in Snip1Nes-EedNes-dKO vs. Snip1Nes-KO are compared in (m). l, n Gene ontology of the rescued genes corresponding to Fig. 6k, m. Genes were searched against Molecular Signatures Database (MSigDB) Hallmark 2020 using Enrichr. Source data are provided in a Source Data file (c, e, g, i, l, n).

References

    1. Sommer L, Rao M. Neural stem cells and regulation of cell number. Prog. Neurobiol. 2002;66:1–18. - PubMed
    1. Bieberich E, MacKinnon S, Silva J, Yu RK. Regulation of apoptosis during neuronal differentiation by ceramide and b-series complex gangliosides. J. Biol. Chem. 2001;276:44396–44404. - PubMed
    1. Blaschke AJ, Staley K, Chun J. Widespread programmed cell death in proliferative and postmitotic regions of the fetal cerebral cortex. Development. 1996;122:1165–1174. - PubMed
    1. Thomaidou D, Mione MC, Cavanagh JF, Parnavelas JG. Apoptosis and its relation to the cell cycle in the developing cerebral cortex. J. Neurosci. 1997;17:1075–1085. - PMC - PubMed
    1. Michel N, et al. Transcription-associated DNA DSBs activate p53 during hiPSC-based neurogenesis. Sci. Rep. 2022;12:12156. - PMC - PubMed

Publication types

Substances