. 2023 Aug 8;8(1):19.
doi: 10.1038/s41525-023-00359-8.

T-cell priming transcriptomic markers: implications of immunome heterogeneity for precision immunotherapy

Affiliations

T-cell priming transcriptomic markers: implications of immunome heterogeneity for precision immunotherapy

Hirotaka Miyashita et al. NPJ Genom Med. .

Abstract

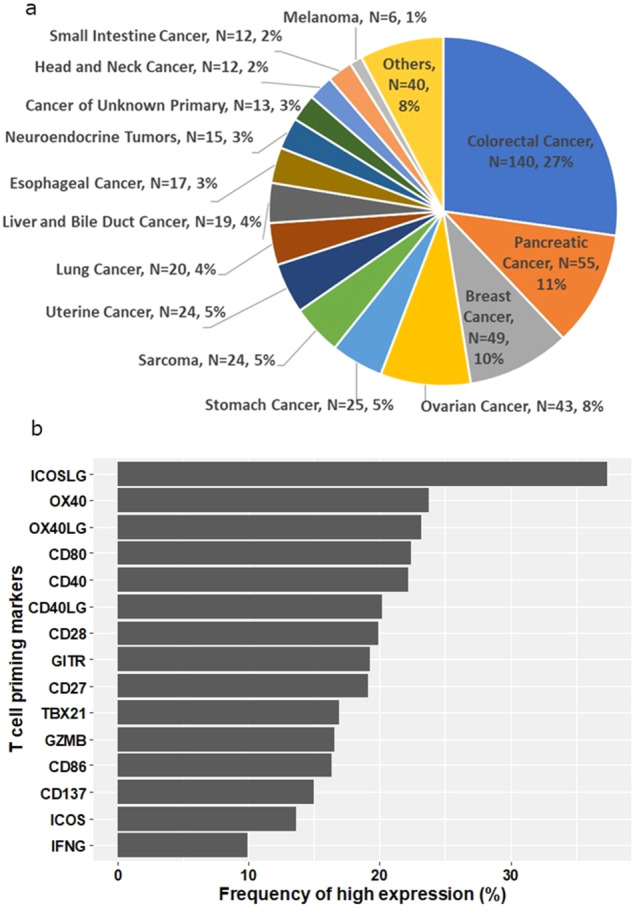
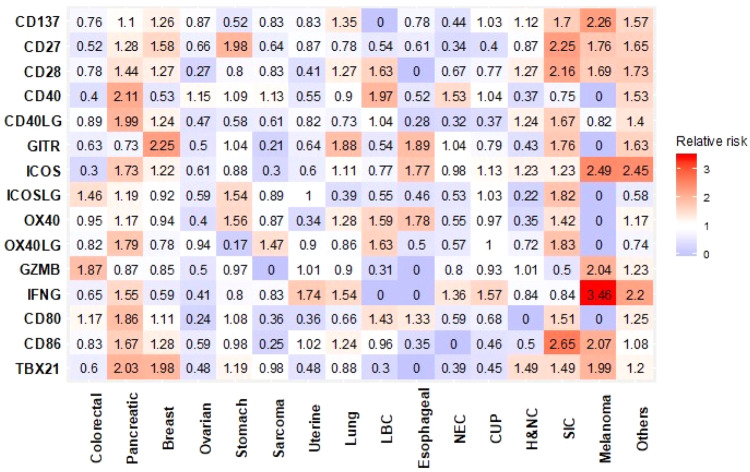
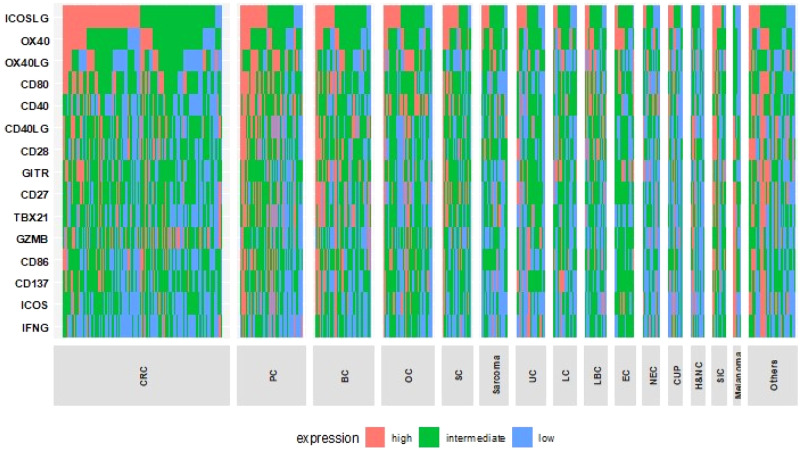
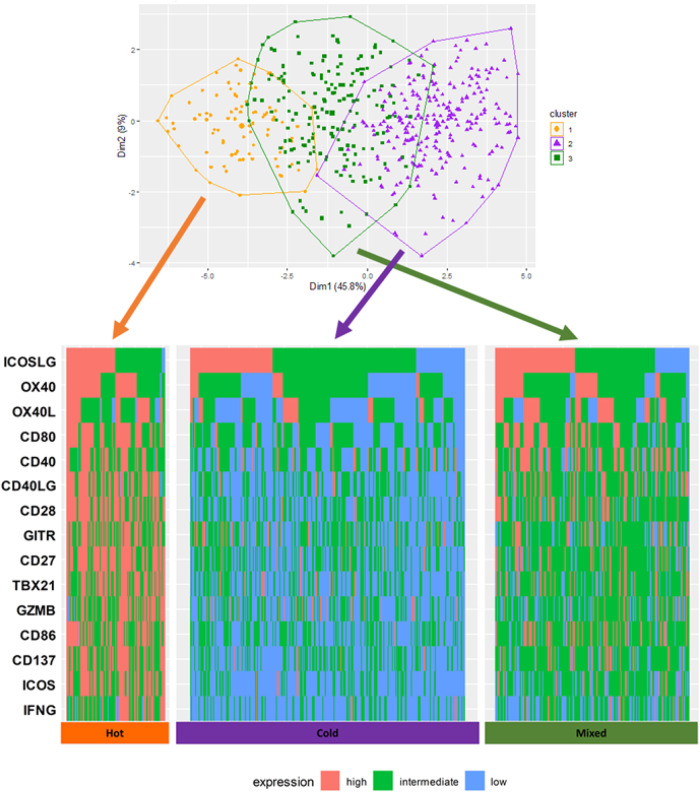
Immune checkpoint blockade is effective for only a subset of cancers. Targeting T-cell priming markers (TPMs) may enhance activity, but proper application of these agents in the clinic is challenging due to immune complexity and heterogeneity. We interrogated transcriptomics of 15 TPMs (CD137, CD27, CD28, CD80, CD86, CD40, CD40LG, GITR, ICOS, ICOSLG, OX40, OX40LG, GZMB, IFNG, and TBX21) in a pan-cancer cohort (N = 514 patients, 30 types of cancer). TPM expression was analyzed for correlation with histological type, microsatellite instability high (MSI-H), tumor mutational burden (TMB), and programmed death-ligand 1 (PD-L1) expression. Among 514 patients, the most common histological types were colorectal (27%), pancreatic (11%), and breast cancer (10%). No statistically significant association between histological type and TPM expression was seen. In contrast, expression of GZMB (granzyme B, a serine protease stored in activated T and NK cells that induces cancer cell apoptosis) and IFNG (activates cytotoxic T cells) were significantly higher in tumors with MSI-H, TMB ≥ 10 mutations/mb and PD-L1 ≥ 1%. PD-L1 ≥ 1% was also associated with significantly higher CD137, GITR, and ICOS expression. Patients' tumors were classified into "Hot", "Mixed", or "Cold" clusters based on TPM expression using hierarchical clustering. The cold cluster showed a significantly lower proportion of tumors with PD-L1 ≥ 1%. Overall, 502 patients (98%) had individually distinct patterns of TPM expression. Diverse expression patterns of TPMs independent of histological type but correlating with other immunotherapy biomarkers (PD-L1 ≥ 1%, MSI-H and TMB ≥ 10 mutations/mb) were observed. Individualized selection of patients based on TPM immunomic profiles may potentially help with immunotherapy optimization.


Conflict of interest statement

H.M. declares no competing interest. R.K. has received research funding from Biological Dynamics, Boehringer Ingelheim, Debiopharm, Foundation Medicine, Genentech, Grifols, Guardant, Incyte, Konica Minolta, Medimmune, Merck Serono, Omniseq, Pfizer, Sequenom, Takeda, and TopAlliance; as well as consultant and/or speaker fees and/or advisory board for Actuate Therapeutics, AstraZeneca, Bicara Therapeutics, Biological Dynamics, EISAI, EOM Pharmaceuticals, Iylon, Merck, NeoGenomics, Neomed, Pfizer, Prosperdtx, Roche, TD2/Volastra, Turning Point Therapeutics, X-Biotech; has an equity interest in CureMatch Inc., CureMetrix, and IDbyDNA; serves on the Board of CureMatch and CureMetrix, and is a co-founder of CureMatch. N.J.B. declares no competing interest. K.T. declares no competing interest. S.L. declares no competing interest. S.P., M.N., S.T.G., J.M.C. and P.DeP. hold stock in OmniSeq, Inc. E.R. declares no competing interest. J.K.S. receives research funding from Amgen Pharmaceuticals and Foundation Medicine, consultant fees from Deciphera, speaker’s fees from Deciphera, Foundation Medicine, La-Hoffman Roche, Merck, MJH Life Sciences, QED Therapeutics, and has stock in Personalis. S.K. serves as a consultant for Foundation Medicine, NeoGenomics and CureMatch. He receives speaker’s fee from Roche and advisory board for Pfizer. He has research funding from ACT Genomics, Sysmex, Konica Minolta and OmniSeq.

Figures

Fig. 1
Fig. 1. Baseline characteristics of the cohort (N = 514).
a Pie chart of cancer types in the cohort (N = 514). Others include: cervical cancer (N = 5), bladder cancer (N = 4), gallbladder and extrahepatic bile duct cancers (N = 4), prostate cancer (N = 4), brain and nervous system cancers (N = 3), kidney and renal pelvis cancers (N = 3), squamous cell carcinoma of the skin (N = 3), thyroid cancer (N = 3), adrenal gland cancer (N = 3), lipomatous neoplasm (N = 2), mesothelioma (N = 2), basal cell carcinoma of the skin (N = 1), ocular melanoma (N = 1), primary peritoneal carcinoma (N = 1), and thymic cancer (N = 1). b Frequency of patients with high expression of T cell priming markers (N = 514). Horizontal axis represents the percentage of patients with high expression of each T cell priming marker. Transcript abundance was normalized to internal housekeeping gene profiles and ranked (0–100) to standardized values by comparing to a reference population of 735 tumors spanning 35 histologies. The expression profiles were stratified by rank values into “Low” (0–24), “Intermediate” (25–74), and “High” (75–100). See Methods as well.
Fig. 2
Fig. 2. Relative risk of having high RNA expression of T cell priming markers among different types of cancer (N = 514).
Relative risk compared with all other types of cancer is demonstrated. Red represents higher risk and blue represents lower risk of having high RNA expression. After Bonferroni correction, no significant differences were detected between cancers. Significant p value was defined as 0.0002 (0.05/240 variables from T-cell priming markers) or less after Bonferroni correction. P values were calculated with chi square test. Others include: cervical cancer (N = 5), bladder cancer (N = 4), gallbladder and extrahepatic bile duct cancers (N = 4), prostate cancer (N = 4), brain and nervous system cancers (N = 3), kidney and renal pelvis cancers (N = 3), squamous cell carcinoma of the skin (N = 3), thyroid cancer (N = 3), adrenal gland cancer (N = 3), lipomatous neoplasm (N = 2), mesothelioma (N = 2), basal cell carcinoma of the skin (N = 1), ocular melanoma (N = 1), primary peritoneal carcinoma (N = 1), and thymic cancer (N = 1). CUP cancer of unknown primary, H&NC head and neck cancer, LBC liver and bile duct cancer, NEC neuroendocrine cancer, SIC small intestine cancer.
Fig. 3
Fig. 3. Expression profile of T-cell priming markers in various types of cancer (N = 514).
Transcript abundance was normalized to internal housekeeping gene profiles and ranked (0–100) to standardized values by comparing to a reference population of 735 tumors spanning 35 histologies. This figure shows no pattern of expression that can be differentiated by tumor type. The expression profiles were stratified by rank values into “Low” (0–24), “Intermediate” (25–74), and “High” (75–100). See Methods as well. Colorectal (N = 140), pancreatic (N = 55), breast (N = 49), ovarian (N = 43), stomach (N = 25), sarcoma (N = 24), uterine (N = 24), lung (N = 20), liver and bile Duct (N = 19), esophageal (N = 17), neuroendocrine (N = 15), cancer of unknown primary (N = 13), head and neck (N = 12), small intentine cancer (N = 12), Melanoma (N = 6). Others include: cervical cancer (N = 5), bladder cancer (N = 4), gallbladder and extrahepatic bile duct cancers (N = 4), prostate cancer (N = 4), brain and nervous system cancers (N = 3), kidney and renal pelvis cancers (N = 3), squamous cell carcinoma of the skin (N = 3), thyroid cancer (N = 3), adrenal gland cancer (N = 3), lipomatous neoplasm (N = 2), mesothelioma (N = 2), basal cell carcinoma of the skin (N = 1), ocular melanoma (N = 1), primary peritoneal carcinoma (N = 1), and thymic cancer (N = 1). Each column represents a patient. red, green, and blue means high, intermediate and low expression respectively. BC breast cancer, CRC colorectal cancer, CUP cancer of unknown primary, H&NC head and neck cancer, LBC liver and bile duct cancer, LC lung cancer, NEC neuroendocrine cancer, OC ovarian cancer, PC pancreatic cancer, SC stomach cancer, SIC small intestine cancer, UC uterine cancer.
Fig. 4
Fig. 4. Cluster plot based on T-cell priming marker expression by Ward’s method (N = 514).
Principal component analysis was performed and the data points according to the first two principal components that explain the majority of the variance was plotted. Briefly, dimension 1 (Dim 1) represents the value on the vector in the 15-dimensional field, which accounts for the largest possible variance, and it accounts for 45.8% of all variance of the 15 different T-cell priming gene expression in 514 samples. Dimension 2 (Dim 2) is the value on the vector that accounts the second largest possible variance. Dim 2 explains 9% of total variance in the dataset. Ward’s method is a hierarchical clustering method to assign the data points to preset number of clusters to minimize the within-cluster variance. In this analysis, patients were clustered into three clusters. Orange, purple and dark green dots represent the patients classified into cluster 1, 2, and 3, respectively. Hot cluster is one of the three clusters identified by Ward’s hierarchical clustering, which has characteristics of generally high expressions of T-cell priming markers. Cold cluster is one of the three clusters identified by Ward’s hierarchical clustering, which has characteristics of generally low expressions of T-cell priming markers. Mixed cluster is one of the three clusters identified by Ward’s hierarchical clustering, which has characteristics of mixed expression levels of T-cell priming markers. Transcript abundance was normalized to internal housekeeping gene profiles and ranked (0–100) to standardization by an internal reference population of 735 tumors spanning 35 histologies. The expression profiles were stratified by rank values into “Low” (0–24), “Intermediate” (25–74), and “High” (75–100). See Methods as well. Each column represents each patient. Red, green, and blue means high, intermediate, and low expression respectively. According to the silhouette method based on T-cell priming marker RNA expression, the optimal number of clusters in this dataset was three: Hot” (cluster 1, with high expression of most T-cell priming markers, N = 78), “Cold” (cluster 2, with low expression of most T-cell priming markers, N = 210) and “Mixed” (cluster 3, anything not classified into “Hot” or “Cold”, N = 137).

References

    1. Summers J, Cohen MH, Keegan P, Pazdur R. FDA Drug Approval Summary: Bevacizumab plus Interferon for Advanced Renal Cell Carcinoma. Oncologist. 2010;15:104–111. - PMC - PubMed
    1. Atkins MB, et al. High-dose recombinant interleukin 2 therapy for patients with metastatic melanoma: Analysis of 270 patients treated between 1985 and 1993. J. Clin. Oncol. 1999;17:2105–2116. - PubMed
    1. Hodi FS, et al. Improved Survival with Ipilimumab in Patients with Metastatic Melanoma. N. Engl. J. Med. 2010;363:711–723. - PMC - PubMed
    1. Robert C, et al. Pembrolizumab versus ipilimumab in advanced melanoma. N. Engl. J. Med. 2015;372:2521–2532. - PubMed
    1. Powles T, et al. Atezolizumab versus chemotherapy in patients with platinum-treated locally advanced or metastatic urothelial carcinoma (IMvigor211): a multicentre, open-label, phase 3 randomised controlled trial. Lancet. 2018;391:748–757. - PubMed