. 2023 Aug 8;14(1):4789.
doi: 10.1038/s41467-023-40430-7.

Intradermal but not intramuscular modified vaccinia Ankara immunizations protect against intravaginal tier2 simian-human immunodeficiency virus challenges in female macaques

Affiliations

Intradermal but not intramuscular modified vaccinia Ankara immunizations protect against intravaginal tier2 simian-human immunodeficiency virus challenges in female macaques

Venkata S Bollimpelli et al. Nat Commun. .

Abstract

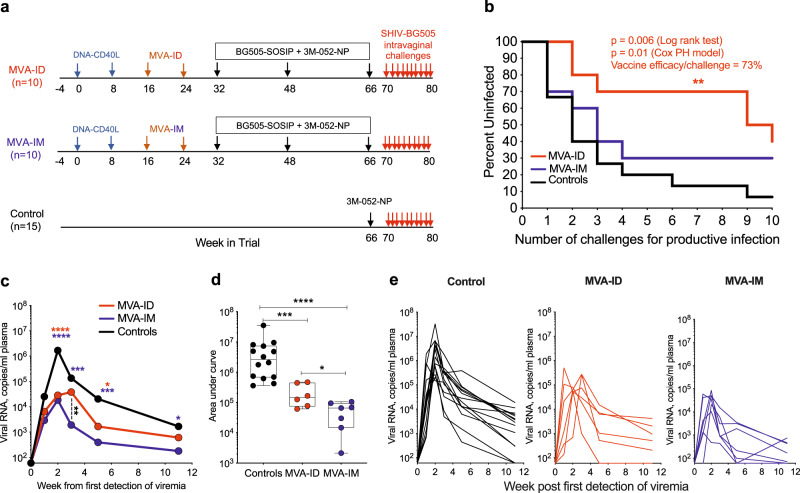
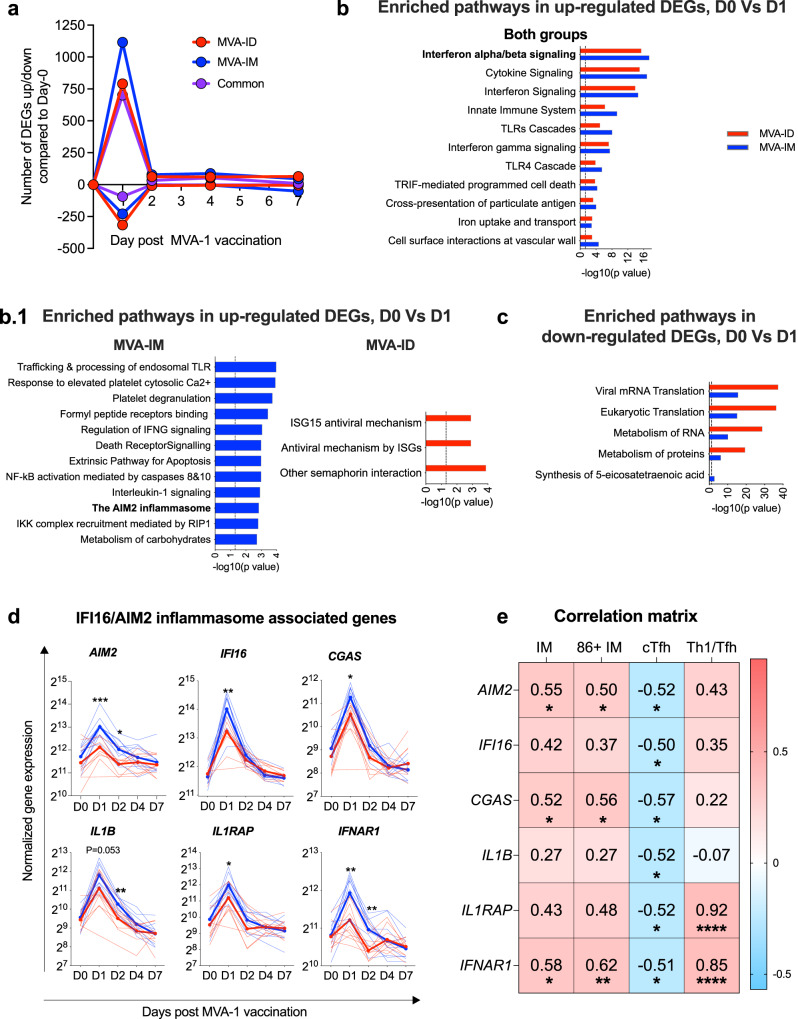
Route of immunization can markedly influence the quality of immune response. Here, we show that intradermal (ID) but not intramuscular (IM) modified vaccinia Ankara (MVA) vaccinations provide protection from acquisition of intravaginal tier2 simian-human immunodeficiency virus (SHIV) challenges in female macaques. Both routes of vaccination induce comparable levels of serum IgG with neutralizing and non-neutralizing activities. The protection in MVA-ID group correlates positively with serum neutralizing and antibody-dependent phagocytic activities, and envelope-specific vaginal IgA; while the limited protection in MVA-IM group correlates only with serum neutralizing activity. MVA-ID immunizations induce greater germinal center Tfh and B cell responses, reduced the ratio of Th1 to Tfh cells in blood and showed lower activation of intermediate monocytes and inflammasome compared to MVA-IM immunizations. This lower innate activation correlates negatively with induction of Tfh responses. These data demonstrate that the MVA-ID vaccinations protect against intravaginal SHIV challenges by modulating the innate and T helper responses.


Conflict of interest statement

Rama Amara is a co-inventor of the DNA/MVA vaccine technology that has been licensed to Geovax Inc., by Emory University. The remaining authors declare no competing interests.

Figures

Fig. 1
Fig. 1. DNA/MVA-ID/protein vaccine shows protection against acquisition of infection on intravaginal low dose SHIV BG505 challenge.
a Schematic representation of vaccine groups and the immunization schedule. Arrows were color-coded to represent the immunogen/virus challenge and denote the time in weeks of their administration. b Kaplan–Meier survival curves representing the fraction of uninfected animals following each challenge on the y-axis (n = 10 in each vaccinated group and n = 15 in the control (adjuvant-only) group). ce Plasma viral load in infected animals post-infection. The week in which viremia was first detected was considered as Wk1. c Longitudinal viral load profile representing the geomean of all infected animals in each group. Asterisks denoting statistical significance measured by Mann–Whitney rank-sum test (two-tailed) and were color-coded for each group (red: MVA-ID; blue: MVA-IM), compared to control group, and black: MVA-ID compared to MVA-IM group; second week: red/blue: ****p < 0.0001; third week: blue: ***p = 0.0001, black: **p = 0.008; fifth week: red: *p = 0.02, blue: ***p = 0.0005; 11th week: blue: *p = 0.018. d Area under the curve of longitudinal viral load in infected animals, compared between the groups; box in the plot extends from the 25th percentile to the 75th percentile of the dataset and the line inside the box denotes the median. The whiskers descend to the dataset’s minimum values and ascend to the maximum values; Asterisks in viral load data, denote statistically significant differences between the groups at the given time point, measured by Mann–Whitney rank-sum test (two-tailed) (****p < 0.0001, ***p = 0.0006, *p = 0.035). e Longitudinal viral load profile of each infected animal. Infected animals in control group: n = 14, MVA-ID group: n = 6, MVA-IM group: n = 7. Source data are provided as a Source Data file.
Fig. 2
Fig. 2. MVA-ID vaccinated animals show different correlates of protection compared to MVA-IM vaccinated animals.
a BG505_SOSIP-specific IgG in serum. Statistical significance by Mann–Whitney rank-sum (two-tailed) test. b, c BG505_SOSIP-specific IgG and IgA in vaginal secretions; Vaginal IgG: (MVA-ID: n = 9 at MVA-1 and n = 10 at rest of the time points; MVA-IM: n = 10 at all time points); Vaginal IgA: (MVA-ID: n = 9 at MVA-1 and Prt-2 time ponts and n = 10 at rest of the time points; MVA-IM: n = 10 at all time points). Statistical significance by Mann–Whitney rank-sum (two-tailed) test. d Neutralization antibody ID50 titers against BG505.T332N Env pseudovirus in serum. e Spearman’s correlation (two-sided) between neutralizing antibody titers and rate of virus acquisition. The dotted line represents the neutralization titer at 50. f, g Kaplan–Meier survival curves in MVA-ID and MVA-IM groups with f high neutralizing antibody titer and g low-neutralizing antibody titer, compared to control animals. Statistical significance by log-rank test. h Serum antibody effector functions compared between MVA-ID and MVA-IM groups. Left to right: ADCVI inhibition, ADCC activity, ADP score. i Vaginal IgA and j serum ADP score in protected and infected animals within a group and compared between both vaccinated groups. Statistical significance by Mann–Whitney rank-sum (two-tailed) test; n = 4 in MVA-ID protected; n = 6 in MVA-ID infected; n = 3 in MVA-IM protected; n = 7 MVA-IM infected. Spearman’s correlation (two-sided) between rate of virus acquisition and k) anti-BG505 SOSIP vaginal IgA, l serum ADP score. In all the correlation plots, p and r values are color-coded to represent the vaccine group (red: MVA-ID, Blue: MVA-IM, Black: both groups combined). These values were not shown for the group that did not have a statistically significant p value <0.05. Boxes in all the box plots extend from the 25th percentile to the 75th percentile of the dataset and the line inside the box denotes the median. The whiskers outside the box descend to the dataset’s minimum values and ascend to the maximum values. MVA-1: first MVA; MVA-2: second MVA; Prt-1: first protein; Prt-2: second protein; Prt-3: third protein, UI uninfected. Source data are provided as a Source Data file.
Fig. 3
Fig. 3. T cell response post-MVA immunization.
a Germinal center Tfh response (CXCR5++PD1++) (at MVA-1**p = 0.008, at MVA-2 *p = 0.031) and b germinal center B-cell response (BCL6 + Ki67+) (**p = 0.008) measured on CD4 + T cells and CD20 + B cells respectively in FNAs processed draining inguinal lymph node. The shaded area represents the range of germinal center responses at pre-vaccination time points from MVA-ID animals. Data were not available for the MVA-IM group. Left: representative flow-cytometer plots post-MVA immunization. c Circulating non-Tfh response (CXCR5-Ki67+) and Tfh response (CXCR5 + Ki67+) (***p = 0.0007) measured on blood CD4 + T cells (frozen PBMC) post-MVA-1 immunization. Left: representative flow-cytometer plots. d Th1(CXCR5- CXCR3+) /Tfh(CXCR5 + CXCR3-) in blood Ki67 + CD4 + T cells (frozen PBMC) (*p = 0.034). Left: Representative flow cytometer plots. Asterisks in all the above data, denote statistically significant differences measured by Mann–Whitney rank-sum (two-tailed). e Total SHIV BG505 (Gag + Env) specific IFN-γ + CD4 T cell responses and CD8 T cell responses measured in blood. Boxes in all the box plots extend from the 25th percentile to the 75th percentile of the dataset and the line inside the box denotes the median. The whiskers outside the box descend to the dataset’s minimum values and ascend to the maximum values. f Kaplan–Meier curves in animals with low and high frequencies of total SHIV BG505 (Gag + Env) specific IFN-γ + CD4 T cells (all vaccinated animals included and stratified as low and high, based on the median frequency as cut off) post-MVA-1 immunization compared with control animals. Statistical significance by log-rank test (*p = 0.028). gi Spearman’s correlation (two-sided) between Day 7 MVA-1 induced IFN-γ + CD4 T cells and g MVA-1, Day 7 Th1/Tfh ratio, h Wk68 vaginal IgA (ng anti-SOSIP IgA per µg total IgA), i Wk70, serum ADP score. In all the correlation plots, p and r values were color-coded to represent the vaccine group (red: MVA-ID, Blue: MVA-IM, Black: both groups combined). These values were not shown for the group that didn’t have a statistically significant p value <0.05. DNA-1: first DNA; DNA-2: second DNA; MVA-1: first MVA; MVA-2: second MVA; Prt-1: first protein; Prt-2: second protein. Source data are provided as a Source Data file.
Fig. 4
Fig. 4. Innate cell response post-MVA-1 immunization.
a Flow cytometry representative plots on lineage-HLADR+ cells indicating different monocyte subsets: classical monocytes (CD14 + CD16−); intermediate monocytes (CD14 + CD16+); non-classical monocytes (CD14− CD16+); dendritic cells (CD14−CD16−) at indicated time points post-MVA-1 immunization. b, c Frequencies of monocyte subsets, dendritic cells. b (classical monocytes: D7:black*p = 0.015, D1:blue**p = 0.003, D2:blue**p = 0.009; intermediate monocytes: D1:black**p = 0.007, D2 black*p = 0.05, D1:red**p = 0.003, D2: red*p = 0.031, D1:blue**p = 0.002, D2:blue**p = 0.009, D4:blue**p = 0.009, D7:blue**p = 0.003; non-classical monocytes: D4:black*p = 0.037, D2:blue*p = 0.048; total dendritic cells D7:black*p = 0.028, D7:red**p = 0.003, D7:blue**p = 0.002) and frequencies of activated (CD86+) monocyte subsets c (classical monocytes: D0:black*p = 0.045, D4:black*p = 0.014, D7:black**p = 0.002, D1:blue**p = 0.003, D2:blue**p = 0.009; intermediate monocytes: D1:black*p = 0.022, D2 black*p = 0.017, D1:red**p = 0.003, D1:blue**p = 0.002, D2:blue*p = 0.013, D4:blue*p = 0.013, D7:blue**p = 0.003; non-classical monocytes: D1:black*p = 0.017, D2:blue**p = 0.002) at indicated time points post-MVA-1 immunization. Geomeans of all animals in respective groups were represented as bright lines and all individual animals were represented as faded lines. Groups were color-coded: MVA-ID – Red; MVA-IM – Blue. Asterisks were color-coded (MVA-ID – Red, MVA-IM – Blue) representing the vaccine groups and denote statistical significance in comparison to their respective Day 0 values, measured by Wilcoxon matched paired t (two-tailed) test. Black asterisks in all the above data denote statistically significant differences between the groups at the given time point, measured by Mann–Whitney rank-sum test (two-tailed). dF Spearman correlations (two-sided) between frequencies of Day 1 CD86+ activated intermediate monocytes and Day 7 d circulating Tfh, E Th1/Tfh ratio, f IFN- γ + CD4 T cells post-MVA-1 immunization. MVA-1: first MVA. Source data are provided as a Source Data file.
Fig. 5
Fig. 5. RNA sequence analysis in blood, post-MVA-1 immunization.
a Line graphs showing the number of DEGs in both the groups at indicated time points, when compared to their expression on Day 0 of MVA-1 immunization. The cutoff criteria was defined as log2fold change ≥1 or ≤−1 and p value ≤0.05. A multiple-test correction was performed with the Benjamini–Hochberg method and a false-discovery rate <0.05. The lines were color-coded, representing groups (Red: MVA-ID, Blue: MVA-IM, Purple: number of genes that are up/down-regulated in both the groups). b, c Enriched reactome pathways associated with DEGs at Day 1, post-MVA-1 immunization, using online tool network analyst (networkanalyst.ca). The cutoff criteria used was p value <0.05 and FDR <0.1. P values are not adjusted for multiple comparisons. Bars were color-coded representing respective vaccine groups (MVA-ID – Red, MVA-IM – Blue), b pathway enrichment from upregulated DEGs, and c pathway enrichment from downregulated DEGs. d Longitudinal normalized gene expression of selected key genes along AIM2/IFI16 inflammasome pathway at Day 0, 1, 2, 4, and 7 post-MVA-1 immunizations. The bright color-coded lines represent the geometrical mean of the corresponding groups and light color-coded lines in the background represent individual animals in the corresponding groups. Asterisks denote statistically significant differences between the groups at a given time point, measured by Mann–Whitney rank-sum (two-tailed) test (AIM2: D1:***p = 0.0004, D2:*p = 0.02; IFI16: D1:**p = 0.003; CGAS: D1:*p = 0.01; IL1B: D2: **p = 0.0021; IL1RAP: D1:*p = 0.035; IFNAR1: D1:**p = 0.0057, D2:**p = 0.0044). e Correlation matrix with genes along AIM2/IFI16 inflammasome pathway as variables on the y-axis and circulating Tfh, Th1/Tfh ratio, frequencies of intermediate monocytes (IM), and frequencies of activated intermediate monocytes (86 + IM) as variables on the x-axis. The positive correlation between the variables was denoted by a gradient of red color and the negative correlation between the variables was denoted by a gradient of blue color. In all the correlations included in the matrix, r and p values were included in the respective matrix box. Asterisks denote statistical significance from a spearman correlation (two-sided)(AIM2 Vs IM *p = 0.017, 86 + IM*p = 0.033, cTfh*p = 0.027; IFI16 Vs cTfh*p = 0.035; cGAS Vs IM *p = 0.025, 86 + IM*p = 0.015, cTfh*p = 0.013; IL1B Vs cTfh *p = 0.026; IL1RAP Vs cTFh*p = 0.027, Th1/Tfh****p < 0.0001; IFNAR1 Vs IM*p = 0.011, 86 + IM**p = 0.006, cTfh*p = 0.031, Th1/Tfh****p < 0.0001). MVA-1: first MVA. Source data are provided as a Source Data file.
Fig. 6
Fig. 6. MVA-induced innate response and its effect on shaping the adaptive immune response.
MVA immunization-induced inflammasome-mediated innate activation was higher in the MVA-IM group and lower in the MVA-ID group. The higher innate activation leads to high Th1, low Tfh and a high Th1/Tfh ratio. The migration of these higher numbers of Th1 cells to mucosal tissues could potentially lead to more number of target cells for SHIV infection. Lower innate activation leads to high Tfh, low Th1 and low Th1/Tfh. These higher Tfh cells provide greater B cell help. Low Th1 and low Th1/Tfh were associated with higher vaginal IgA and higher serum ADP activity, which, in turn, were associated with better protection. Solid arrows represent observed associations and dotted arrows represent predicted associations.

References

    1. Pauthner M, et al. Elicitation of robust tier 2 neutralizing antibody responses in nonhuman primates by HIV envelope trimer immunization using optimized approaches. Immunity. 2017;46:1073–1088.e1076. - PMC - PubMed
    1. Pauthner MG, et al. Vaccine-induced protection from homologous tier 2 SHIV challenge in nonhuman primates depends on serum-neutralizing antibody titers. Immunity. 2019;50:241–252.e246. - PMC - PubMed
    1. Sanders RW, Moore JP. Native-like Env trimers as a platform for HIV-1 vaccine design. Immunol. Rev. 2017;275:161–182. - PMC - PubMed
    1. Feng Y, et al. Thermostability of well-ordered HIV spikes correlates with the elicitation of autologous tier 2 neutralizing antibodies. PLoS Pathog. 2016;12:e1005767. - PMC - PubMed
    1. Arunachalam, P. S. et al. T cell-inducing vaccine durably prevents mucosal SHIV infection even with lower neutralizing antibody titers. Nat. Med. 26, 932–940 (2020). - PMC - PubMed

Publication types

Substances