. 2023 Aug 8;10(1):531.
doi: 10.1038/s41597-023-02416-4.

MedalCare-XL: 16,900 healthy and pathological synthetic 12 lead ECGs from electrophysiological simulations

Affiliations

MedalCare-XL: 16,900 healthy and pathological synthetic 12 lead ECGs from electrophysiological simulations

Karli Gillette et al. Sci Data. .

Abstract

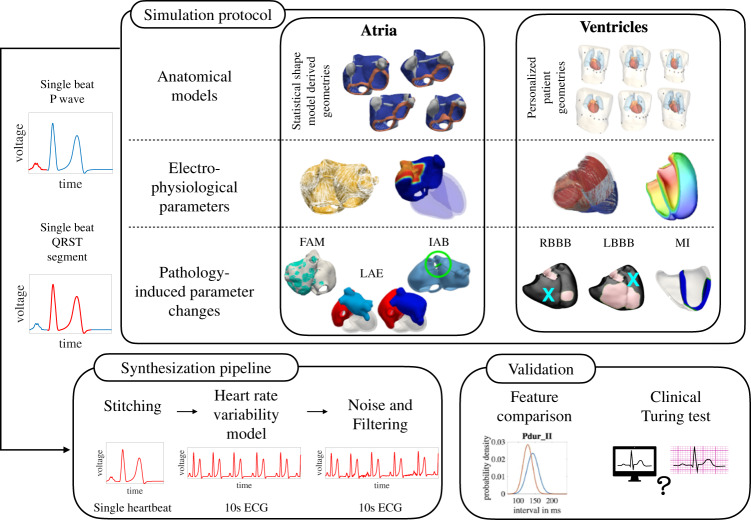
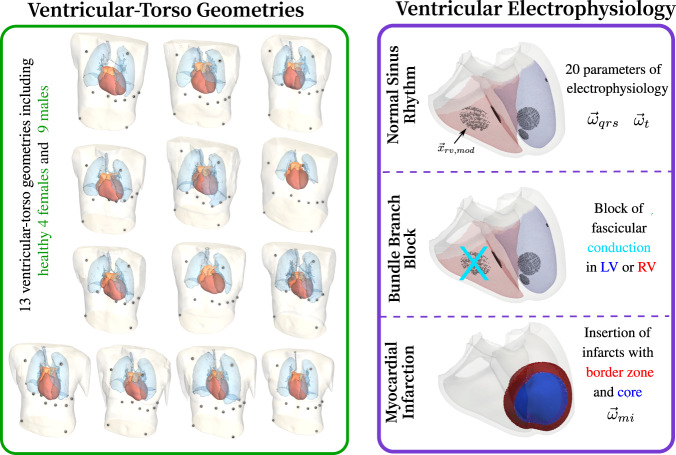
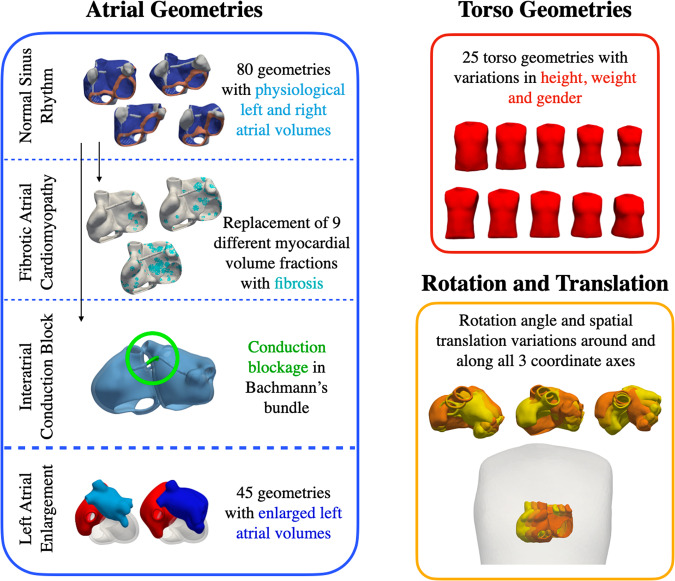
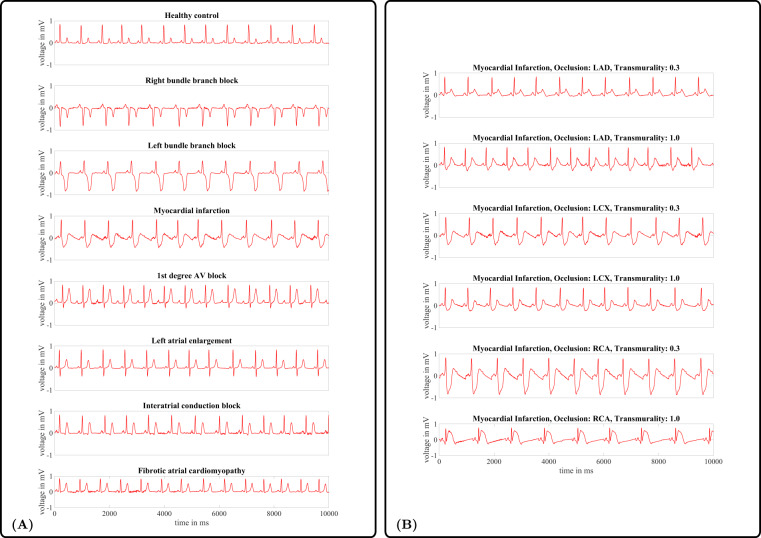
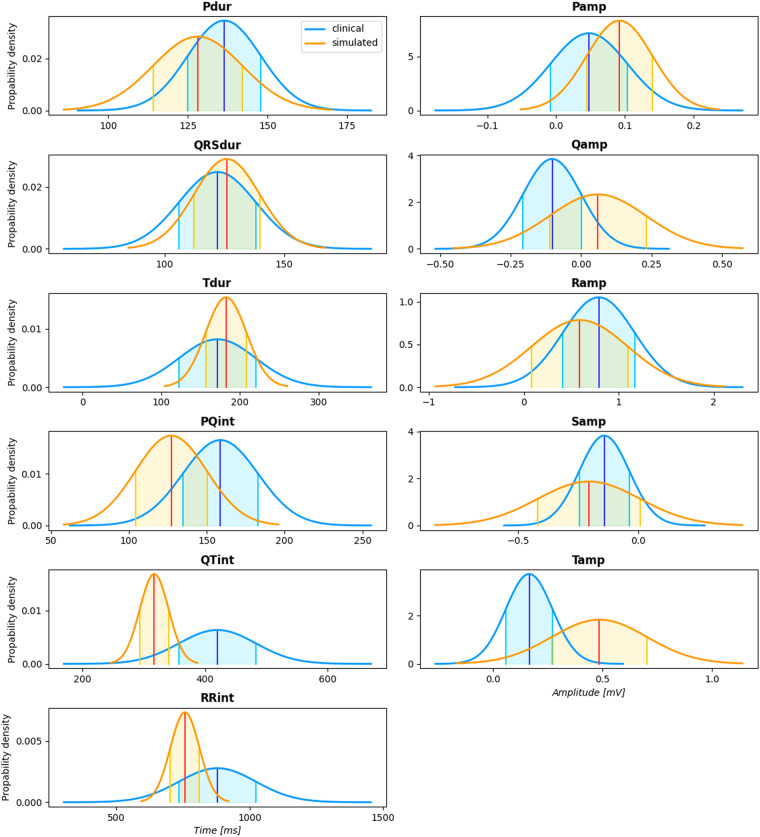
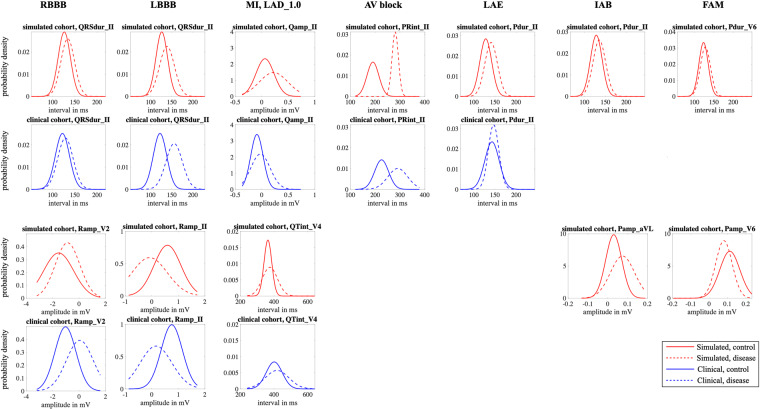
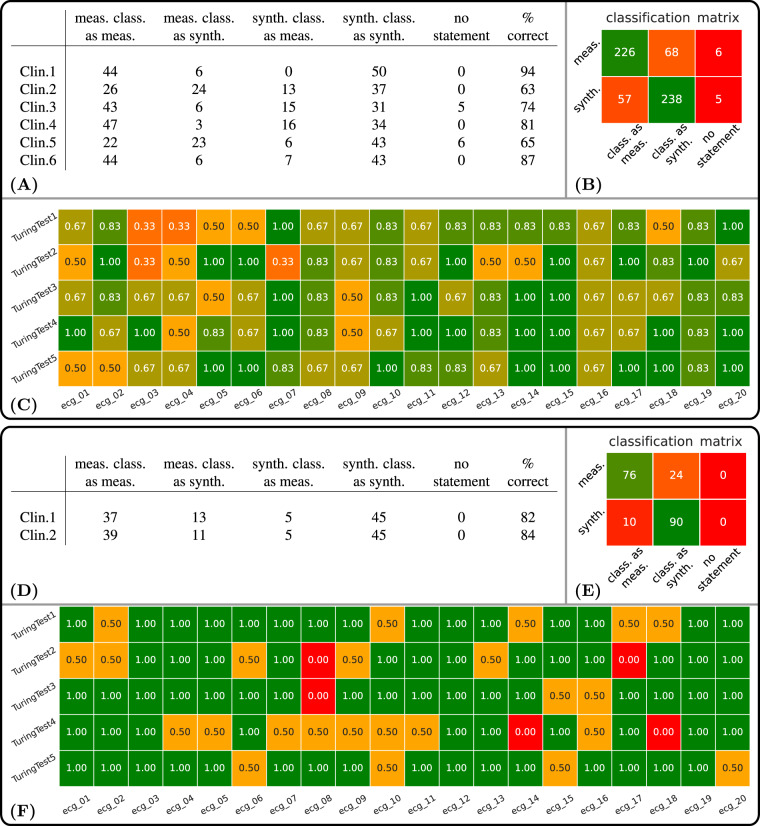
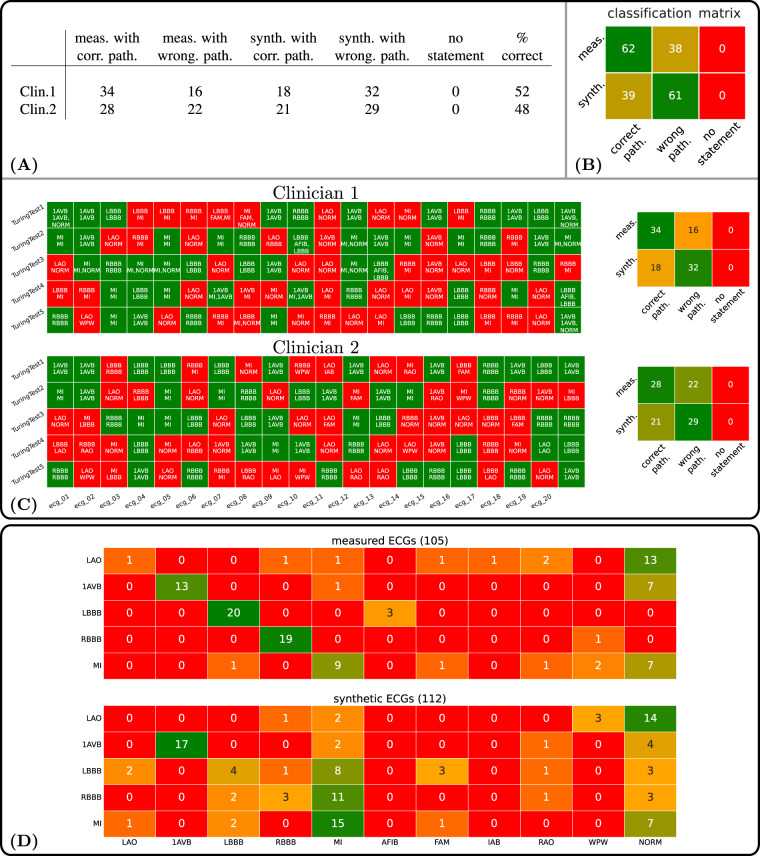
Mechanistic cardiac electrophysiology models allow for personalized simulations of the electrical activity in the heart and the ensuing electrocardiogram (ECG) on the body surface. As such, synthetic signals possess known ground truth labels of the underlying disease and can be employed for validation of machine learning ECG analysis tools in addition to clinical signals. Recently, synthetic ECGs were used to enrich sparse clinical data or even replace them completely during training leading to improved performance on real-world clinical test data. We thus generated a novel synthetic database comprising a total of 16,900 12 lead ECGs based on electrophysiological simulations equally distributed into healthy control and 7 pathology classes. The pathological case of myocardial infraction had 6 sub-classes. A comparison of extracted features between the virtual cohort and a publicly available clinical ECG database demonstrated that the synthetic signals represent clinical ECGs for healthy and pathological subpopulations with high fidelity. The ECG database is split into training, validation, and test folds for development and objective assessment of novel machine learning algorithms.


Conflict of interest statement

The authors declare no competing interests.

Figures

Fig. 1
Fig. 1
Pipeline for the generation and validation of the synthetic 12 lead ECG database using individual multi-scale models of the atria and the ventricles.
Fig. 2
Fig. 2
Cohort of ventricular-torso models derived from clinical MRIs. Tissues include lungs, blood pools, atrial tissue, ventricles, and general torso. Parameters dictating ventricular electrophysiologyfor normal healthy control were varied through physiological ranges. Disease conditions of BBB and MI were then modeled by making adaptions to the model.
Fig. 3
Fig. 3
Anatomical model cohort for atrial simulations. 80 atrial geometries with physiological left and right atrial volumes were derived from a bi-atrial statistical shape model and served as a basis for normal healthy control simulations. 9 different volume fractions of these models were additionally replaced by fibrosis for simulations of fibrotic atrial cardiomyopathy. Interatrial conduction block signals were generated by blocking conduction in Bachmann’s Bundle in the same 80 geometries. Furthermore, 45 geometries with enlarged left atrial volumes were generated. As for the torso anatomy, 25 geometries were derived from a human body statistical shape model to account for height, weight and gender differences in the virtual patient cohort. Moreover, the rotation angle as well as the spatial position of the atria inside the torso were varied in physiological ranges.
Fig. 4
Fig. 4
(A) Exemplary 10 s ECGs (lead II) of each pathology class and a normal healthy control in the virtual cohort. (B) Exemplary 10 s ECGs (lead II) of each MI pathology class for different occlusion sites and degrees of transmurality.
Fig. 5
Fig. 5
Comparison of features in the healthy clinical and virtual cohort. Probability density functions are shown for timing features (left column, from top to bottom: P wave duration, QRS duration, T wave duration, PQ interval, QTinterval, RR interval) and amplitude features (right column, from top to bottom: P wave amplitude, Q/R/S peak amplitude, T wave amplitude). Blue and red curves represent the distributions calculated based on the clinical and the simulated data, respectively. The centered vertical lines highlight the mean value μ and the filled areas indicate the interval [μ − σ, μ + σ] with standard deviation σ.
Fig. 6
Fig. 6
Comparison of features extracted from healthy (solid lines) and pathological (dotted line) ECGs in the clinical (blue curves, bottom panel) and virtual (red curve, top panel) cohorts. Probability density functions are shown for selected timing or amplitude features that are clinically evaluated for a diagnosis of the displayed disease (from left to right: RBBB, LBBB, MI, 1AVB, LAO, IAB and FAM).
Fig. 7
Fig. 7
(Type classification) Healthy cases: (A) Classification results for each of the six expert clinicians for the five Turing tests and percentage of correct assessments. In summary, 62 of 300 assessments of the synthetic ECGs and 74 of 300 assessments of the measured ECGs could not be correctly classified by the experts. (B) Type classification matrix across all 600 assessments. (C) Results of the clinical Turing tests performed by 6 clinicians. Each row corresponds to a clinical Turing test and each square belongs to one of the 20 ECGs per test. Shown is the relative number of clinicians who correctly classified the corresponding signal. Pathological cases: (D) Type classification results for each of the two expert clinicians for the five Turing tests and percentage of correct assessments. In summary, 10 of 100 assessments of the synthetic ECGs and 24 of 100 assessments of the measured ECGs could not be correctly classified by the experts. (E) Type classification matrix across all 100 assessments. (F) Results of the clinical Turing tests performed by 2 clinicians. Each row corresponds to a clinical Turing test and each square belongs to one of the 20 ECGs per test. Shown is the relative number of clinicians who correctly classified the type of the corresponding signal.
Fig. 8
Fig. 8
(Pathology classification) (A) Pathology classification results for each of the two expert clinicians for the five Turing tests and percentage of correct assessments. In summary, 61 of 100 assessments of the synthetic ECGs and 38 of 100 assessments of the measured ECGs could not be correctly classified by the experts. (B) Pathology classification matrix across all 100 assessments. (C) (Clinician-based). Shown are the classifications for both clinicians of all ECG Signals. For each ECG signal designated by a s quare, the top entries are the correct pathology and the bottom entries are the pathology actually selected by the user. Each row corresponds to a clinical Turing test and each square belongs to one of the 20 ECGs per test. (D) Confusion Matrices.

References

    1. Wagner P, et al. PTB-XL, a large publicly available electrocardiography dataset. Scientific Data. 2020;7:154. doi: 10.1038/s41597-020-0495-6. - DOI - PMC - PubMed
    1. Roberts M, et al. Common pitfalls and recommendations for using machine learning to detect and prognosticate for COVID-19 using chest radiographs and CT scans. Nature Machine Intelligence. 2021;3:199–217. doi: 10.1038/s42256-021-00307-0. - DOI
    1. Puyol-Antón, E. et al. Fairness in cardiac MR image analysis: An investigation of bias due to data imbalance in deep learning based segmentation. In de Bruijne, M. et al. (eds.) Medical Image Computing and Computer Assisted Intervention – MICCAI 2021, 413–423, 10.1007/978-3-030-87199-4_39 (Springer International Publishing, Cham, 2021).
    1. Pilia N, et al. Quantification and classification of potassium and calcium disorders with the electrocardiogram: What do clinical studies, modeling, and reconstruction tell us? APL Bioeng. 2020;4:041501. doi: 10.1063/5.0018504. - DOI - PMC - PubMed
    1. Luongo G, 2022. Hybrid machine learning to localize atrial flutter substrates using the surface 12-lead electrocardiogram. EP Europace. - DOI - PMC - PubMed

Publication types