. 2023 Aug 8;14(1):4774.
doi: 10.1038/s41467-023-40539-9.

Spying on parahydrogen-induced polarization transfer using a half-tesla benchtop MRI and hyperpolarized imaging enabled by automation

Affiliations

Spying on parahydrogen-induced polarization transfer using a half-tesla benchtop MRI and hyperpolarized imaging enabled by automation

Frowin Ellermann et al. Nat Commun. .

Abstract

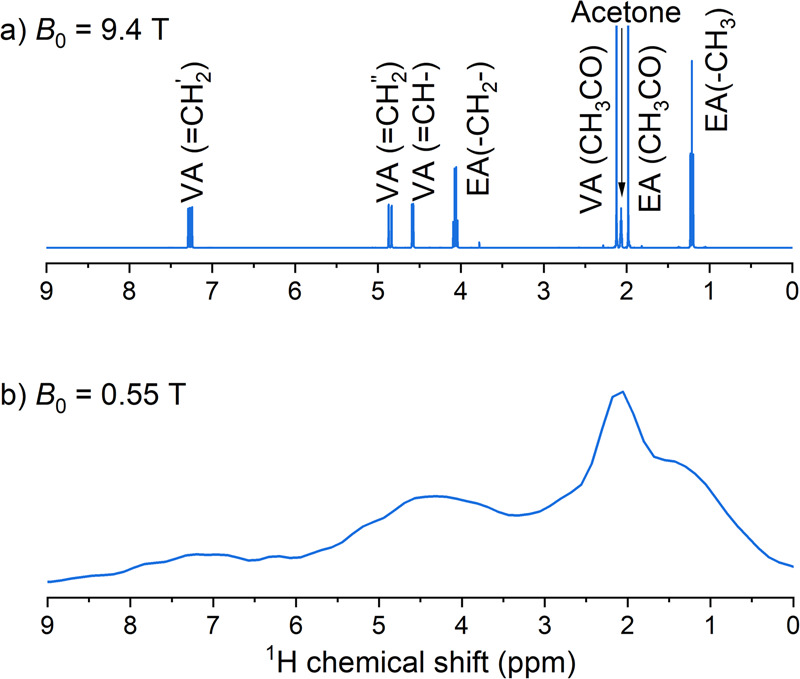
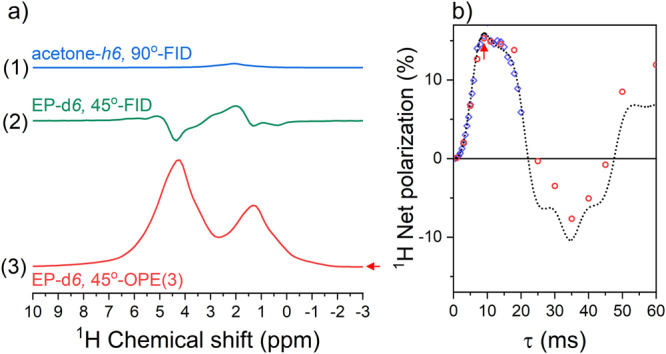
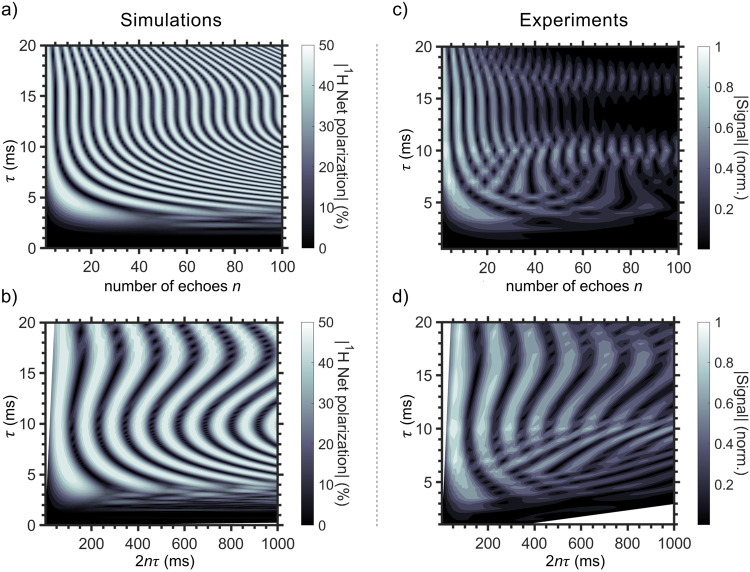
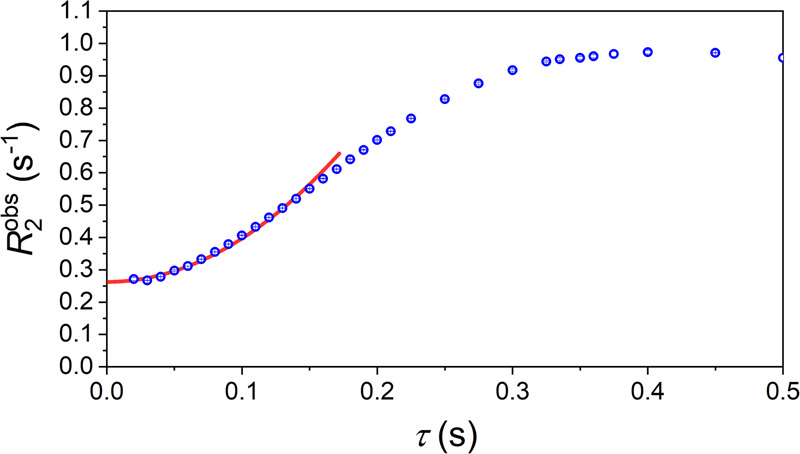
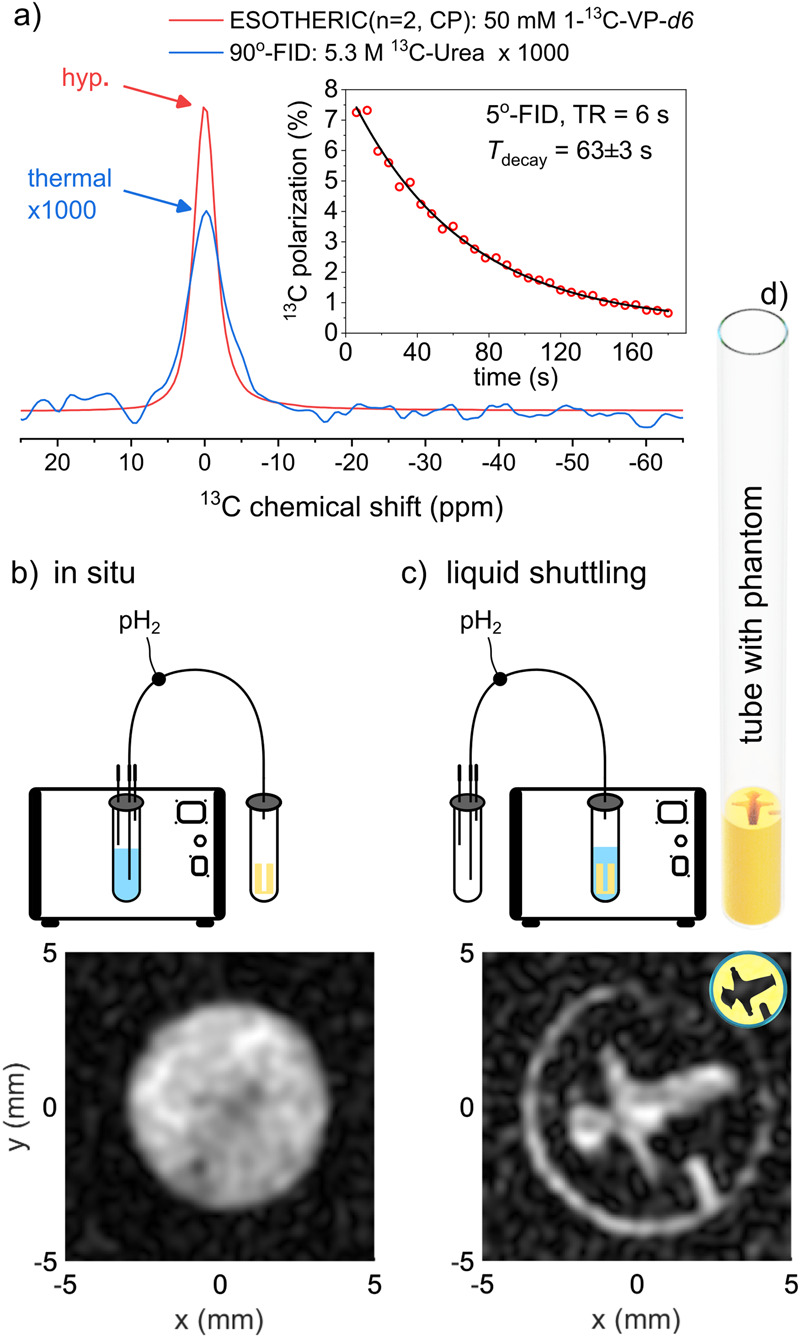
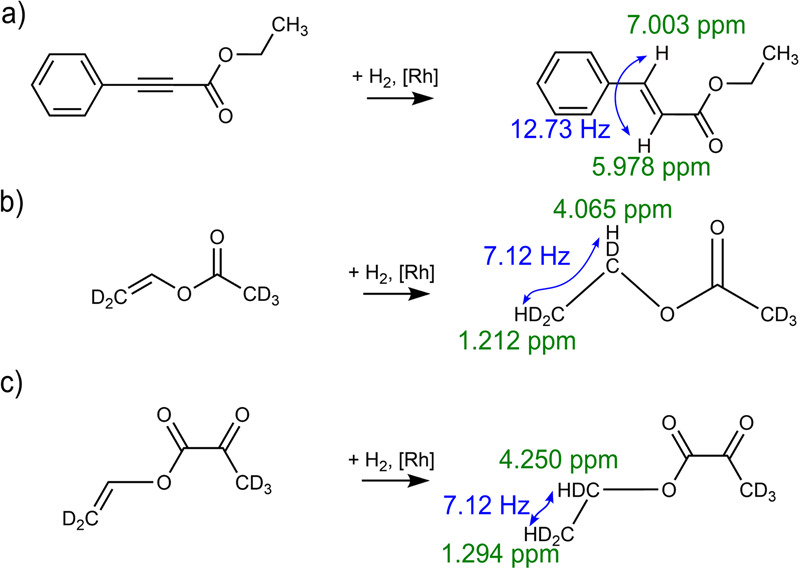
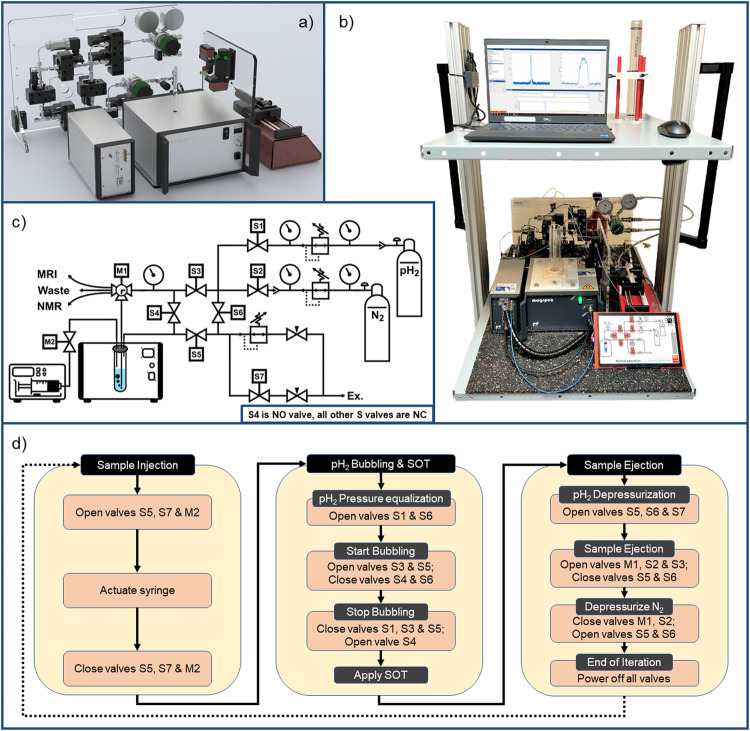
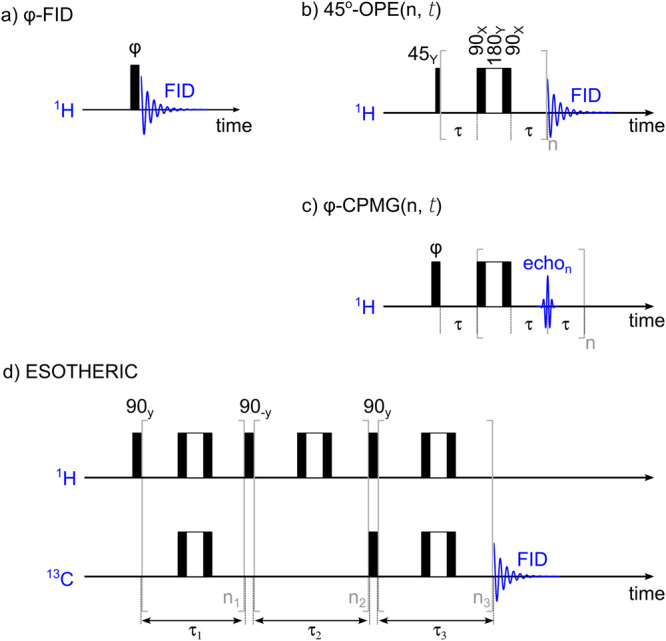
Nuclear spin hyperpolarization is a quantum effect that enhances the nuclear magnetic resonance signal by several orders of magnitude and has enabled real-time metabolic imaging in humans. However, the translation of hyperpolarization technology into routine use in laboratories and medical centers is hampered by the lack of portable, cost-effective polarizers that are not commercially available. Here, we present a portable, automated polarizer based on parahydrogen-induced hyperpolarization (PHIP) at an intermediate magnetic field of 0.5 T (achieved by permanent magnets). With a footprint of 1 m2, we demonstrate semi-continuous, fully automated 1H hyperpolarization of ethyl acetate-d6 and ethyl pyruvate-d6 to P = 14.4% and 16.2%, respectively, and a 13C polarization of 1-13C-ethyl pyruvate-d6 of P = 7%. The duty cycle for preparing a dose is no more than 1 min. To reveal the full potential of 1H hyperpolarization in an inhomogeneous magnetic field, we convert the anti-phase PHIP signals into in-phase peaks, thereby increasing the SNR by a factor of 5. Using a spin-echo approach allowed us to observe the evolution of spin order distribution in real time while conserving the expensive reagents for reaction monitoring, imaging and potential in vivo usage. This compact polarizer will allow us to pursue the translation of hyperpolarized MRI towards in vivo applications further.


Conflict of interest statement

The authors declare no competing interests.

Figures

Fig. 1
Fig. 1. Comparison between high-field, high-resolution, and low-field, low-resolution NMR spectra.
1H-NMR spectra of 50 mM vinyl acetate (VA) and 50 mM ethyl acetate (EA) dissolved in acetone-d6 measured with a 9.4 T high-resolution NMR spectrometer (a) and the 0.55 T MRI (b). The inhomogeneity of the magnetic field and its limited strength render detailed chemical analysis impossible.
Fig. 2
Fig. 2. Ethyl pyruvate (EP) hyperpolarized at 0.55 T.
a Conversion of the hyperpolarized anti-phase EP-d6 spectrum (a-2) into an in-phase spectrum (a-3) boosted the SNR about six times. b Experimental (red circles) and simulated (dashed line) 1H polarization achieved by the out-of-phase spin order transfer sequence with 3 refocusing elements (45o-OPE(3)) as a function of refocusing interval τ. The spectrum for the highest polarization at τ = 10 ms (arrow) is shown in a-3. Note that individual OPE-45 (red indicators) and longitudinal 45o-CPMG experiments (blue indicators) yielded very similar results (see Fig. 3 for details on 45o-CPMG SOT). The in-phase spectrum (a-3) was easier to analyze and less affected by the field inhomogeneity than the PASADENA spectrum (a-2). The estimated polarization of each proton was 14.4% (Supplementary Fig. 4), about one third of the theoretical maximum of 50% for a two-spin system. Note that a new 300 μL sample injection was required for each red data point on (b). Note that spectrum of neat (~13.5 M), thermally polarized acetone-h6, acquired with a 90° excitation and acquisition sequence (90°-FID), showed a much lower amplitude as the signal of 50 mM hyperpolarized EP-d6. Spectra a-2,3 were obtained after bubbling 5 bar, 92% pH2 for 45 s through the sample containing [Rh] = 3 mM, [vinyl pyruvate-d6] = 50 mM using 45o-FID (a-2) or 45o-OPE(3) with τ = 9 ms (a-3). The simulated net polarization of EP-d6 (b) was multiplied by exp(-τ/60 ms) to accommodate signal decay phenomenologically (black dashed line).
Fig. 3
Fig. 3. Highly accelerated observation of spin order transfer in EP-d6 during PHIP at 0.55 T.
In-phase PHIP signal simulated for 45o out-of-phase spin echo sequence with n refocusing elements and τ intervals (45o-sOPE(n,τ), a, b) and experimentally measured signals (c, d) using a 45o-CPMG sequence as a function of τ and a number of echoes n (a, c), or as a function of τ and 2nτ (b, d). The simulations were well reproduced by the experiments and helped to identify parameters suited for the spin order transfer. Here, each line in the polarization transfer map (c) was measured using one sample, while 100 would be necessary with conventional 45o-OPE. Simulations: only two protons were considered; chemical shifts and J-coupling constants are given in methods; relaxation and magnetic field inhomogeneity were not considered; duration of the 90o and 180o pulses were 30 μs and 60 μs, respectively. Experiments: samples were prepared by mixing [Rh] = 3 mM with 50 mM of vinyl pyruvate-d6 (VP-d6) in acetone-d6; the pH2 pressure was 15 bar; the signal decayed due to relaxation, imperfect refocusing RF pulses, diffusion, and oscillation of the external magnetic field; the durations of the 90o and 180o pulses were 33 μs and 66 μs, respectively. Analogous maps were measured for EA-d6 and EC (Supplementary Figs. 2 and 3). The 45o-CPMG values shown in Fig. 2b are taken from (c) for n = 3.
Fig. 4
Fig. 4. Observed T2 relaxation decay rate R2obs as a function of τ (echo time is 2τ).
For each τ, 169 echoes were acquired in a single 90o-CPMG sequence. A monoexponential decay function fitted to the data was used to determine R2obs for each τ (Eq. 1, circles with whiskers indicating standard deviation). These transversal relaxation rates were fitted with R2obs=1T2+D*2τ2 for τ ≤ 170 ms (red line), resulting in 1T2=0.262±0.001 s−1 or T2=3.81±0.01 s and D*=13.4±0.2 s−1. Sample: the 10 mm tube with 300 μL of acetone-h6; the entire sample was inside the B1 coil. Each measurement was repeated three times, after which the results were averaged (symbols).
Fig. 5
Fig. 5. Hydrogenation reaction kinetics for acetate and pyruvate precursors.
Normalized hyperpolarized signal of ethyl acetate-d6 (EA-d6, 5 bar – blue and 15 bar – cyan, a) and ethyl pyruvate-d6 (EP-d6, 5 bar – green and 15 bar – red, b) as a function of bubbling time τb for two pH2 hydrogenation pressures. An increase in pH2 pressure proportionally increased the hydrogenation rate; the hydrogenation of vinyl acetate (VA) was always faster than that of vinyl pyruvate (VP). The sample was prepared by mixing [Rh] = 3 mM with 50 mM of the hydrogenation precursor VA-d6 (a) and VP-d6 (b) in acetone-d6. The kinetics were fitted with two exponential decay functions of the form Aeτb/T1ek1τb with a shared T1=64±14 s (here and below fit value and its standard errors are given). The reaction rate constants were measured to be: VA-d6 → EA-d6, k1(5bar)=0.047±0.012 s−1, k1(15bar)=0.11±0.025 s-1 and VP-d6 → EP-d6, k1(5bar)=0.0086±0.01 s−1 and k1(15bar)=0.036±0.027 s−1 for EP-d6. The bar plot (c) visualizes the difference between these rates; whiskers indicate the standard error.
Fig. 6
Fig. 6. 13C Hyperpolarization and imaging of 1-13C-pyruvate.
Spectroscopy (a) and imaging (b) of hyperpolarized 1−13C-ethyl pyruvate-d6 (1-13C-EP-d6) Strongly hyperpolarized 13C NMR signal of 50 mM 1-13C-EP-d6 was observed (a, red) and quantified to ~7% 13C polarization with respect to a thermally polarized, 5.3 M 13C- urea sample (a, blue, magnified 1000 times, τb = 20 s hydrogenation time, ESOTHERIC SOT: n1 = n2 = n3 = 2, τ1 = τ3 = 169 ms, and τ2= 90 ms, see methods and Supplementary Fig. 17). Monitoring the decaying hyperpolarized signal using 5o excitation and acquisition scheme (5o-FID) every 6 s yielded a monoexponential decay constant of 63 ± 3 s. The signal was strong enough to record ten consecutive FLASH images in 1.5 s each, either in situ (b) or after shuttling the liquid into a tube holding a 3D-printed phantom (c, d, 5o excitation, cartesian encoding without acceleration, matrix of 32 × 32, repetition time of 50 ms). Schemes in (b) and (c) demonstrate the imaging site and liquid shuttling. The black hole in image (b) is the position of the 1/32” capillary. Note that ten images were acquired before the signal vanished.
Fig. 7
Fig. 7. Schematic of the chemical reactions used here to generate hyperpolarisation.
Hydrogenation of the three precursors used here: ethyl phenylpropiolate (EPh) → ethyl cinnamate (EC) (a), vinyl acetate-d6 (VA-d6) → ethyl acetate-d6 (EA-d6) (b), vinyl pyruvate-d6 (VP-d6) → ethyl pyruvate-d6 (EP-d6) (c). The relevant 1H chemical shifts and 1H−1H J-coupling constants are indicated. pH2 is marked in red.
Fig. 8
Fig. 8. The portable polarizer used in this study.
Rendering (a), photo (b), and diagram (c) of the polarizer presented here, and a typical automated hyperpolarization protocol (d). The hyperpolarization routine consisted of (1) cleaning by flushing the gas lines and tube with N2 for 5 s; (2) releasing N2 pressure from all gas lines; (3) filling the reactor (10 mm tube) with precursor solution from the syringe, (4) pressurization of the reactor with pH2 and bubbling for τb, (5) termination of the gas supply and equilibration of the pressure in the NMR tube for 1 s; (6) application of spin order transfer (SOT) sequence and (optional) MR signal acquisition, and (7) flushing out the sample using N2 pressure. If desired, the entire cycle was repeated several times, e.g., while varying a given parameter. 20 mL of precursor–catalyst solution was sufficient for 60 experiments with a duty cycle of 1 min, which were carried out automatically. Any SOT can be used; 45o-FID, 45o-OPE, and 45o,90o-CPMG and ESOTHERIC sequences (Fig. 9) were tested here.
Fig. 9
Fig. 9. Schematic of the NMR sequences used in this study.
These sequences are φ-FID (a), 45o-out-of-phase echo (OPE) (b), φ-CPMG (c), and ESOTHERIC (d). In the case of thermal polarization, φ = 90o results in maximum polarization (in a and c), while in the case of PHIP (PASADENA), φ = 45o should be used instead. Note that composite refocusing pulses (90Xo180Yo90Xo) were used, and the difference between (b) and (c) is the signal acquisition (FID or multiple echoes. FID: free induction decay, OPE: out-of-phase echo, CPMG: Carr-Purcell-Meiboom-Gill sequence, n, n1, n2, and n3 are the number of refocusing pulses, ESOTHERIC: efficient spin order transfer to heteronuclei via relayed inept chains.

References

    1. Ardenkjær-Larsen JH, et al. Increase in signal-to-noise ratio of >10,000 times in liquid-state NMR. Proc. Natl Acad. Sci. USA. 2003;100:10158–10163. - PMC - PubMed
    1. Nelson SJ, et al. Metabolic imaging of patients with prostate cancer using hyperpolarized [1-13C]pyruvate. Sci. Transl. Med. 2013;5:198ra108–198ra108. - PMC - PubMed
    1. Cunningham CH, et al. Hyperpolarized 13C metabolic MRI of the human heart. Circ. Res. 2016;119:1177–1182. - PMC - PubMed
    1. Aggarwal R, Vigneron DB, Kurhanewicz J. Hyperpolarized 1-[13C]-pyruvate magnetic resonance imaging detects an early metabolic response to androgen ablation therapy in prostate cancer. Eur. Urol. 2017;72:1028–1029. - PMC - PubMed
    1. Woitek R, et al. Hyperpolarized carbon-13 MRI for early response assessment of neoadjuvant chemotherapy in breast cancer patients. Cancer Res. 2021;81:6004–6017. - PMC - PubMed

Publication types