. 2023 Aug 8;13(1):12830.
doi: 10.1038/s41598-023-40096-7.

Oleic acid as potential immunostimulant in metabolism pathways of hybrid grouper fingerlings (Epinephelus fuscoguttatus × Epinephelus lanceolatus) infected with Vibrio vulnificus

Affiliations

Oleic acid as potential immunostimulant in metabolism pathways of hybrid grouper fingerlings (Epinephelus fuscoguttatus × Epinephelus lanceolatus) infected with Vibrio vulnificus

Maya Erna Natnan et al. Sci Rep. .

Abstract

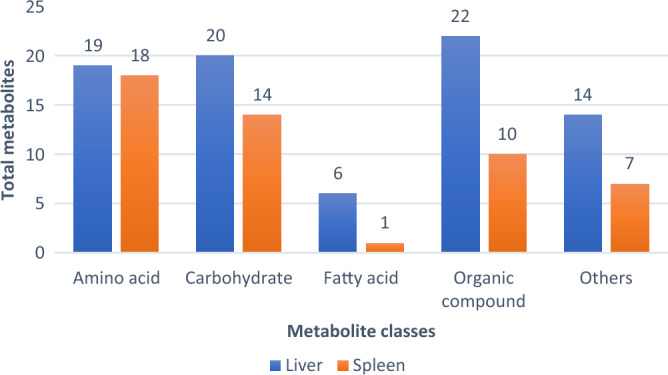
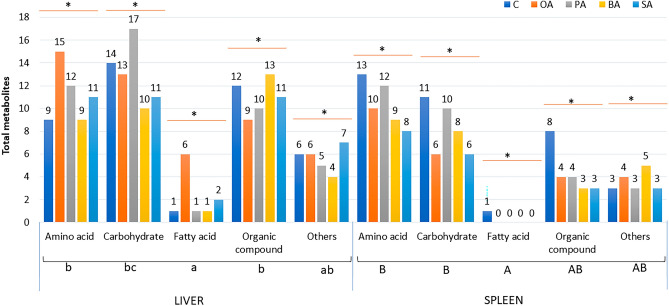
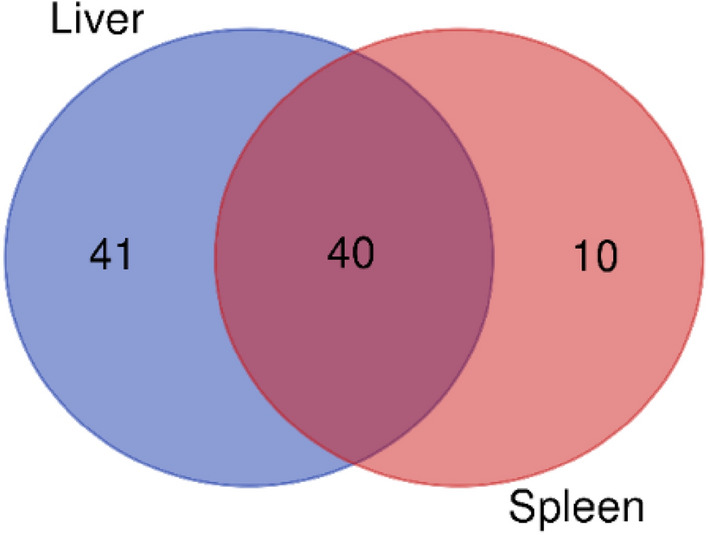
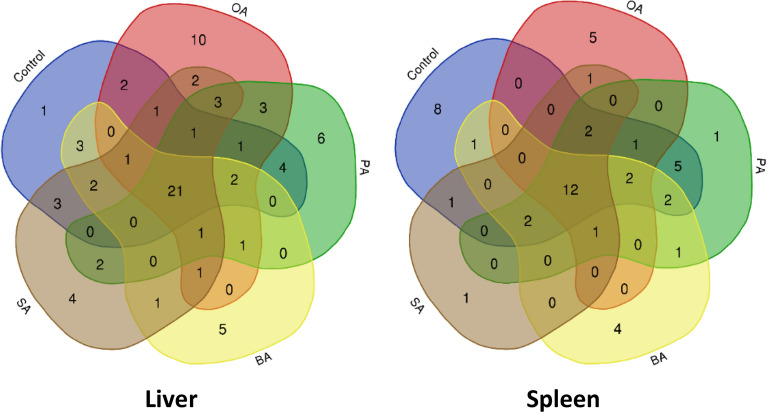
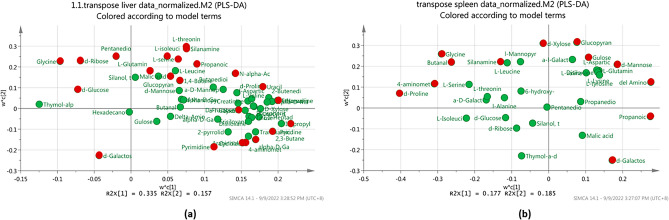
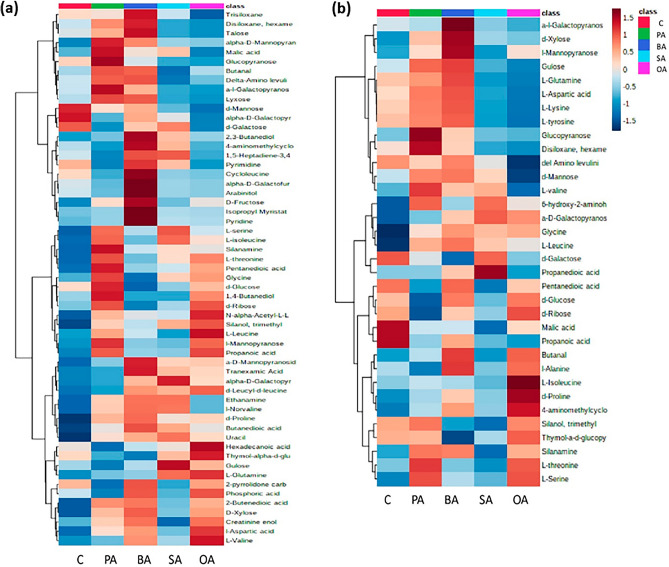
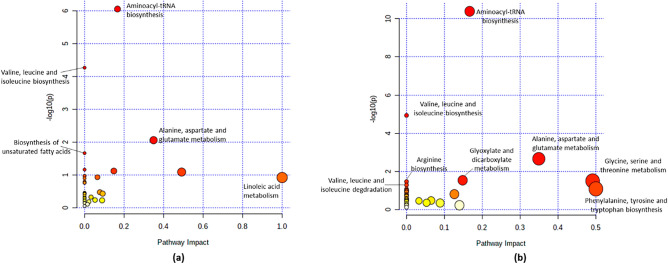
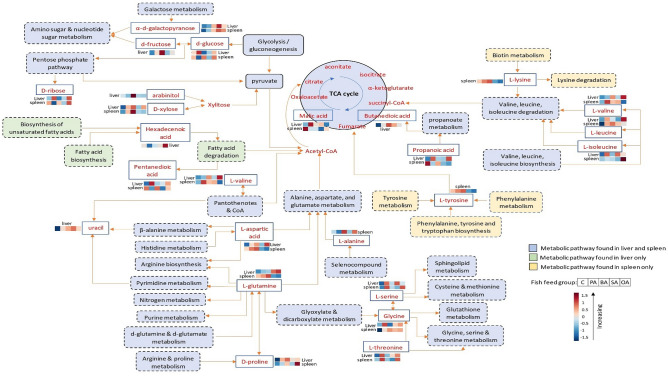
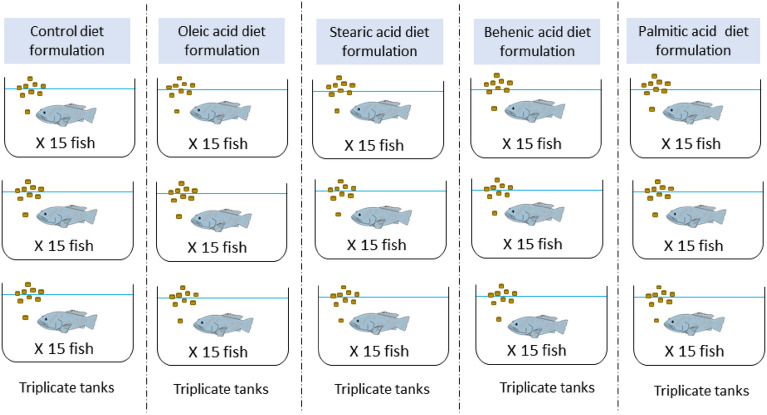
Grouper culture has been expanding in Malaysia due to the huge demand locally and globally. However, due to infectious diseases such as vibriosis, the fish mortality rate increased, which has affected the production of grouper. Therefore, this study focuses on the metabolic profiling of surviving infected grouper fed with different formulations of fatty acid diets that acted as immunostimulants for the fish to achieve desirable growth and health performance. After a six-week feeding trial and one-week post-bacterial challenge, the surviving infected grouper was sampled for GC-MS analysis. For metabolite extraction, a methanol/chloroform/water (2:2:1.8) extraction method was applied to the immune organs (spleen and liver) of surviving infected grouper. The distribution patterns of metabolites between experimental groups were then analyzed using a metabolomics platform. A total of 50 and 81 metabolites were putatively identified from the spleen and liver samples, respectively. Our further analysis identified glycine, serine, and threonine metabolism, and alanine, aspartate and glutamate metabolism had the most impacted pathways, respectively, in spleen and liver samples from surviving infected grouper. The metabolites that were highly abundant in the spleen found in these pathways were glycine (20.9%), l-threonine (1.0%) and l-serine (0.8%). Meanwhile, in the liver l-glutamine (1.8%) and aspartic acid (0.6%) were found to be highly abundant. Interestingly, among the fish diet groups, grouper fed with oleic acid diet produced more metabolites with a higher percent area compared to the control diets. The results obtained from this study elucidate the use of oleic acid as an immunostimulant in fish feed formulation affects more various immune-related metabolites than other formulated feed diets for vibriosis infected grouper.


Conflict of interest statement

The authors declare no competing interests.

Figures

Figure 1
Figure 1
Vibrio grow on the TCBS agar plate swabbed from the fish gill.
Figure 2
Figure 2
Comparison of the total identified metabolites between liver and spleen.
Figure 3
Figure 3
Comparison of the total identified metabolites in the liver and spleen sample of challenged grouper in corresponded to different feed formulation C; fed with the control diet, OA; fed with the oleic acid diet, PA; fed with the palmitic acid diet, BA; fed with the behenic acid diet and SA; fed with the stearic acid diet. Different letters indicate significant different (p < 0.05) and * indicated no significant different between diet groups (p > 0.05).
Figure 4
Figure 4
Venn diagram of the overall distribution of metabolites in the liver and the spleen of survived-infected grouper in all feeding treatments.
Figure 5
Figure 5
Venn diagram represent the similarities and differences of identified metabolites obtained from two immune organs (liver and spleen) of infected hybrid grouper fed with five different formulated diet. C; infected and fed with the control diet, OA; infected and fed with oleic acid, PA; infected and fed with palmitic acid, BA; infected and fed with behenic acid and SA; infected and fed with stearic acid.
Figure 6
Figure 6
PCA score plot (a) and PLS-DA score plot (b) for liver and spleen metabolites depicting the separation pattern of two different organs. Liver sample (green), spleen sample (blue). PLS-DA loading plot analysis (c) of metabolites profiles from liver and spleen organ.
Figure 7
Figure 7
PCA score plot (a) and PLS-DA score plot (b) for liver metabolites depicting the separation pattern of five different sample groups. 1 (green)—control (infected and fed with control diet), 2 (dark blue)—PA (infected and fed with palmitic acid), 3 (red)—BA (infected and fed with behenic acid), 4 (yellow)—SA (infected and fed with stearic acid), and 5 (light blue)—OA (infected and fed with oleic acid).
Figure 8
Figure 8
PCA score plot (a) and PLS-DA score plot (b) for spleen metabolites depicting the separation pattern of five different sample groups. 1 (green)—control (infected and fed with control diet), 2 (dark blue)—PA (infected and fed with palmitic acid), 3 (red)—BA (infected and fed with behenic acid), 4 (yellow)—SA (infected and fed with stearic acid), and 5 (light blue)—OA (infected and fed with oleic acid).
Figure 9
Figure 9
PLS-DA derived loading plot analysis of liver (a) and spleen (b) metabolites for five different diet groups. Compounds marked red indicate metabolites with a VIP value of more than 1.
Figure 10
Figure 10
Hierarchical clustering analysis of detected metabolite compounds from the liver (a) and spleen (b) of survived-infected groupers fed with five different feed formulations. Brown color indicates relatively high abundance, blue represents a relatively low abundance.
Figure 11
Figure 11
Pathway impact and statistical significance of metabolic pathways identified by pathway enrichment analysis of the metabolites. Liver sample (a); spleen sample (b). Y-axis shows a negative logarithm of the p-value (p < 0.05), indicates pathways with higher statistical significance are drawn higher in the graph.
Figure 12
Figure 12
Integrated pathways contribute to the grouper’s immune response towards Vibrio infection based on the metabolite’s intensities in the liver and spleen samples of the survived-infected grouper. Blue represents pathways found in the liver and spleen that contributed to the grouper’s survival. Green represents pathways contributed to the grouper survival found in the liver only. Orange represents pathways contributed to the grouper survival found in the spleen only. Blue and red boxes represented increased and decreased intensities of metabolites in the liver and spleen samples for the survived-infected grouper fed with five different fish diets. One box represents the average replicates used in the study and their corresponding intensities.
Figure 13
Figure 13
Diagram of aquaria tank set-up for five different diet formulations.

Similar articles

Cited by

References

    1. FAO. Statistic, Food and Agriculture Organization of the United Nations. Rome, Italyhttp://www.fao.org/fishery/statistics/en (2020).
    1. Cheng SS, Senoo S, Siddiquee S, Rodrigues KF. Genetic variation in the mitochondrial genome of the giant grouper Epinephelus lanceolatus (Bloch, 1790) and its application for the identification of broodstock. Aquac. Rep. 2015;2:139–143. doi: 10.1016/j.aqrep.2015.09.003. - DOI
    1. Mustafa, S. Climate change adaptation in aquaculture in Sabah: Strategic choices and imperatives. CCIR News 12 (2012).
    1. Bunlipatanon P, U-taynapun K. Growth performance and disease resistance against Vibrio vulnificus infection of novel hybrid grouper ( Epinephelus lanceolatus × Epinephelus fuscoguttatus ) Aquac. Res. 2017;48:1711–1723. doi: 10.1111/are.13008. - DOI
    1. Ebi I, Lal TM, Ransangan J, Yong ASK, Shapawi R. Susceptibility of hybrid grouper (Epinephelus fuscogutattus ♀ × Epinephelus lanceolatus ♂) to Vibrio harveyi VHJR7. AACL Bioflux. 2018;11:37–42.

Publication types