. 2023 Aug 8;6(1):823.
doi: 10.1038/s42003-023-05178-2.

DichroIDP: a method for analyses of intrinsically disordered proteins using circular dichroism spectroscopy

Affiliations

DichroIDP: a method for analyses of intrinsically disordered proteins using circular dichroism spectroscopy

Andrew J Miles et al. Commun Biol. .

Abstract

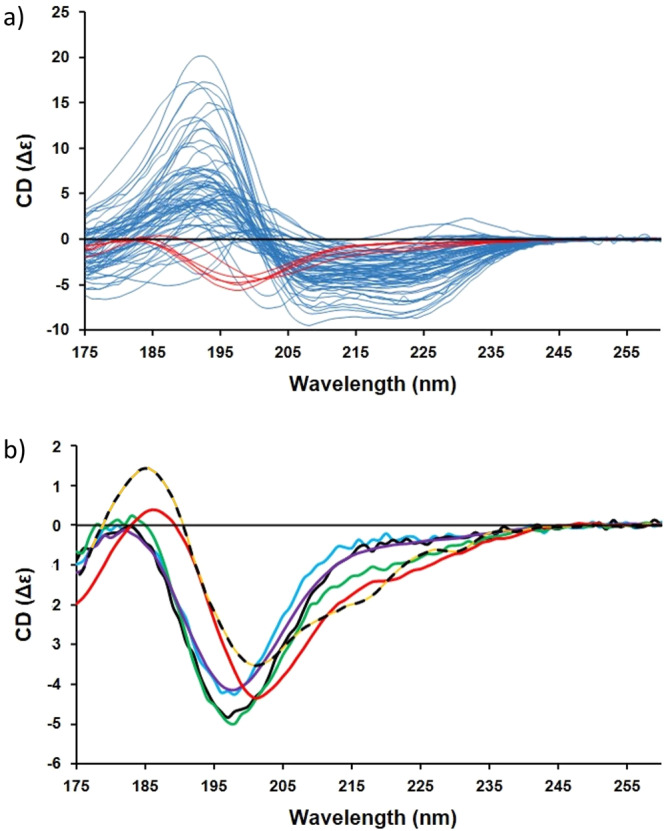
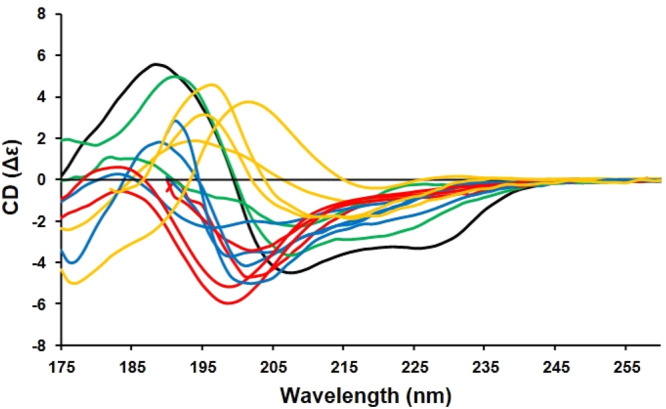
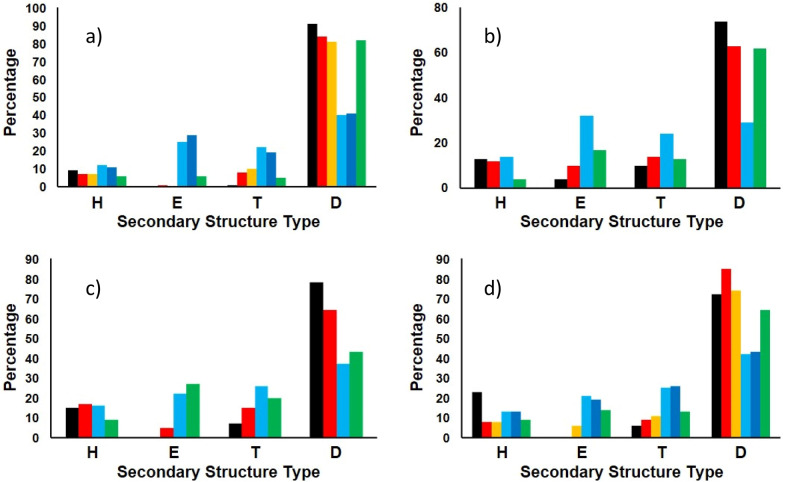
Intrinsically disordered proteins (IDPs) are comprised of significant numbers of residues that form neither helix, sheet, nor any other canonical type of secondary structure. They play important roles in a broad range of biological processes, such as molecular recognition and signalling, largely due to their chameleon-like ability to change structure from unordered when free in solution to ordered when bound to partner molecules. Circular dichroism (CD) spectroscopy is a widely-used method for characterising protein secondary structures, but analyses of IDPs using CD spectroscopy have suffered because the methods and reference datasets used for the empirical determination of secondary structures do not contain adequate representations of unordered structures. This work describes the creation, validation and testing of a standalone Windows-based application, DichroIDP, and a new reference dataset, IDP175, which is suitable for analyses of proteins containing significant amounts of disordered structure. DichroIDP enables secondary structure determinations of IDPs and proteins containing intrinsically disordered regions.


Conflict of interest statement

The authors declare no competing interests.

Figures

Fig. 1
Fig. 1. CD spectra associated with the IDP175 reference dataset.
In (a), the complete IDP175 dataset where the new IDP spectra (listed in Supplementary Table S1 (top)) are shown in red whilst the spectra of the SP175 proteins (listed in Supplementary Table S2) are shown in pale blue. The new IDP spectra of the IDP175 dataset in (b) are of MEG-14 (purple), HASPA (blue), HASPB (black), TARP (green), and casein (red). For comparison, the dotted line is the spectrum of alpha-chymotrypsinogen (not included in the IDP reference dataset), which contains a highly-twisted right-handed beta-sheet, illustrating the similarity of this type of spectrum (designated “β2”) to the spectra of the IDPs.
Fig. 2
Fig. 2. CD spectra of the test proteins (see details in Supplementary Table S1 (bottom)).
These include the following types of proteins: intrinsically disordered proteins (in red) osteopontin, amelogenin, Sic1, BB1 C-terminus; Beta-1 proteins (in yellow) β2-microglobulin, prealbumin, Bence Jones Protein, eGFP; Βeta-2 proteins (in blue) MAGI-1 PDZ1, UTPase, trypsin, ecotin; and mixed αβ proteins (in green) pokeweed lectin, and saporin; and the primarily alpha helical protein (in black) α-lactalbumin. Details of their secondary structures and their PCDDBIDs are listed in Supplementary Table S1 (bottom).
Fig. 3
Fig. 3. Secondary structure analyses of the IDPs in the test set using DichroIDP in conjunction with various reference datasets mentioned in the text compared with AlphaFold2 predictions.
The proteins are: (a) osteopontin; (b) Sic1; (c) amelogenin, and (d) ΒB1 C-terminus. Secondary structures are indicated as: H=Helix (using “Dictionary of Secondary Structure of Proteins” (DSSP) assignments H + G + I). E= beta strand (DSSP E). T= Turn (DSSP T + S). D=disordered (DSSP B + O). For each secondary structure type, the coloured bars show the % of each structure predicted from their CD spectra using the following datasets: (red) IDP175t, (yellow) IDP175, (light blue) SP175t, (dark blue) SP175, (green) CDPro42. These are compared to AlphaFold2 predictions depicted in black in each panel. Sic1 and amelogenin were only analysed using the datasets IDP175t, SP175t and CDPro42 because their data had low wavelength cutoffs above 175 nm. Protein details are listed in Supplementary Table S1 (bottom).

References

    1. Uversky VN, Gillespie JR, Fink AL. Why are “natively unfolded” proteins unstructured under physiologic conditions? Proteins Struct. Funct. Bioinf. 2000;41:415–427. - PubMed
    1. van der Lee R, et al. Classification of intrinsically disordered regions and proteins. Chem. Rev. 2014;114:6589–6631. - PMC - PubMed
    1. Dyson HJ, Wright PE. Intrinsically unstructured proteins and their functions. Nat. Rev. Mol. Cell Biol. 2005;6:197–208. - PubMed
    1. Haynes C, et al. Intrinsic disorder is a common feature of hub proteins from four eukaryotic interactomes. PLoS Comp. Biol. 2006;2:e100. - PMC - PubMed
    1. Miles AJ, Wallace BA. Synchrotron radiation circular dichroism spectroscopy of proteins and applications in structural and functional genomics. Chem. Soc. Rev. 2006;35:39–51. - PubMed

Publication types

MeSH terms

Substances