. 2023 Aug 9;42(1):199.
doi: 10.1186/s13046-023-02756-4.

Macrophage-organoid co-culture model for identifying treatment strategies against macrophage-related gemcitabine resistance

Affiliations

Macrophage-organoid co-culture model for identifying treatment strategies against macrophage-related gemcitabine resistance

Shengwei Jiang et al. J Exp Clin Cancer Res. .

Abstract

Background: Gemcitabine resistance (GR) is a significant clinical challenge in pancreatic adenocarcinoma (PAAD) treatment. Macrophages in the tumor immune-microenvironment are closely related to GR. Uncovering the macrophage-induced GR mechanism could help devise a novel strategy to improve gemcitabine treatment outcomes in PAAD. Therefore, preclinical models accurately replicating patient tumor properties are essential for cancer research and drug development. Patient-derived organoids (PDOs) represent a promising in vitro model for investigating tumor targets, accelerating drug development, and enabling personalized treatment strategies to improve patient outcomes.

Methods: To investigate the effects of macrophage stimulation on GR, co-cultures were set up using PDOs from three PAAD patients with macrophages. To identify signaling factors between macrophages and pancreatic cancer cells (PCCs), a 97-target cytokine array and the TCGA-GTEx database were utilized. The analysis revealed CCL5 and AREG as potential candidates. The role of CCL5 in inducing GR was further investigated using clinical data and tumor sections obtained from 48 PAAD patients over three years, inhibitors, and short hairpin RNA (shRNA). Furthermore, single-cell sequencing data from the GEO database were analyzed to explore the crosstalk between PCCs and macrophages. To overcome GR, inhibitors targeting the macrophage-CCL5-Sp1-AREG feedback loop were evaluated in cell lines, PDOs, and orthotopic mouse models of pancreatic carcinoma.

Results: The macrophage-CCL5-Sp1-AREG feedback loop between macrophages and PCCs is responsible for GR. Macrophage-derived CCL5 activates the CCR5/AKT/Sp1/CD44 axis to confer stemness and chemoresistance to PCCs. PCC-derived AREG promotes CCL5 secretion in macrophages through the Hippo-YAP pathway. By targeting the feedback loop, mithramycin improves the outcome of gemcitabine treatment in PAAD. The results from the PDO model were corroborated with cell lines, mouse models, and clinical data.

Conclusions: Our study highlights that the PDO model is a superior choice for preclinical research and precision medicine. The macrophage-CCL5-Sp1-AREG feedback loop confers stemness to PCCs to facilitate gemcitabine resistance by activating the CCR5/AKT/SP1/CD44 pathway. The combination of gemcitabine and mithramycin shows potential as a therapeutic strategy for treating PAAD in cell lines, PDOs, and mouse models.

Keywords: Cancer stem cells; Gemcitabine resistance; Macrophages; Organoids.


Conflict of interest statement

The authors declare that they have no competing interests.

Figures

Fig. 1
Fig. 1
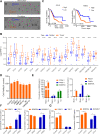
Macrophages induce GR in cell lines, PDOs, and clinical data from PAAD. A Representative pictures of PAAD tumor samples stained by CD68 (left); the survival time in different groups (right) (n = 48). Scale bar: 100 μm. B Overall survival (OS) and progression-free interval (PFI) time of PAAD patients treated with gemcitabine. Data were extracted from The Cancer Genome Atlas (TCGA) (n = 56). C A schematic diagram of organoid development via the droplet-based microfluidic device. Representative PDO images of the monoculture model and co-culture model. Scale bar: 200 μm. D Cell viability analysis of PDOs, human PAAD cell lines (PANC-1, MIA PaCa-2), and a mouse PAAD cell line (6606PDA) in the monoculture model and co-culture model (n = 3 ~ 5). E Gemcitabine IC50 in the mono or co-culture model (n = 3 ~ 5). F Analysis of apoptosis levels of PANC-1 cells in mono or co-culture model after treatment with 2 μM gemcitabine for 2 days. (n = 3). *p < 0.05
Fig. 2
Fig. 2
The CCL5/AREG loop allows the communication between macrophages and PCCs. A A 97-target cytokine array was used to assess cytokine changes in the mono or co-culture model after 3 days of culture. B The gene expression of 16 cytokines in PAAD tumor or normal tissue according to the TCGA and GTEx databases. C Kaplan‒Meier survival analysis of CCL5 and AREG in PAAD. D Cell viability of 6606PDA cells treated with different cytokines at 100 ng/ml for each cytokine for 3 days. (n = 3 ~ 5). E The quantitative analysis of AREG (left) and CCL5 (right) by ELISA in different cells of the two models after 3 days of culture. (n = 3). F Macrophages (RAW264.7 and THP-1 cells) or PCCs (6606PDA and PANC-1 cells) were stimulated with 100 ng/ml AREG for 3 days to induce CCL5 secretion. (n = 3). G Macrophages and PCCs were stimulated with 100 ng/ml CCL5 for 3 days to induce AREG secretion. (n = 3). *p < 0.05
Fig. 3
Fig. 3
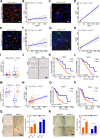
Macrophage-derived CCL5 promotes cancer stemness in PAAD. Representative pictures of CCL5/AREG (A), CCL5/CD68 (C), CCL5/CD44 (E), and CD68/CD44 (G) in 48 PAAD tumor samples. Scale bar: 50 μm. Positive density Spearman’s correlation analysis of CCL5/AREG (B), CCL5/CD68 (D), CCL5/CD44 (F), and CD68/CD44 (H). (n = 48). I The positive density of CD44 and CD68 in tumor or para-tumor tissues. (n = 48). J Representative pictures of CD44 and CD68 in an additional 12 PAAD tumor samples. Scale bar: 100 μm. Kaplan‒Meier survival analysis of CD68 (K) and CD44 (L) in 48 PAAD tumor samples. M Gene expression of CD44 and CD68 in tumor or normal tissue in the TCGA and GTEx databases. N The Spearman's correlation analysis of CD44 and CD68. Kaplan–Meier survival analysis of CD68 (O) and CD44 (P) in the TCGA database. Q Representative sphere formation assay images (left) and quantitative analysis (right) of PCCs stimulated with 100 ng/ml CCL5 for 15 days. Scale bar: 200 μm. R Representative sphere formation assay images (left) and quantitative analysis (right) of the two models on day 15. Scale bar: 200 μm. (n = 3). *p < 0.05
Fig. 4
Fig. 4
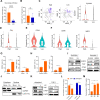
Macrophages enhance PCC stemness via the CCL5/AKT/Sp1/CD44 axis. A Protein expression analysis of the CCR5/AKT/Sp1/CD44 axis in PANC-1 cells treated with 100 ng/ml CCL5 for 3 days. B In two different models, western blotting analysis of the CCR5/AKT/Sp1/CD44 axis at day 3. C Representative immunofluorescence images of CD44 expression. Scale bar: 50 μm. D Protein expression of PANC-1 cells treated with 0.75 nM maraviroc, a CCR5 inhibitor, for 2 days. E Sp1 nucleus translocation analysis in mono or co-culture model. F Protein expression analysis of PANC-1 cells treated with 0.0625 μM mithramycin (MIT) for 2 days. G Sp1 nucleus translocation analysis after treatment with 0.0625 μM MIT for 2 days. H Western blotting analysis of PANC-1 cells treated with or without shSp1. I Gene expression of Sp1 in tumor or normal tissue in the TCGA and GTEx databases. J IC50 of gemcitabine was determined in PANC-1 cells with or without shSp1 transfection. (n = 6). K The concentration of AREG in PANC-1 cell culture medium treated with or without 0.75 nM maraviroc, 0.0625 μM MIT or shSp1 for 2 days. (n = 3). *p < 0.05
Fig. 5
Fig. 5
PCC-derived AREG promotes the secretion of CCL5 through the Hippo-YAP pathway. A The percentage of macrophage infiltration in 16 PAAD patients. The single-cell sequencing data were obtained from NCBI's Gene Expression Omnibus store (GSE155698). High = 7 samples, Low = 9 samples. B The percentage of EpCAM+ cells among all cells except for macrophages in the two groups. C Gene expression of EpCAM in total cells. D Expression of Cda in EpCAM+ cells. E Expression of CD44 in EpCAM.+ cells. F Expression of CD86 and MRC1 in macrophages. G The types of RAW264.7 cells co-cultured with 6606PDA cells were identified by flow cytometry. CD206 was used to mark M2-type macrophages, and iNOS was used to mark M1-type macrophages. H The types of RAW264.7 cells treated with 100 ng/ml AREG for 3 days were identified by flow cytometry. I Protein expression analysis of EGFR, YAP and CTGF in RAW264.7 cells following 6606PDA cell or 100 ng/ml AREG stimulation for 3 days. J YAP nucleus translocation analysis in two models. K Treatment with 0.5 μM verteporfin for 2 days inhibited the Hippo-YAP pathway in macrophages in the in vitro model. L Verteporfin reduced macrophage secretion of CCL5. (n = 3). M The concentration of CCL5 in M0, M1, and M2 type macrophage culture medium. (n = 3). *p < 0.05
Fig. 6
Fig. 6
Sequential single-cell transcriptome analysis of mouse pancreatic cancer development. The data were obtained from NCBI's Gene Expression Omnibus repository (GSE141017). A Analysis of macrophages. B The ratio of macrophages to total cells in different tumor stages. C The proportion of CCL5+ cells in macrophages and total cells. D The expression levels of CD86 and MRC1 in macrophages. E The proportion of M1 or M2-type macrophages among total macrophages with tumor progression. F Analysis of the tumor cells. G The percentage of CSCs to PCCs in different tumor stages. H The proportion of AREG+ cells among CSCs, PCCs and total cells. I The expression levels of the gemcitabine-related genes Ercc1a and Cda in PCCs and CSCs. J The expression levels of Sp1 and CD44 in PCCs
Fig. 7
Fig. 7
Targeting the macrophage-CCL5-Sp1-AREG loop alleviates GR in the in vivo and in vitro models. A The cell viability of 6606PDA cells treated with 0.25 μM Gem and 100 ng/mL CCL5 for 2 days. (n = 3). B The cell viability of 6606PDA cells treated with 0.25 μM Gem and 100 ng/mL AREG for 2 days. (n = 3). C The cell viability of 6606PDA cells treated with 0.0625 μM Gem with or without 0.1 μM Gefitinib (Gef); 0.5 μM Verteporfin (VP); 1.5 nM Maraviroc (MAR); or 0.0625 μM Mithramycin (MIT) for 2 days. (n = 5). D Analysis of apoptosis levels of PANC-1 cells after treatment with 2 μM gemcitabine, 0.0625 μM MIT, or both for 2 days. (n = 3). E Cell viability of PDOs, PANC-1, and MIA PaCa-2 cells treated with 2 μM gemcitabine, 0.25 μM MIT, or both for 2 days. (n = 3 ~ 5). F Representative pictures of the colony formation assay (left) and quantitative analysis of colonies (right) (n = 3). G Image of tumors from the orthotopic pancreatic carcinoma mouse model after treatment with gemcitabine, MIT, or both for 35 days. H The tumor weight in different treatment groups. (n = 6 tumors). I Representative images of HE staining. Scale bar: 50 μm. J Representative images of immunohistochemical staining. Scale bar: 50 μm. K Protein expression analysis of Sp1, CD44, and c-Myc. L The concentrations of AREG and CCL5 in mouse serum. (n = 6). *p < 0.05
Fig. 8
Fig. 8
Schematic diagram illustrating that targeting the macrophage-CCL5-SP1-AREG loop between macrophages and PCCs reduces cancer stem-like properties and GR in PAAD. Macrophage-derived CCL5 activates the CCR5/AKT/Sp1/CD44 axis in PCCs, acquiring chemoresistance and secretion of AREG. In response, PCCs produce AREG, which triggers the Hippo-YAP signaling pathway in macrophages, leading to the secretion of CCL5. Therefore, the macrophage-CCL5-Sp1-AREG loop is formed between macrophages and PCCs in the microenvironment. Targeting this loop with drugs like maraviroc, mithramycin, gefitinib, and verteporfin could improve chemotherapy, such as gemcitabine treatment. The PDO model is a superior choice for tumor microenvironment studies and preclinic drug screening. https://biorender.com/

References

    1. Siegel RL, Miller KD, Fuchs HE, Jemal A. Cancer statistics, 2021. CA Cancer J Clin. 2021;71:7–33. doi: 10.3322/caac.21654. - DOI - PubMed
    1. Melisi D, Garcia-Carbonero R, Macarulla T, Pezet D, Deplanque G, Fuchs M, et al. Galunisertib plus gemcitabine vs. gemcitabine for first-line treatment of patients with unresectable pancreatic cancer. Br J Cancer. 2018;119:1208–14. - PMC - PubMed
    1. Amrutkar M, Gladhaug IP. Pancreatic cancer chemoresistance to gemcitabine. Cancers. 2017;9:157. - PMC - PubMed
    1. Xu C, Sui S, Shang Y, Yu Z, Han J, Zhang G, et al. The landscape of immune cell infiltration and its clinical implications of pancreatic ductal adenocarcinoma. J Adv Res. 2020;24:139–148. - PMC - PubMed
    1. Yang J, Liao D, Chen C, Liu Y, Chuang TH, Xiang R, et al. Tumor-associated macrophages regulate murine breast cancer stem cells through a novel paracrine EGFR/Stat3/Sox-2 signaling pathway. Stem cells. 2013;31:248–258. - PubMed