. 2023 Aug 8;23(1):75.
doi: 10.1186/s40644-023-00595-2.

Differentiating brain metastasis from glioblastoma by time-dependent diffusion MRI

Affiliations

Differentiating brain metastasis from glioblastoma by time-dependent diffusion MRI

Kiyohisa Kamimura et al. Cancer Imaging. .

Abstract

Background: This study was designed to investigate the use of time-dependent diffusion magnetic resonance imaging (MRI) parameters in distinguishing between glioblastomas and brain metastases.

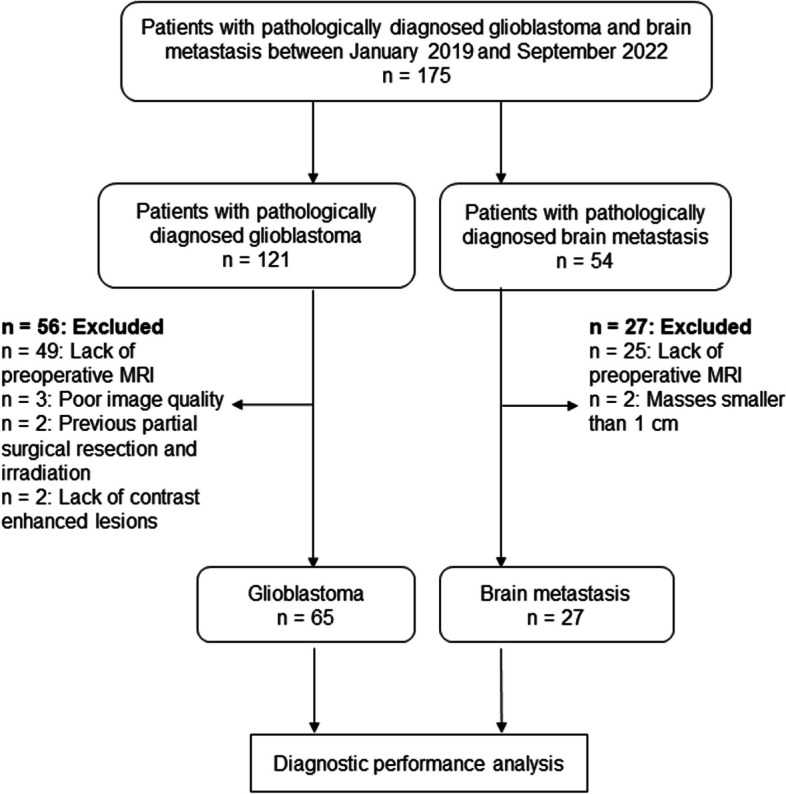
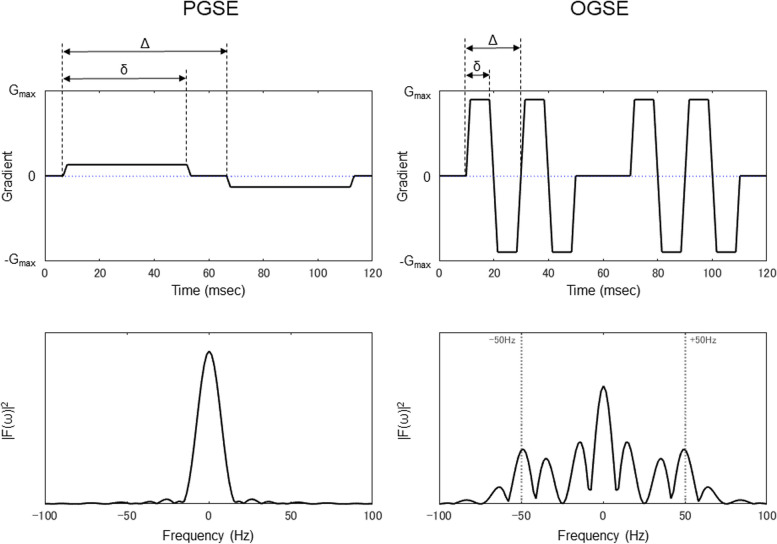
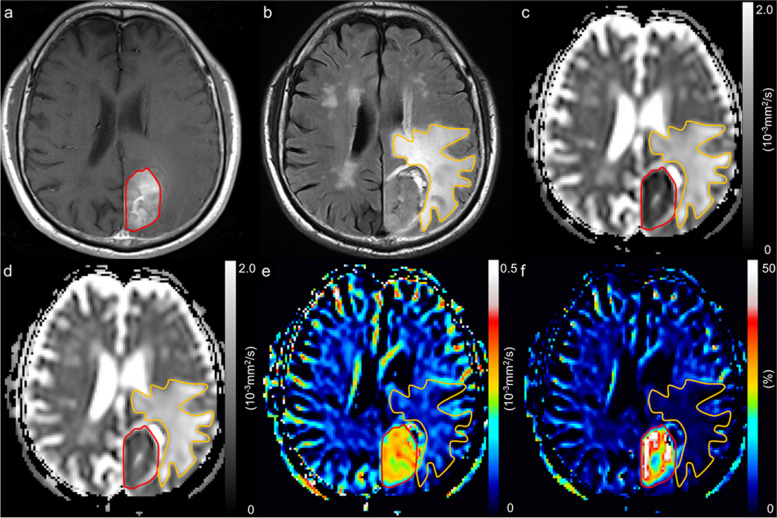
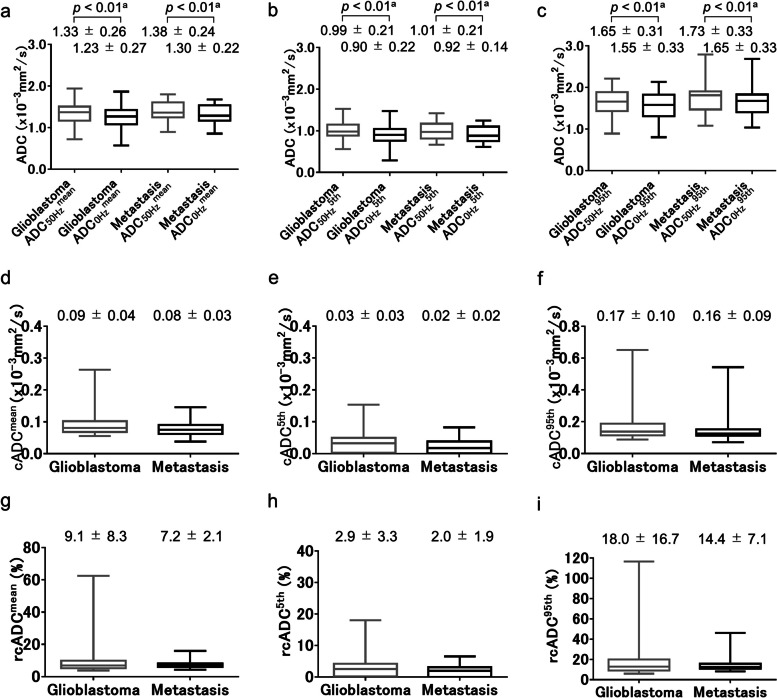
Methods: A retrospective study was conducted involving 65 patients with glioblastomas and 27 patients with metastases using a diffusion-weighted imaging sequence with oscillating gradient spin-echo (OGSE, 50 Hz) and a conventional pulsed gradient spin-echo (PGSE, 0 Hz) sequence. In addition to apparent diffusion coefficient (ADC) maps from two sequences (ADC50Hz and ADC0Hz), we generated maps of the ADC change (cADC): ADC50Hz - ADC0Hz and the relative ADC change (rcADC): (ADC50Hz - ADC0Hz)/ ADC0Hz × 100 (%).

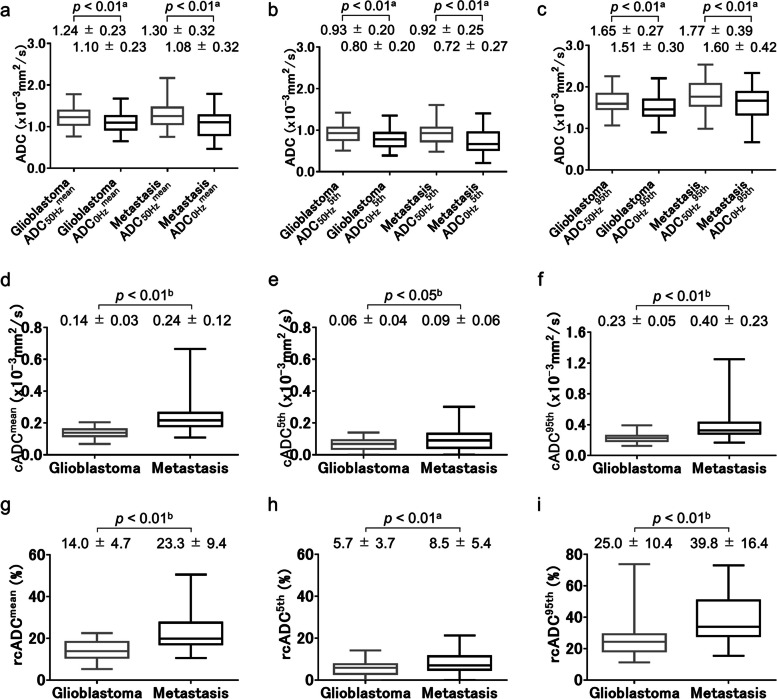
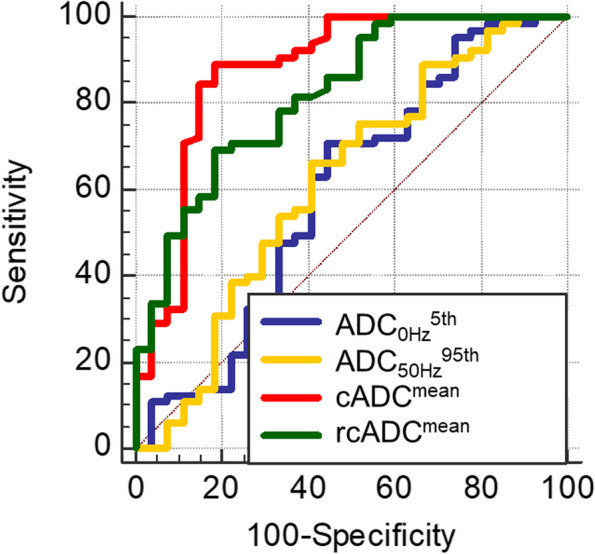
Results: The mean and the fifth and 95th percentile values of each parameter in enhancing and peritumoral regions were compared between glioblastomas and metastases. The area under the receiver operating characteristic curve (AUC) values of the best discriminating indices were compared. In enhancing regions, none of the indices of ADC0Hz and ADC50Hz showed significant differences between metastases and glioblastomas. The mean cADC and rcADC values of metastases were significantly higher than those of glioblastomas (0.24 ± 0.12 × 10⁻³mm2/s vs. 0.14 ± 0.03 × 10⁻³mm2/s and 23.3 ± 9.4% vs. 14.0 ± 4.7%; all p < 0.01). In peritumoral regions, no significant difference in all ADC indices was observed between metastases and glioblastomas. The AUC values for the mean cADC (0.877) and rcADC (0.819) values in enhancing regions were significantly higher than those for ADC0Hz5th (0.595; all p < 0.001).

Conclusions: The time-dependent diffusion MRI parameters may be useful for differentiating brain metastases from glioblastomas.

Keywords: Diffusion; Glioblastoma; Magnetic resonance imaging; Neoplasm metastasis.


Conflict of interest statement

Authors have no conflict of interest.

Figures

Fig. 1
Fig. 1
The study chart shows the inclusion and exclusion criteria and pathways for eligible patients in this study
Fig. 2
Fig. 2
Schematic representation of the diffusion gradient waveforms, (top line) and their corresponding diffusion encoding spectrums, |F(ω)|2, (bottom line) for pulsed gradient spin-echo (PGSE) (left) and oscillating gradient spin-echo (OGSE) (right). A 180° RF pulse is applied to the center of the gradient pair; therefore, the second gradient waveform acts as the opposite polarity. Δeff = Δ − δ/3. Δeff, effective diffusion time; Δ, diffusion gradient separation; δ, diffusion gradient pulse duration
Fig. 3
Fig. 3
A 74-year-old woman with glioblastoma, isocitrate dehydrogenase-wildtype, grade 4. A contrast-enhanced T1-weighted image with a region of interest of the enhancing region (red line) (a), a FLAIR image with a region of interest of peritumoral region (orange line) (b), an apparent diffusion coefficient (ADC) map derived from pulsed gradient spin-echo (PGSE) DWI at an effective diffusion time (Δeff) of 44.5 ms (c), an ADC map derived from oscillating gradient spin-echo (OGSE) DWI at an Δeff of 7.1 ms (d), and maps of ADC change between PGSE DWI and OGSE DWI (cADC) (e) and relative ADC change between PGSE DWI and OGSE DWI (rcADC) (f). The ADC values in the tumor appear higher at short Δeff values than at long Δeff setting. Small changes in cADC and rcADC are noted between the OGSE and PGSE sequences in the tumor
Fig. 4
Fig. 4
A 69-year-old man with a brain metastasis from colon cancer. A contrast-enhanced T1-weighted image with a region of interest of the enhancing region (red line) (a), a FLAIR image with a region of interest of peritumoral region (orange line) (b), an apparent diffusion coefficient (ADC) map derived from pulsed gradient spin-echo (PGSE) DWI at an effective diffusion time (Δeff) of 44.5 ms (c), an ADC map derived from oscillating gradient spin-echo (OGSE) DWI at an Δeff of 7.1 ms (d), and maps of ADC change between PGSE DWI and OGSE DWI (cADC) (e) and relative ADC change between PGSE DWI and OGSE DWI (rcADC) (f). The ADC values in the tumor appear higher at short Δeff values than at long Δeff setting. Large changes in cADC and rcADC are noted between the OGSE and PGSE sequences in the tumor
Fig. 5
Fig. 5
Box-whisker plots of ADC0Hzmean and ADC50Hzmean (a), ADC0Hz5th and ADC50Hz5th (b), and ADC0Hz95th and ADC50Hz95th (c) of enhancing regions for glioblastomas and brain metastases. For each tumor, each index for ADC50Hz was significantly higher than the corresponding index for ADC0Hz (each p < 0.01, respectively) (ac). Box-whisker plots of cADCmean (d), cADC5th (e), and cADC95th (f) of enhancing regions for glioblastomas and brain metastases. Each index for cADC was significantly higher in brain metastases than in glioblastomas (each p < 0.01, respectively). Box-whisker plots of rcADCmean (g), rcADC5th (h), and rcADC.95th (i) of enhancing regions for glioblastomas and brain metastases. Each index for rcADC was significantly higher in brain metastases than in glioblastomas (each p < 0.01, respectively). Statistical tests used: apaired-t test, bMann–Whitney U test
Fig. 6
Fig. 6
Box-whisker plots of ADC0Hzmean and ADC50Hzmean (a), ADC0Hz5th and ADC50Hz5th (b), and ADC0Hz95th and ADC50Hz95th (c) of peritumoral regions for glioblastomas and brain metastases. For each tumor, each index for ADC50Hz was significantly higher than the corresponding index for ADC0Hz (each p < 0.01, respectively) (ac). Box-whisker plots of cADCmean (d), cADC5th (e), and cADC95th (f) of peritumoral regions for glioblastomas and brain metastases. Box-whisker plots of rcADCmean (g), rcADC5th (h), and rcADC.95th (i) of peritumoral regions for glioblastomas and brain metastases. No significant difference in any of the three indices of ADC0Hz, ADC50Hz, cADC, and rcADC was observed between brain metastases and glioblastomas (Fig. 6a–i). Statistical tests used: apaired-t test, bMann–Whitney U test
Fig. 7
Fig. 7
Receiver operating characteristic curves of the most effective indices for ADC0Hz5th, ADC50Hz95th, cADCmean, and rcADCmean

References

    1. Giese A, Westphal M. Treatment of malignant glioma: a problem beyond the margins of resection. J Cancer Res Clin Oncol. 2001;127:217–25. 10.1007/s004320000188. 10.1007/s004320000188 - DOI - PubMed
    1. Oh J, Cha S, Aiken AH, Han ET, Crane JC, Stainsby JA, et al. Quantitative apparent diffusion coefficients and T2 relaxation times in characterizing contrast enhancing brain tumors and regions of peritumoral edema. J Magn Reson Imaging. 2005;21:701–8. 10.1002/jmri.20335. 10.1002/jmri.20335 - DOI - PubMed
    1. Chen L, Liu M, Bao J, Xia Y, Zhang J, Zhang L, et al. The correlation between apparent diffusion coefficient and tumor cellularity in patients: a meta-analysis. PLOS ONE. 2013;8:e79008. 10.1371/journal.pone.0079008. 10.1371/journal.pone.0079008 - DOI - PMC - PubMed
    1. Eidel O, Neumann JO, Burth S, Kieslich PJ, Jungk C, Sahm F, et al. Automatic analysis of cellularity in glioblastoma and correlation with ADC Using trajectory analysis and automatic nuclei counting. PLoS One. 2016;11:e0160250. 10.1371/journal.pone.0160250. 10.1371/journal.pone.0160250 - DOI - PMC - PubMed
    1. Surov A, Meyer HJ, Wienke A. Correlation between apparent diffusion coefficient (ADC) and cellularity is different in several tumors: a meta-analysis. Oncotarget. 2017;8:59492–9. 10.18632/oncotarget.17752. 10.18632/oncotarget.17752 - DOI - PMC - PubMed

MeSH terms