. 2023 Jan-Dec:28:2515690X231191101.
doi: 10.1177/2515690X231191101.

Antiproliferative and Anti-Inflammatory Activities of Deprungsith Formulation and Its Bioactive Compounds Against Mild Psoriasis and Potential of Metabolic Herb-Drug Interactions

Affiliations

Antiproliferative and Anti-Inflammatory Activities of Deprungsith Formulation and Its Bioactive Compounds Against Mild Psoriasis and Potential of Metabolic Herb-Drug Interactions

Kesara Na-Bangchang et al. J Evid Based Integr Med. 2023 Jan-Dec.

Abstract

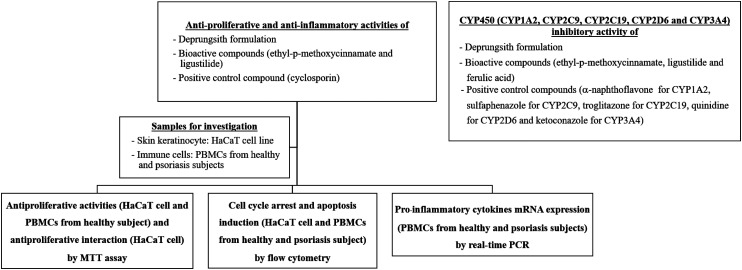
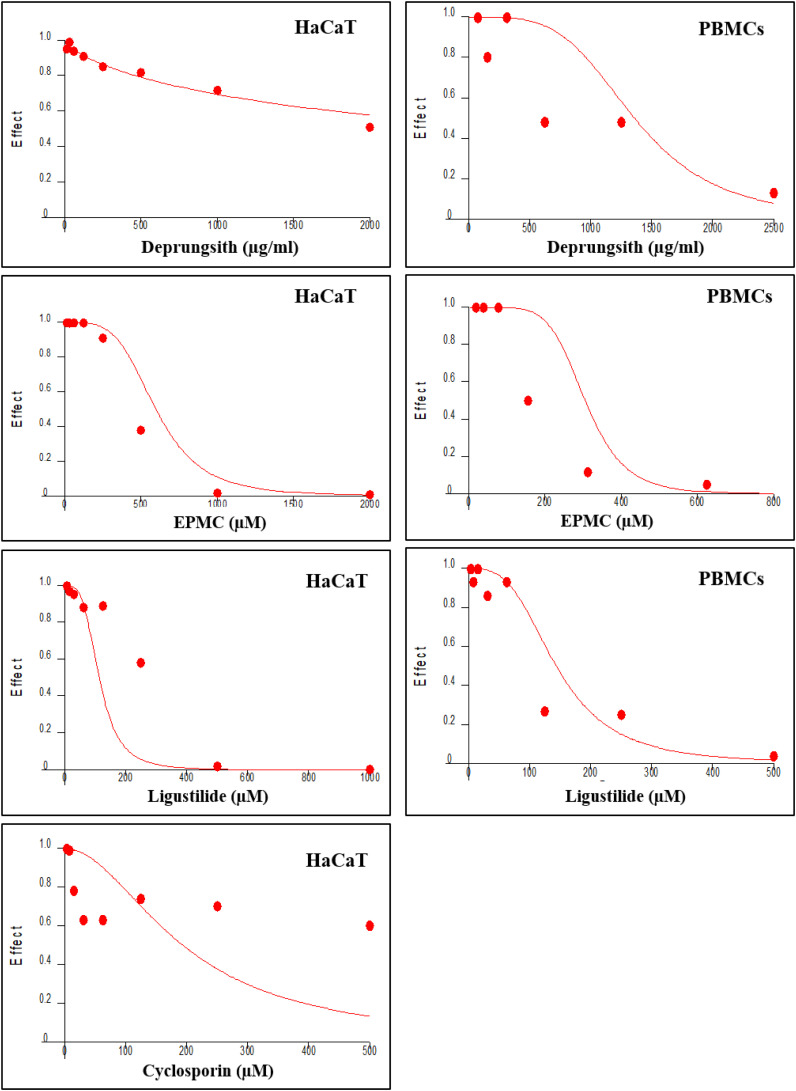
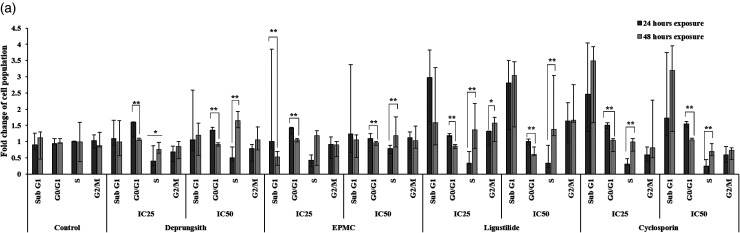
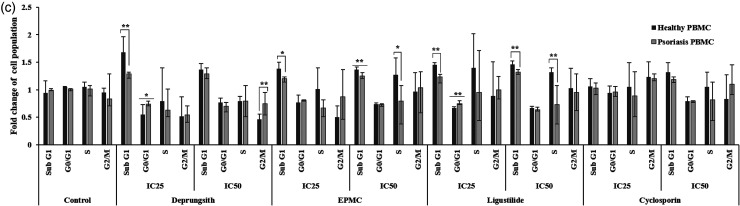
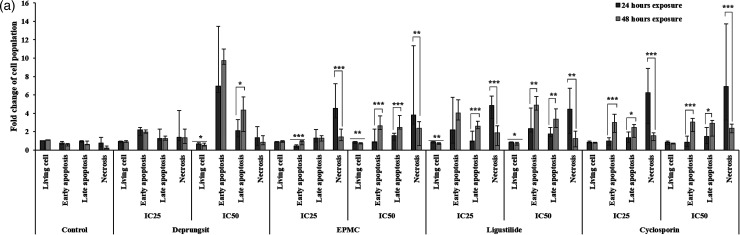
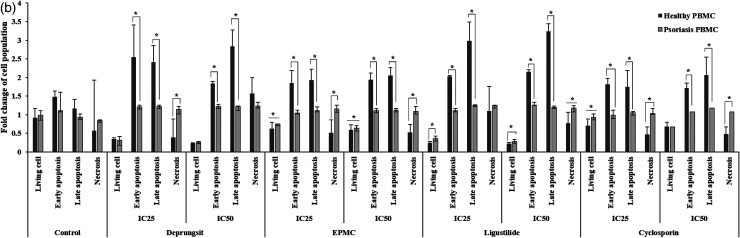
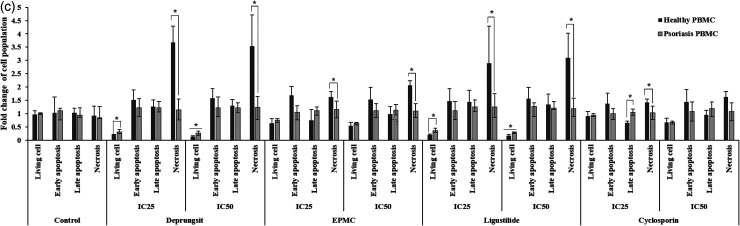
Psoriasis is an incurable, chronic and auto-immune skin disorder with a global prevalence rate of approximately 2-3%. The study investigated the antipsoriasis activities of Deprungsith formulation and its bioactive components and their potential for inhibitory activities on human cytochrome P450 (CYP450). HaCaT and peripheral blood mononuclear cells (PBMCs) from healthy volunteers (n = 9) and psoriasis patients (n = 10) were exposed to Deprungsith formulation (Thai traditional medicine for psoriasis consisting of 16 plants), ethyl p-methoxycinnamate (EPMC), ligustilide and cyclosporin for 24 and 48 h. The antiproliferative, cell apoptosis and cell cycle arrest activities were evaluated using MTT assay and flow cytometry, respectively. The pro-inflammatory cytokine mRNA expression levels were measured using real-time polymerase chain reaction (RT-PCR). The CYP450 inhibitory effect was investigated using a bioluminescent-based CYP450 assay. Deprungsith formulation and the bioactive compounds inhibited HaCaT cells and PBMCs with weak to moderate potencies. EPMC and ligustilide combination produced an additive effect. Most substances arrested cell transition at sub-G1 and S phases, leading to early and late apoptosis induction. With prolonged exposure (48 h), all test substances decreased PBMCs necrosis. The mRNA expression of all pro-inflammatory cytokines was downregulated. Deprungsith formulation, EPMC, ligustilide and ferulic acid inhibited CYP1A2, CYP2C9, CYP2D6 and CYP3A4 activities with weak to moderate potencies. Deprungsith formulation and bioactive components induced cell apoptosis by inhibiting cell transition at specific cell cycle phases, which was correlated with the mRNA downregulation of interleukin (IL-6, IL-12p19, IL-23) and tumor necrosis factor (TNF-α). There is a low risk of potential adverse drug reactions and toxicity due to CYP450 interaction when Deprungsith formulation is concurrently administered with modern medicines.

Keywords: antipsoriasis; cytochrome P450 interaction; deprungsith formulation; ethyl p-methoxycinnamate; ligustilide.


Conflict of interest statement

The authors declared no potential conflicts of interest with respect to the research, authorship, and/or publication of this article.

Figures

Figure 1.
Figure 1.
Study framework to investigate antiproliferative and anti-inflammatory activities as well as herb-drug interactions of Deprungsith extract formulation and its bioactive compounds.
Figure 2.
Figure 2.
Representative concentration-inhibitory effect curves of HaCaT cell and PBMCs (obtained from healthy subject) following exposure to Deprungsith formulation, EPMC, ligustilide and cyclosporin. The inhibitory concentration of cyclosporin in PBMCs was adopted from previous study.
Figure 3.
Figure 3.
Isobologram of the interaction between EPMC and ligustilide (additive interaction with sum FIC 0.9-1.1).
Figure 4.
Figure 4.
Representative cell cycle analysis histogram of HaCaT cell and PBMCs following exposure to Deprungsith formulation, EPMC, ligustilide and cyclosporin for 24 and 48 h. Figure 4a. Cell cycle analysis of HaCaT cells following exposure to Deprungsith formulation, EPMC, ligustilide and cyclosporin for 24 and 48 h (* and ** represent significant differences of cell population changing between H24 and H48, p-value ≤ 0.05 and ≤ 0.01). Figure 4b. Cell cycle analysis of PBMCs from psoriasis patients and healthy subjects following exposure to Deprungsith formulation, EPMC, ligustilide and cyclosporin for 24 h (* represents significant difference of cell population changing between healthy and psoriasis PBMC, p-value ≤ 0.01). Figure 4c. Cell cycle analysis of PBMCs from psoriasis patients and healthy subjects following exposure to Deprungsith formulation, EPMC, ligustilide and cyclosporin for 48 h (* and ** represent significant difference of cell population changing between healthy and psoriasis PBMC, p-value ≤ 0.01 and 0.05, respectively).
Figure 4.
Figure 4.
Representative cell cycle analysis histogram of HaCaT cell and PBMCs following exposure to Deprungsith formulation, EPMC, ligustilide and cyclosporin for 24 and 48 h. Figure 4a. Cell cycle analysis of HaCaT cells following exposure to Deprungsith formulation, EPMC, ligustilide and cyclosporin for 24 and 48 h (* and ** represent significant differences of cell population changing between H24 and H48, p-value ≤ 0.05 and ≤ 0.01). Figure 4b. Cell cycle analysis of PBMCs from psoriasis patients and healthy subjects following exposure to Deprungsith formulation, EPMC, ligustilide and cyclosporin for 24 h (* represents significant difference of cell population changing between healthy and psoriasis PBMC, p-value ≤ 0.01). Figure 4c. Cell cycle analysis of PBMCs from psoriasis patients and healthy subjects following exposure to Deprungsith formulation, EPMC, ligustilide and cyclosporin for 48 h (* and ** represent significant difference of cell population changing between healthy and psoriasis PBMC, p-value ≤ 0.01 and 0.05, respectively).
Figure 5.
Figure 5.
Representative cell death (apoptosis and necrosis) scatter plot of HaCaT cell and PBMCs following exposure to Deprungsith formulation, EPMC, ligustilide and cyclosporin for 24 and 48 h. Figure 5a. HaCaT cell death (apoptosis and necrosis) following exposure to Deprungsith formulation, EPMC, ligustilide and cyclosporin for 24 and 48 h (*, ** and *** represent significant difference of cell population changing between H24 and H48, p-value ≤ 0.05, ≤ 0.01 and ≤ 0.001). Figure 5b. The death (apoptosis and necrosis) of PBMCs following exposure to Deprungsith formulation, EPMC, ligustilide and cyclosporin for 24 h (* represents significant difference of cell population changing between healthy and psoriasis PBMC, p-value ≤ 0.01). Figure 5c. The death (apoptosis and necrosis) of PBMCs following exposure to Deprungsith formulation, EPMC, ligustilide and cyclosporin for 48 h (* represents significant difference of cell population changing between healthy and psoriasis PBMC, p-value ≤ 0.01).
Figure 5.
Figure 5.
Representative cell death (apoptosis and necrosis) scatter plot of HaCaT cell and PBMCs following exposure to Deprungsith formulation, EPMC, ligustilide and cyclosporin for 24 and 48 h. Figure 5a. HaCaT cell death (apoptosis and necrosis) following exposure to Deprungsith formulation, EPMC, ligustilide and cyclosporin for 24 and 48 h (*, ** and *** represent significant difference of cell population changing between H24 and H48, p-value ≤ 0.05, ≤ 0.01 and ≤ 0.001). Figure 5b. The death (apoptosis and necrosis) of PBMCs following exposure to Deprungsith formulation, EPMC, ligustilide and cyclosporin for 24 h (* represents significant difference of cell population changing between healthy and psoriasis PBMC, p-value ≤ 0.01). Figure 5c. The death (apoptosis and necrosis) of PBMCs following exposure to Deprungsith formulation, EPMC, ligustilide and cyclosporin for 48 h (* represents significant difference of cell population changing between healthy and psoriasis PBMC, p-value ≤ 0.01).
Figure 6.
Figure 6.
(a) mRNA expression of the pro-inflammatory cytokines (IL-6, IL-23A, TNF-α and IL-12p19) released from the PBMCs of psoriasis patients and healthy subjects following exposure to Deprungsith formulation, EPMC, ligustilide and cyclosporin for 24 h. (b) mRNA expression of the pro-inflammatory cytokines (IL-6, IL-23A, TNF-α and IL-12p19) released from the PBMCs of psoriasis patients and healthy subjects following exposure to Deprungsith formulation, EPMC, ligustilide and cyclosporin for 48 h.
Figure 7.
Figure 7.
Representative concentration-inhibitory effect curves of the test compounds with moderate inhibitory activity on CYP1A2 (Deprungsith formulation and ligustilide), CYP2C9 (Dephrungsit extract), 2D6 (ferulic acid and EPMC) and CYP3A4 (ligustilide).

Similar articles

Cited by

References

    1. Zhou X, Chen Y, Cui L, Shi Y, Guo C. Advances in the pathogenesis of psoriasis: From keratinocyte perspective. Cell Death Dis. 2022;13(1):81‐90. - PMC - PubMed
    1. Archananupab S. textbook of general physical examination on 350 diseases. Holistics Publishing; 2008, (in Thai).
    1. Ayala-Fontánez N, Soler DC, McCormick TS. Current knowledge on psoriasis and autoimmune diseases. Psoriasis (Auckl). 2016;6(1):7‐32. - PMC - PubMed
    1. Kim WB, Jerome D, Yeung J. Diagnosis and management of psoriasis. Can Fam Physician. 2017 Apr;63(4):278‐285. - PMC - PubMed
    1. Albanesi C. Immunology of psoriasis. In: Clinical immunology. Elsevier; 2019:871‐878.

Publication types

MeSH terms