. 2023 Aug;20(205):20220912.
doi: 10.1098/rsif.2022.0912. Epub 2023 Aug 9.

Reconstructing multi-strain pathogen interactions from cross-sectional survey data via statistical network inference

Affiliations

Reconstructing multi-strain pathogen interactions from cross-sectional survey data via statistical network inference

Irene Man et al. J R Soc Interface. 2023 Aug.

Abstract

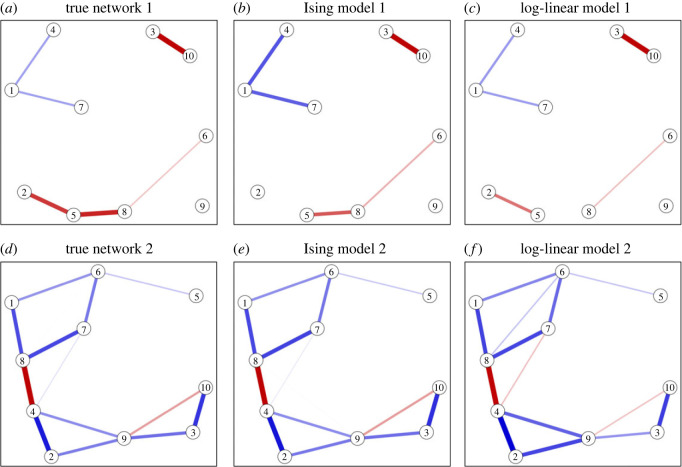
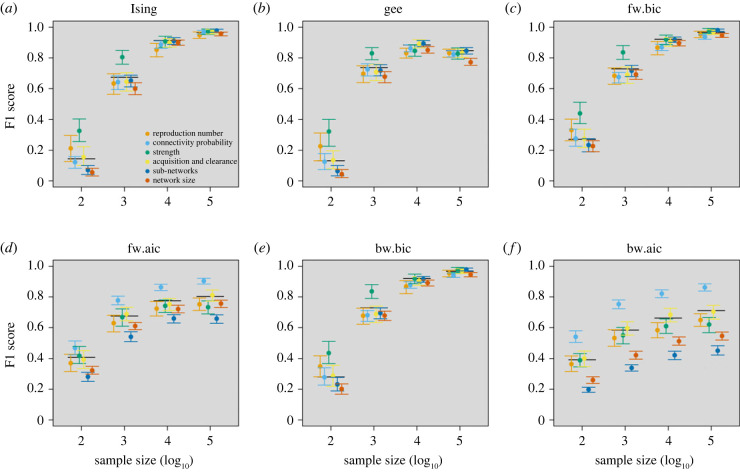
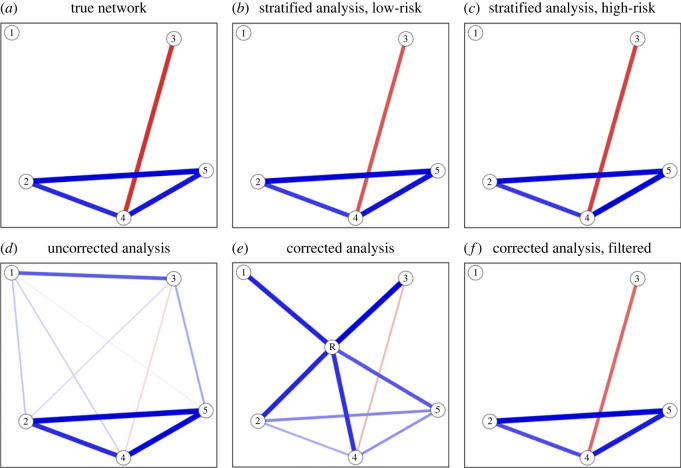
Infectious diseases often involve multiple pathogen species or multiple strains of the same pathogen. As such, knowledge of how different pathogens interact is key to understand and predict the outcome of interventions targeting only a subset of species or strains involved in disease. Population-level data may be useful to infer pathogen strain interactions, but most previously used inference methods only consider uniform interactions between all strains or focus on marginal pairwise interactions. As such, these methods are prone to bias induced by indirect interactions through other strains. Here, we evaluated statistical network inference for reconstructing heterogeneous interactions from cross-sectional surveys detecting joint presence/absence patterns of pathogen strains within hosts. We applied various network models to simulated survey data, representing endemic infection states of multiple pathogen strains with potential interactions in acquisition or clearance of infection. Satisfactory performance was demonstrated by the estimators converging to the true interactions. Accurate reconstruction of interaction networks was achieved by regularization or penalization for sample size. Although performance deteriorated in the presence of host heterogeneity, this was overcome by correcting for individual-level risk factors. Our work demonstrates how statistical network inference could prove useful for detecting multi-strain pathogen interactions and may have applications beyond epidemiology.

Keywords: cross-sectional data; interactions; multi-strain; network inference; pathogen.


Conflict of interest statement

The authors have declared that no competing interests exist.

Figures

Figure 1.
Figure 1.
Examples of networks with n = 10 strains in the simulation study. Two random networks generated with connection probability σ = 0.25 and interaction strengths xij drawn from (−θ, θ) = (−log 3, log 3) (a,d). Estimated networks from co-occurrence in 100 000 observations according to the regularized Ising model (b,e); and according to a graphical model using backward model selection by BIC (c,f). Strength and type of interactions (mutualistic versus competitive) are indicated by the thickness and colour (blue versus red) of edges, respectively.
Figure 2.
Figure 2.
Performance measures of statistical network inference in the base-case analysis. Several measures have been calculated to assess the performance of the statistical network inference as a function of the sample size for the base-case analysis. (a) Sensitivity; (b) positive predictive value (PPV); (c) F1 score; (d) specificity; (e) coverage; (f) root-mean-square deviation. In the base-case analysis, interactions between strains were generated with connection probability σ = 0.25, interaction strengths xij indicating interaction in acquisition drawn from (−log 3, log 3), and basic reproduction numbers randomly drawn from (1.5, 3). All methods were evaluated at sample sizes of 100, 1000, 10 000 and 100 000 observations, but x-axis coordinates are slightly jittered to improve visualization. Abbreviations: bw.aic (dark blue): graphical model with backward AIC selection; bw.bic (yellow): graphical model with backward BIC selection; fw.aic (green): graphical model with forward AIC selection; fw.bic (light blue): graphical model with forward BIC selection; gee (orange): generalized estimating equations; Ising (black): Ising model.
Figure 3.
Figure 3.
F1-scores of statistical network inference methods in the sensitivity analyses. The performance of different network inference methods expressed by F1-score as a function of the sample size. (a) Ising model; (b) generalized estimating equations; and graphical models with (c) forward BIC selection, (d) forward AIC selection, (e) backward BIC selection, (f) backward AIC selection. The alternative settings considered in the sensitivity analyses were: acquisition and clearance (yellow): interaction strengths xij including both interactions in acquisition and clearance; reproduction number (orange): lower basic reproduction numbers from the range (1, 2) instead of (1.5, 3); strength (green): strong interaction strengths xij drawn from (−log 10, log 10) instead of (−log 3, log 3); network size (brown): larger networks with 10 strains; sub-networks (dark blue): larger networks with 10 strains created by collating sub-networks of strains; connection probability (light blue): higher connection probability σ being 0.5 instead of 0.25. Performance of the base-case analysis is given by black horizontal lines.
Figure 4.
Figure 4.
F1-scores of statistical network inference under host heterogeneity. The performance of the different inference methods evaluated under the setting with host heterogeneity as a function of the sample size. (a) Ising model; (b) generalized estimating equations; and graphical models with (c) forward BIC selection, (d) forward AIC selection, (e) backward BIC selection, (f) backward AIC selection. Similar epidemiological models are used as in figure 2, but with two sub-populations of hosts. Average contact rate is the same as in the base-case analysis, but 80% of hosts is assumed to have below-average contacts and 20% above-average contacts (coefficient of variation: 80%). Mixing between sub-populations occurred pseudo-assortatively (assortivity fraction: 50%). Performance is investigated in following ways: uncorrected (orange): based on representatively sampled individuals from the total population without correction for contact rate; corrected (light blue): the same but with correction for contact rate; low-risk (green): (stratified) analysis on individuals sampled from sub-population with low contact rate only; high-risk (yellow): (stratified) analysis on individuals sampled from sub-population with high contact rate only.
Figure 5.
Figure 5.
An example of network reconstruction under host heterogeneity. The true random network was generated with connection probability σ = 0.25, interaction strengths drawn from (−log 3, log 3), and basic reproduction numbers randomly drawn from (1.5, 2) (a). Estimated networks were obtained using the regularized Ising model from a dataset with 10 000 individuals in a stratified analysis among low-risk individuals only (b), high-risk individuals only (c), among a representative sample of the total population without correction (d), or with correction by augmenting the network with an extra node R, indicating membership to either sub-population (e). The filtered network (f) is obtained from (e) by omitting node R and the corresponding edges. Strength and type of interactions (mutualistic versus competitive) are indicated by the thickness and colour (blue versus red) of edges, respectively.

References

    1. Budden KF, et al. 2019. Functional effects of the microbiota in chronic respiratory disease. Lancet Respir. Med. 7, 907-920. (10.1016/S2213-2600(18)30510-1) - DOI - PubMed
    1. Rowe HM, Meliopoulos VA, Iverson A, Bomme P, Schultz-Cherry S, Rosch JW. 2019. Direct interactions with influenza promote bacterial adherence during respiratory infections. Nat. Microbiol. 4, 1328-1336. (10.1038/s41564-019-0447-0) - DOI - PMC - PubMed
    1. Cobey S, Lipsitch M. 2012. Niche and neutral effects of acquired immunity permit coexistence of pneumococcal serotypes. Science 335, 1376-1380. (10.1126/science.1215947) - DOI - PMC - PubMed
    1. Egawa N, Egawa K, Griffin H, Doorbar J. 2015. Human papillomaviruses; epithelial tropisms, and the development of neoplasia. Viruses 7, 3863-3890. (10.3390/v7072802) - DOI - PMC - PubMed
    1. Lerch A, Koepfli C, Hofmann NE, Kattenberg JH, Rosanas-Urgell A, Betuela I, Mueller I, Felger I. 2019. Longitudinal tracking and quantification of individual Plasmodium falciparum clones in complex infections. Sci. Rep. 9, 3333. (10.1038/s41598-019-39656-7) - DOI - PMC - PubMed

Publication types

MeSH terms

LinkOut - more resources