. 2023 Jul 16;13(12):4182-4196.
doi: 10.7150/thno.83714. eCollection 2023.

Endothelial TAZ inhibits capillarization of liver sinusoidal endothelium and damage-induced liver fibrosis via nitric oxide production

Affiliations

Endothelial TAZ inhibits capillarization of liver sinusoidal endothelium and damage-induced liver fibrosis via nitric oxide production

Jun-Ha Hwang et al. Theranostics. .

Abstract

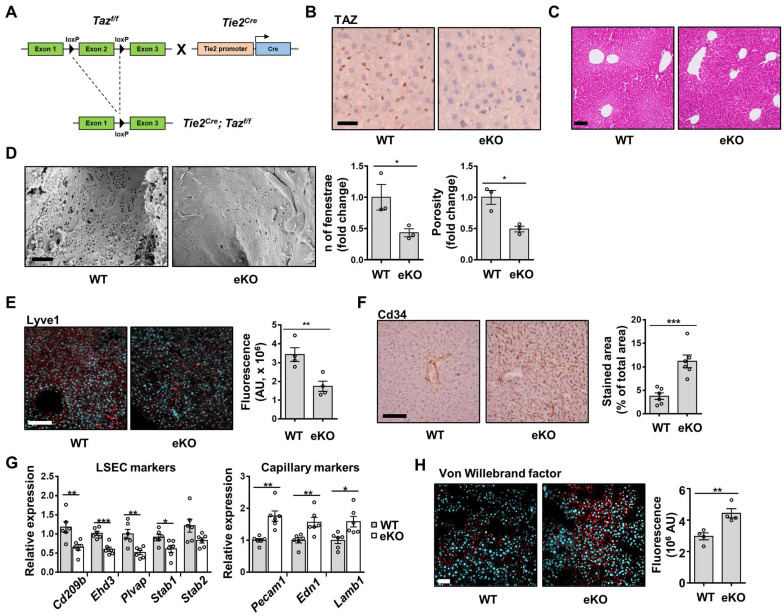
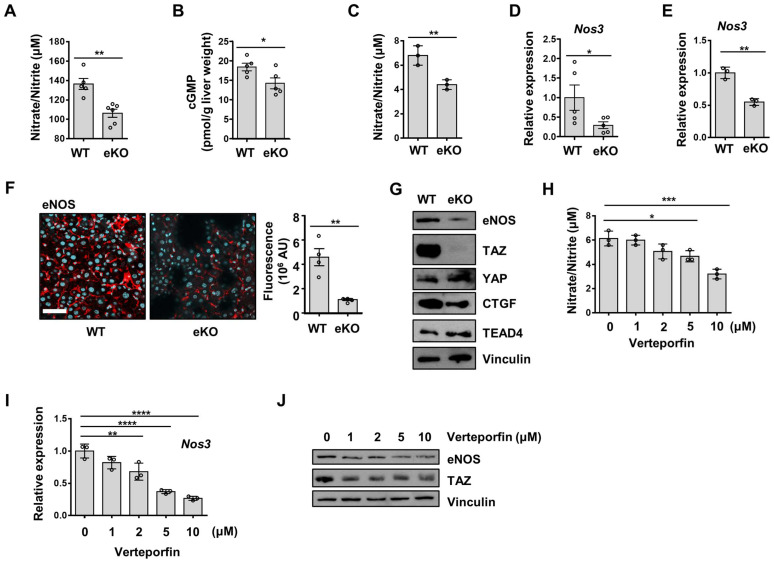
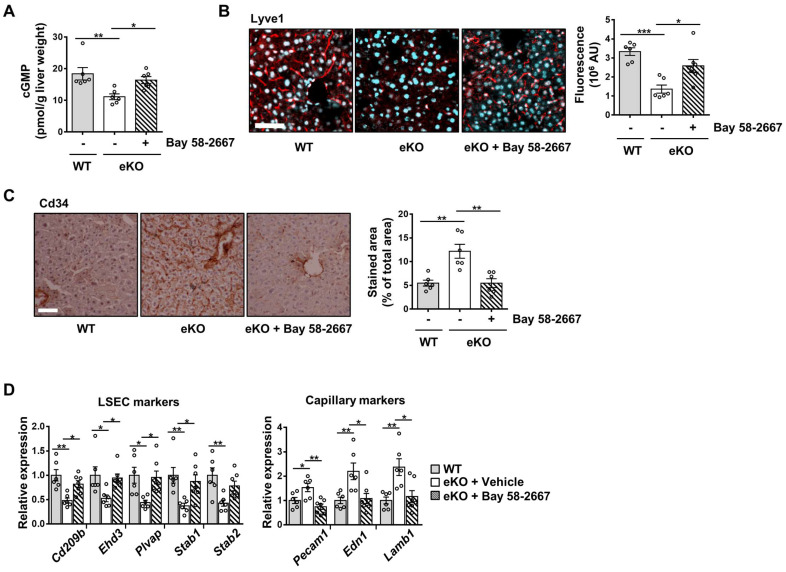
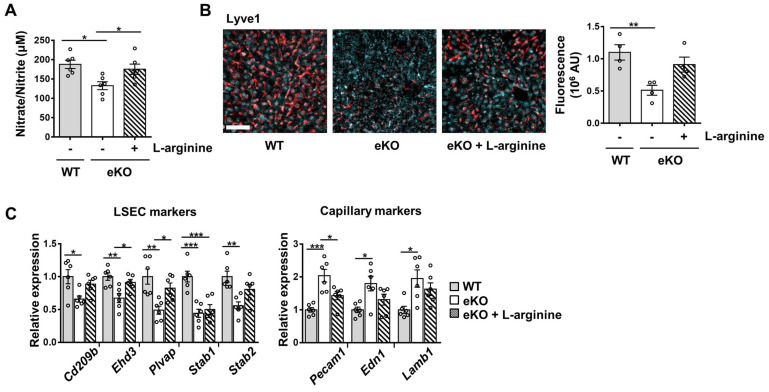
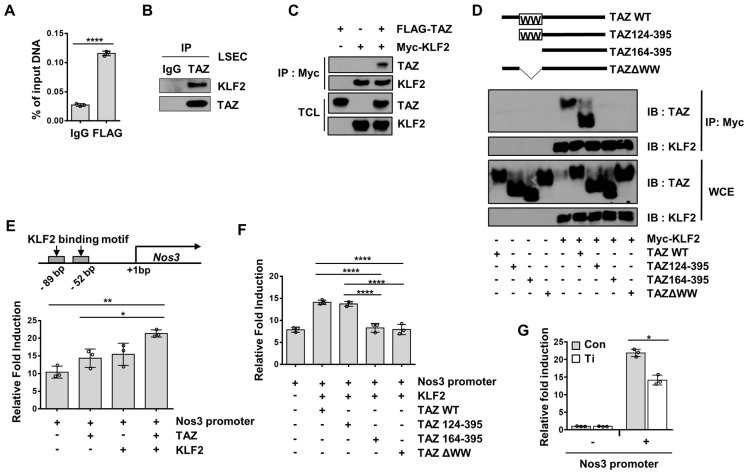
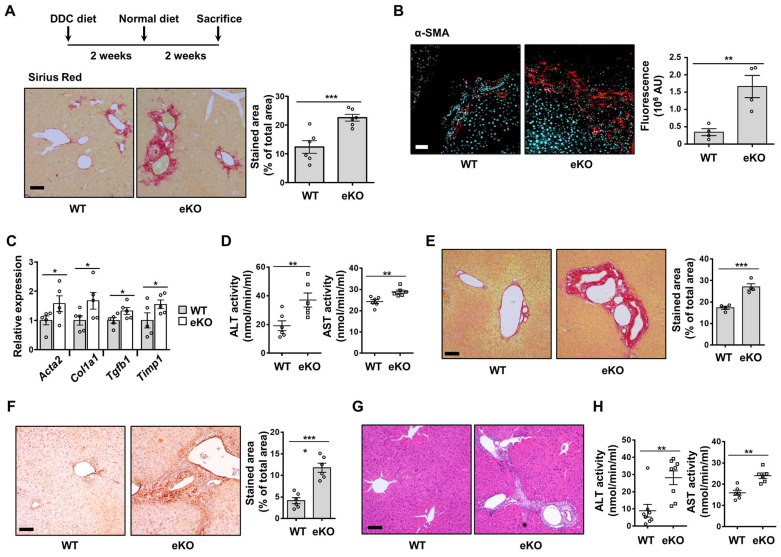
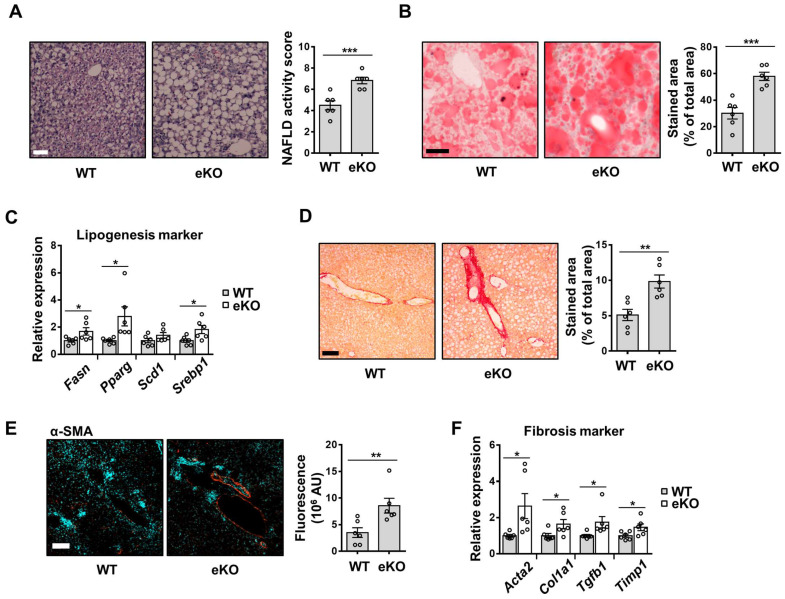
Background: Endothelial dysfunction is a systemic disorder and is involved in the pathogenesis of several human diseases. Hemodynamic shear stress plays an important role in vascular homeostasis including nitric oxide (NO) production. Impairment of NO production in endothelial cells stimulates the capillarization of liver sinusoidal endothelial cells, followed by hepatic stellate cell activation, inducing liver fibrosis. However, the detailed mechanism underlying NO production is not well understood. In hepatocytes, transcriptional co-activator with PDZ-binding motif (TAZ) has been reported to be involved in liver fibrosis. However, the role of endothelial TAZ in liver fibrosis has not been investigated. In this study, we uncovered the role TAZ in endothelial cell NO production, and its subsequent effects on liver fibrosis. Methods: TAZ-floxed mice were crossed with Tie2-cre transgenic mice, to generate endothelium-specific TAZ-knockout (eKO) mice. To induce liver damage, a 3,5-diethoxycarboncyl-1,4-dihydrocollidine, methionine-choline-deficient diet, or partial hepatectomy was applied. Liver fibrosis and endothelial dysfunction were analyzed in wild-type and eKO mice after liver damage. In addition, liver sinusoidal endothelial cell (LSEC) was used for in vitro assays of protein and mRNA levels. To study transcriptional regulation, chromatin immunoprecipitation and luciferase reporter assays were performed. Results: In liver of eKO mice, LSEC capillarization was observed, evidenced by loss of fenestrae and decreased LSEC-specific marker gene expression. LSEC capillarization of eKO mouse is caused by downregulation of endothelial nitric oxide synthase expression and subsequent decrease in NO concentration, which is transcriptionally regulated by TAZ-KLF2 binding to Nos3 promoter. Diminished NO concentration by TAZ knockout in endothelium accelerates liver fibrosis induced by liver damages. Conclusions: Endothelial TAZ inhibits damage-induced liver fibrosis via NO production. This highlights an unappreciated role of TAZ in vascular health and liver diseases.

Keywords: Endothelial dysfunction; Endothelial nitric oxide synthase; Liver fibrosis; Liver sinusoidal endothelial cells; Nitric oxide.


Conflict of interest statement

Competing Interests: The authors have declared that no competing interest exists.

Figures

Figure 1
Figure 1
Endothelial TAZ-knockout induces the capillarization of liver sinusoidal endothelial cells. A) Strategy for development of endothelial-specific TAZ-knockout (eKO) mice. LoxP-flanked exon 2 region of TAZ was deleted using endothelial-specific cre-recombinase. B) Immunostaining of TAZ in wild-type (WT) and eKO mouse livers. Cell nuclei were counterstained with Mayer's hematoxylin. Scale bar = 20 μm. C) The histological phenotypes of WT and eKO livers were assessed using H&E staining. Scale bar = 50 μm. D) Fenestrae of liver sinusoidal endothelial cells of WT and eKO mice were visualized using a scanning electron microscope. Provided data are representative images from plural mice. Number of fenestrae and porosity was measured and calculated using ImageJ software (n = 3). Scale bar = 1 μm. E) WT and eKO mice livers were immunostained with an anti-Lyve1 antibody. 4′,6-diamidino-2-phenylindole (DAPI) was used for nucleus counterstaining. Fluorescence was measured using ImageJ software and presented as an arbitrary unit (n = 4). Scale bar = 100 μm. F) WT and eKO mouse livers were immunostained with an anti-Cd34 antibody. DAB signal intensity was assessed and calculated using ImageJ (n = 6). Scale bar = 100 μm. G) Expression of the indicated LSEC and capillary marker genes was analyzed using quantitative real-time-polymerase chain reaction (n = 6). H) Expression of Von Willebrand factor was assessed using immunofluorescence. The cell nucleus was counterstained with DAPI. The fluorescence signal was measured and calculated using ImageJ (n = 4). Scale bar = 50 μm. Eight to ten-week-old mice were used for all panels. Data are presented as mean ± SEM. (*P < 0.05, **P < 0.01, and ***P < 0.0005, using two-tailed Student's t-test).
Figure 2
Figure 2
Endothelial TAZ depletion decreases NO production. A) Serum was isolated from wild-type (WT) and endothelial-specific TAZ-knockout (eKO) mice, to quantify the nitric oxide (NO) levels. The NO levels were measured using an NO quantification assay kit (n = 5 for WT mice and n = 6 for eKO mice). B) Liver homogenates were prepared from WT and eKO mice. cGMP mass was normalized to the wet weight of the used liver (n = 5). C) WT and eKO liver sinusoidal endothelial cells (LSECs) were seeded on culture plates. The NO in the culture media was quantified at 24 h after seeding. D) Nos3 gene transcription was analyzed using quantitative real-time-polymerase chain reaction (qRT-PCR) in liver of WT and eKO mice (n = 5). E) Nos3 gene transcription in the WT and eKO LSECs was assessed using qRT-PCR. F) WT and eKO mice livers were immunostained with anti-eNOS antibodies (red). Nuclei were counterstained with 4′,6-diamidino-2-phenylindole (DAPI, blue). The presented data are representative images of multiple mice. The stained area was measured and calculated using ImageJ software (n = 4). Scale bar = 50 μm. G) Levels of indicated proteins in the WT and eKO LSECs were analyzed using immunoblotting. Vinculin was used as a loading control. H) LSECs were treated with verteporfin at the indicated concentration, for 24 h. The NO levels in the culture media were quantified using a NO quantification assay kit. I) The Nos3 transcription levels in panel H were analyzed using qRT-PCR. J) eNOS proteins in panel H were analyzed using immunoblot assay. The experiment was carried out in triplicate (C, E, H, and I). Eight to ten-week-old mice were used for all panels. Data are presented as mean ± SEM (A, B, D, and F) or mean ± SD (C, E, H, and I). (*P < 0.05, **P < 0.01, ***P < 0.0005, and **** P < 0.0001, A-C; as assessed using two-tailed Student's t-test, D-F; as assessed using one-tailed Student's t-test, H-I; as assessed using one-way ANOVA with Tukey's multiple-comparison test).
Figure 3
Figure 3
Rescued nitric oxide signaling restores the levels of sinusoidal endothelial markers in endothelial TAZ-KO mice. A) cGMP levels were quantified in the liver homogenates of wild-type (WT) mice and vehicle- or sGC activator (BAY 58-2667)-administered endothelial TAZ-knockout (eKO) mice. Data were normalized to the used liver weight (n = 6). B) Liver tissues in panel A were immunostained using anti-Lyve1 antibodies (red). The cell nuclei were counterstained with 4′,6-diamidino-2-phenylindole (DAPI, cyan). Fluorescence was quantified using ImageJ software and presented as arbitrary units (AUs) (n = 6). Scale bar = 50 μm. C) The liver tissues in panel A were immunostained with anti-Cd34 antibodies. The stained area was calculated using ImageJ (n = 6). Scale bar = 100 μm. D) Mouse liver transcripts in panel A were analyzed using quantitative real-time-polymerase chain reaction, to quantify transcripts of the indicated LSEC and capillary marker genes (n = 6). Eight to ten-week-old mice were used for all panels. Data are presented as mean ± SEM. (*P < 0.05, **P < 0.01, and ***P < 0.0005, as assessed using one-way ANOVA with Tukey's multiple-comparison test).
Figure 4
Figure 4
Addition of nitric oxide (NO) restores the level of sinusoidal endothelial markers in endothelial TAZ-KO mice. A) NO levels were analyzed in the serum of wild-type (WT) and endothelial TAZ-knockout (eKO) mice provided or not provided with 25 g/L of L-arginine (n = 6). B) Liver tissues in panel A were immunostained with anti-Lyve1 antibodies, and the fluorescence was quantified using ImageJ (n = 4). Scale bar = 50 μm. C) Gene expression of LSEC and capillary markers in panel A was assessed using quantitative real-time-polymerase chain reaction (n = 6). Eight to ten-week-old mice were used for all panels. Data are presented as mean ± SEM. (*P < 0.05, **P < 0.01, and ***P < 0.0005, as assessed using one-way ANOVA with Tukey's multiple-comparison test).
Figure 5
Figure 5
TAZ regulates Nos3 gene transcription with the KLF2 transcription factor. A) Liver sinusoidal endothelial cells (LSECs) were assessed using chromatin immunoprecipitation-quantitative polymerase chain reaction, to evaluate the recruitment of TAZ on the Nos3 promoter region. B) LSECs were immunoprecipitated with anti-TAZ antibodies and the interaction between TAZ and KLF2 was confirmed using immunoblot assay. IgG was used as an immunoprecipitation control. C) Physical interaction of FLAG-tagged TAZ and Myc-tagged KLF2 was verified in HEK293T cells, through a co-immunoprecipitation assay. D) Wild-type (WT) or deletion mutants of TAZ plasmids were introduced into HEK293T cells, along with a Myc-tagged KLF2 expression plasmid. Interaction of TAZ and KLF2 was confirmed using immunoprecipitation with Myc-tag antibodies. WCE, whole cell extracts. E) Transcriptional activity of the Nos3 promoter-containing luciferase reporter construct was analyzed using a reporter gene assay. The constructed vector was introduced into HEK293T cells, along with the TAZ- and/or KLF2-expressing plasmid. pRL-null renilla luciferase plasmid was used for normalization. F) TAZ-WT or -deletion mutant plasmids were transfected into HEK293T cells, along with pGL3-Nos3 promoter and Myc-KLF2 plasmids. Transcriptional activity was assessed via a luciferase reporter gene assay. G) Control (Con) and TAZ-knockdown (Ti) MS-1 cells were transfected with the pGL3-Nos3 promoter, along with pRL-null renilla luciferase plasmid. Transcriptional activity was assessed using a luciferase reporter gene assay. The experiment was done in triplicate (A, E, F, and G). Eight to ten-week-old mice were used for panel A and B. Data are shown as mean ± SD (*P < 0.05, **P < 0.01, ***P < 0.0005, and ****P < 0.0001, A; as assessed using two-tailed Student's t-test, E and F; as assessed using one-way ANOVA with Tukey's multiple-comparison test, G; as assessed using two-way ANOVA with Sidak's multiple-comparison test).
Figure 6
Figure 6
DDC diet-induced liver fibrosis deteriorates in endothelial TAZ-knockout mice. A) Wild-type (WT) and endothelial TAZ-knockout (eKO) mice were fed with a 3,5-diethoxycarbonyl-1,4-dihydrocollidine (DDC) diet, following which their livers were analyzed using Sirius Red staining, to evaluate the degree of fibrosis. The presented data are representative images from multiple mice. The stained area was measured and calculated using ImageJ software (n = 6). Scale bar = 100 μm. B) The liver in panel A was immunostained using anti-alpha smooth muscle actin (α-SMA) antibodies. The stained area was measured and calculated using ImageJ software (n = 6). Representative images have been shown from multiple mice. Scale bar = 100 μm. C) Total RNA was isolated from livers in panel A and transcription levels of fibrosis marker genes were assessed using quantitative reverse transcription-polymerase chain reaction. Target gene transcription was normalized to that of Gapdh. D) Serum isolated from WT and eKO mice was analyzed to determine alanine aminotransferase (ALT) and aspartate aminotransferase (AST) activity (n = 6). E) Partial hepatectomy (PHx) was conducted in WT and eKO mice, following which the livers were subjected to Sirius Red staining, at 8 d after PHx. Provided data are representative images from multiple mice. The stained area was measured and analyzed using ImageJ (n = 4). Scale bar = 100 μm. F) Livers in panel E were immunostained using α-SMA antibodies. The stained area was measured and analyzed using ImageJ (n = 6). Scale bar = 100 μm. G) Livers in panel E were subjected to H&E staining. Scale bar = 100 μm. H) Serum of mice in panel E was analyzed to determine the alanine aminotransferase (ALT) and aspartate aminotransferase (AST) activity (n = 8 for ALT and n = 6 for AST). Eight to ten-week-old mice were used for all panels. Data are presented as mean ± SEM. (*P < 0.05, **P < 0.01, and ***P < 0.0005, as assessed using a one-tailed Student's t-test).
Figure 7
Figure 7
MCD diet-induced NAFLD and NASH is aggravated in endothelial TAZ-knockout mouse. A) Wild-type (WT) and endothelial TAZ-knockout (eKO) mice were fed with a methionine-choline-deficient (MCD) diet, for 4 weeks. WT and eKO mice livers were analyzed using H&E staining. The NAFLD activity score was calculated in terms of steatosis area, number of lobular inflammation foci, and degree of hepatocyte ballooning (n = 6). Scale bar = 50 μm. B) The liver in panel A was cryosectioned, following which the lipid droplet was subjected to Oil Red O staining. The fraction of stained area was measured using ImageJ (n = 6). Scale bar = 50 μm. C) Transcripts of mouse livers in panel A were analyzed using quantitative real-time-polymerase chain reaction (qRT-PCR), to quantify the gene expression of lipogenesis markers (Fasn, Pparg, Scd1, and Srebp1) (n = 6). D) To visualize collagen accumulation, mouse livers in panel A were subjected to Sirius Red staining. The stained area was measured and analyzed using ImageJ (n = 6). Scale bar = 100 μm. E) The liver in panel A was stained for alpha smooth muscle actin (α-SMA). The stained area was calculated using ImageJ (n = 6). Scale bar = 100 μm. F) The transcripts of mouse livers in panel A were measured and analyzed using qRT-PCR, to quantify the gene transcription of fibrosis markers (Acta2, Col1a1, Tgfb1, and Timp1) (n = 6). Eight to ten-week-old mice were used for all panels. Data are presented as mean ± SEM. (*P < 0.05, **P < 0.01, and ***P < 0.0005, as assessed using a one-tailed Student's t-test).

References

    1. Poisson J, Lemoinne S, Boulanger C, Durand F, Moreau R, Valla D. et al. Liver sinusoidal endothelial cells: Physiology and role in liver diseases. J Hepatol. 2017;66:212–27. - PubMed
    1. Gracia-Sancho J, Caparros E, Fernandez-Iglesias A, Frances R. Role of liver sinusoidal endothelial cells in liver diseases. Nature reviews Gastroenterology & hepatology. 2021;18:411–31. - PubMed
    1. Sorensen KK, Simon-Santamaria J, McCuskey RS, Smedsrod B. Liver Sinusoidal Endothelial Cells. Compr Physiol. 2015;5:1751–74. - PubMed
    1. DeLeve LD. Liver sinusoidal endothelial cells in hepatic fibrosis. Hepatology. 2015;61:1740–6. - PMC - PubMed
    1. Forstermann U, Sessa WC. Nitric oxide synthases: regulation and function. European heart journal. 2012;33:829–37. 37a-37d. - PMC - PubMed

Publication types