. 2023 Jul 24;13(12):4197-4216.
doi: 10.7150/thno.84059. eCollection 2023.

Preconditioned extracellular vesicles from hypoxic microglia reduce poststroke AQP4 depolarization, disturbed cerebrospinal fluid flow, astrogliosis, and neuroinflammation

Affiliations

Preconditioned extracellular vesicles from hypoxic microglia reduce poststroke AQP4 depolarization, disturbed cerebrospinal fluid flow, astrogliosis, and neuroinflammation

Wenqiang Xin et al. Theranostics. .

Abstract

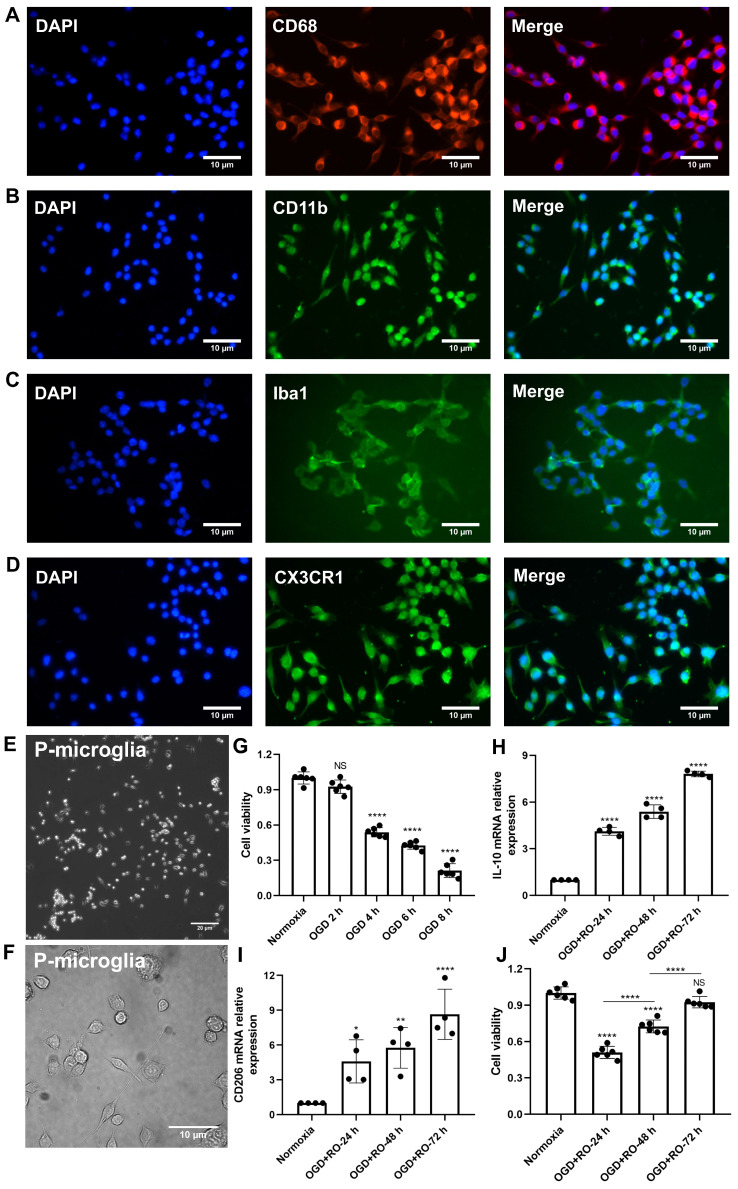
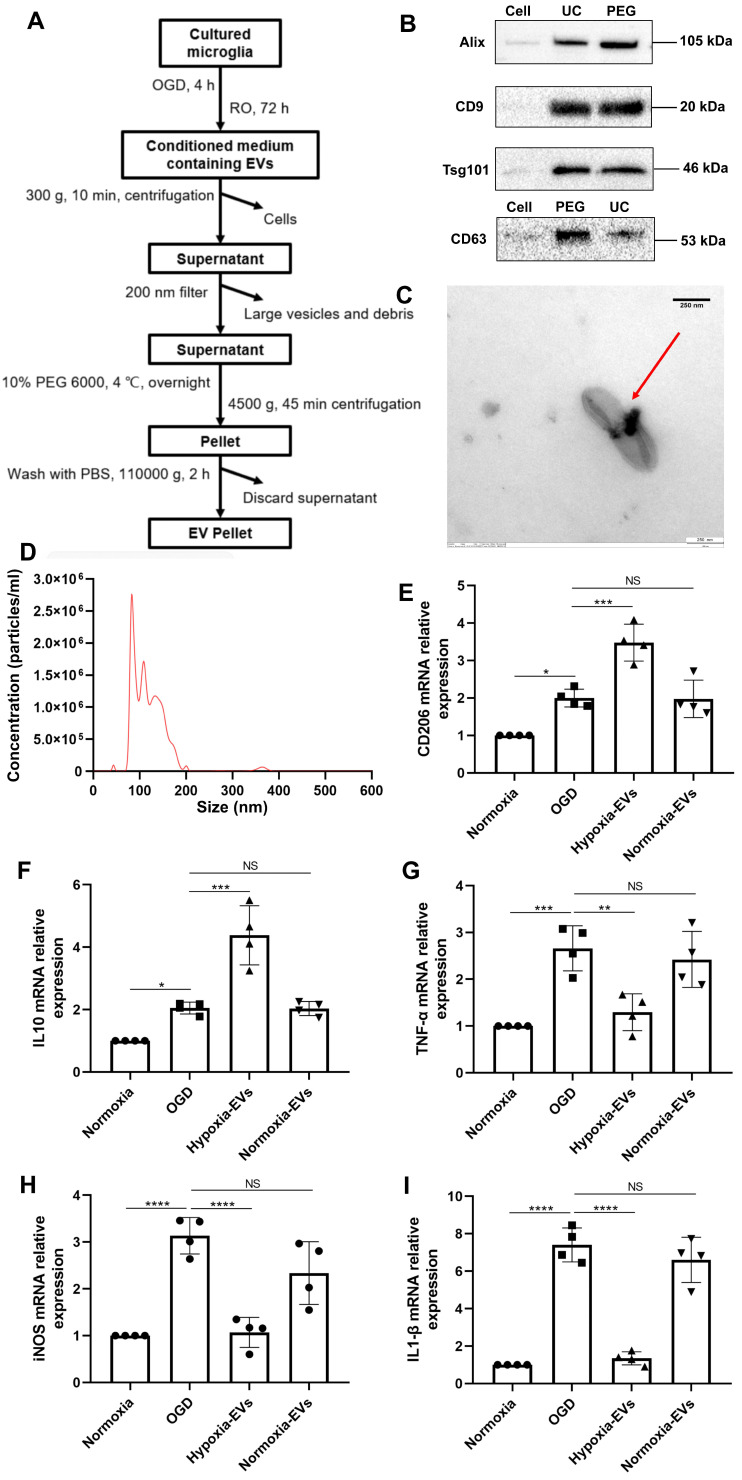
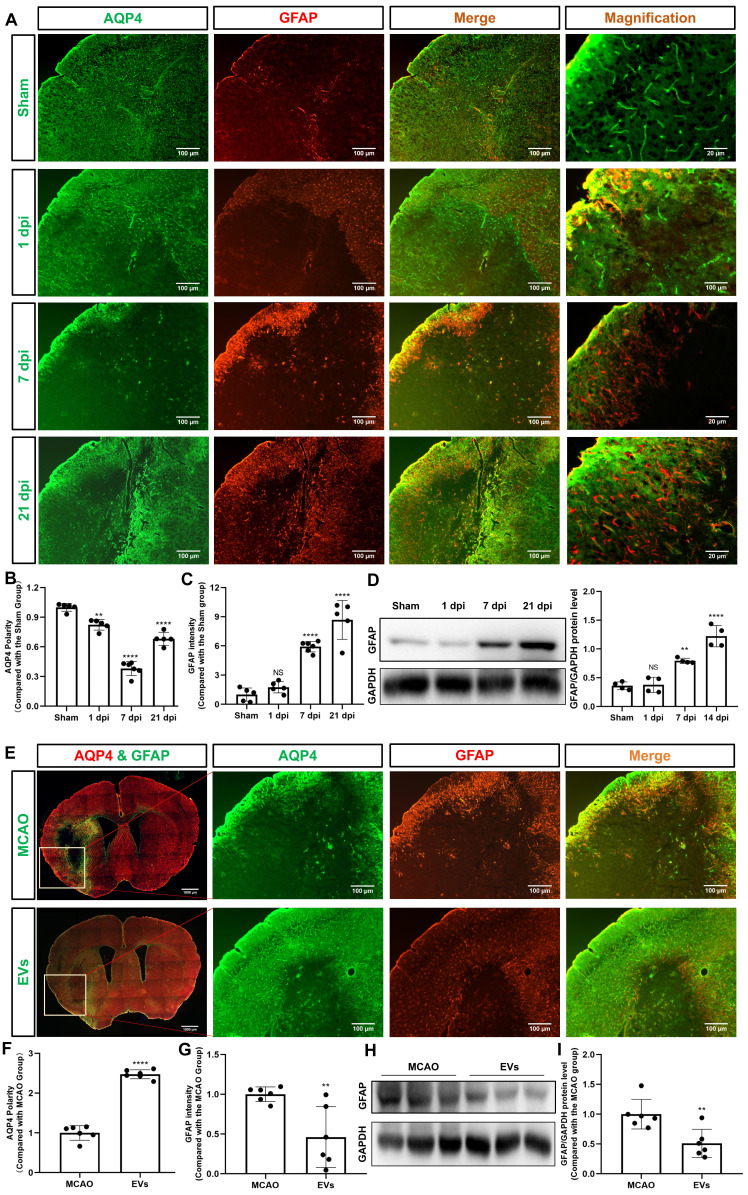
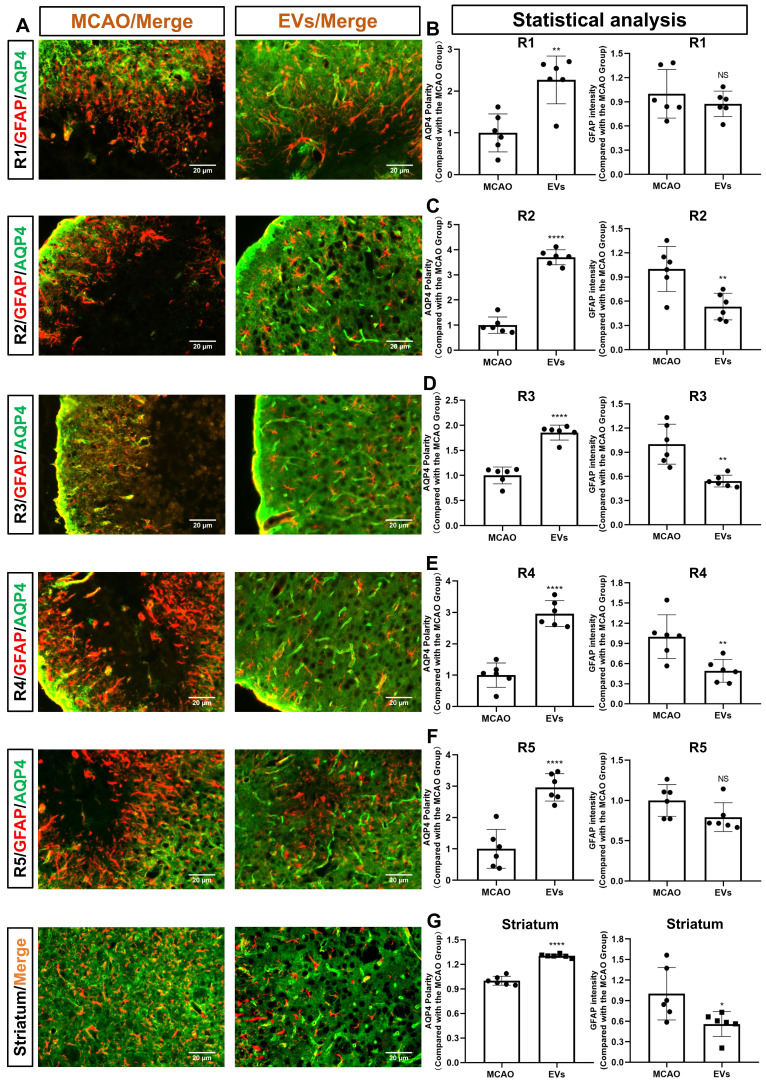
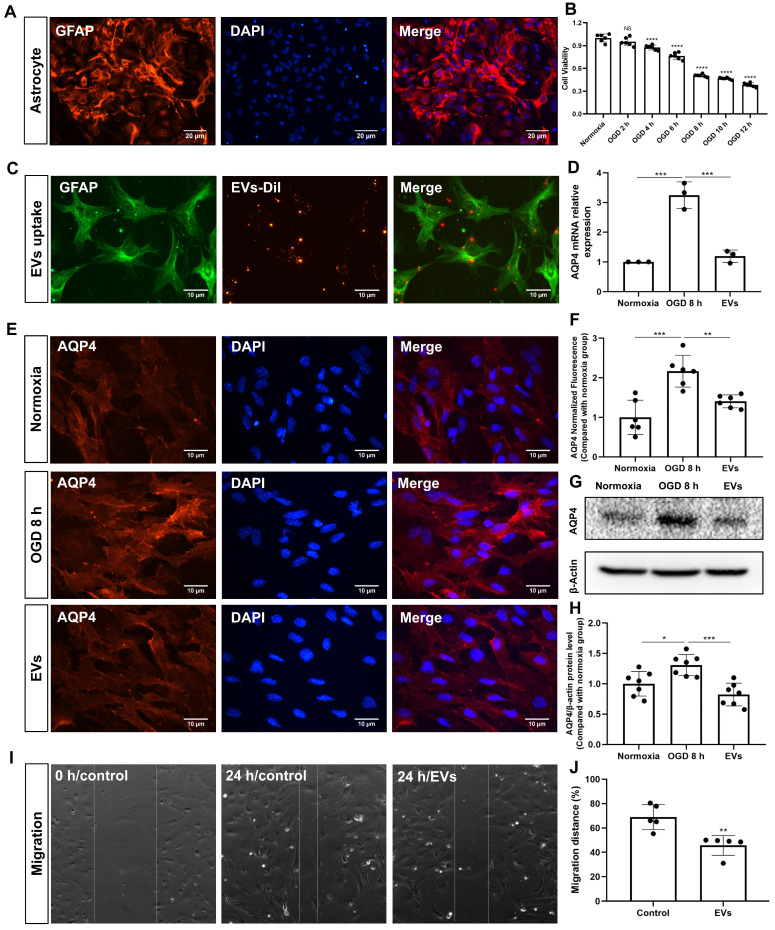
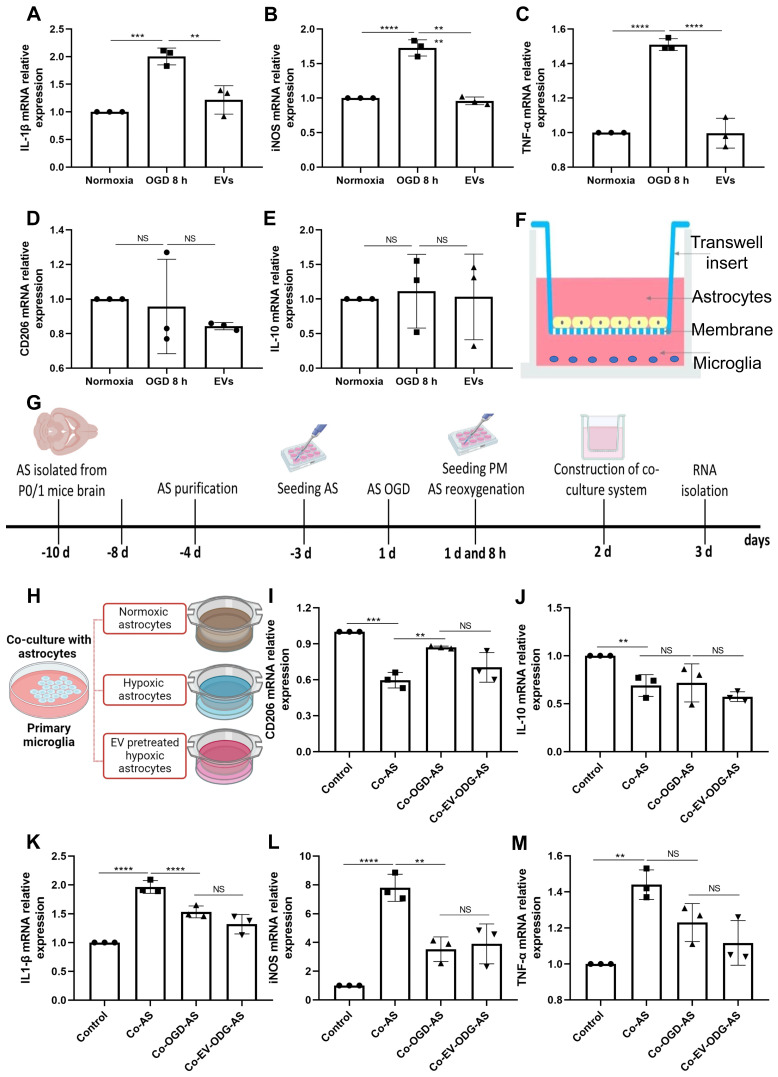
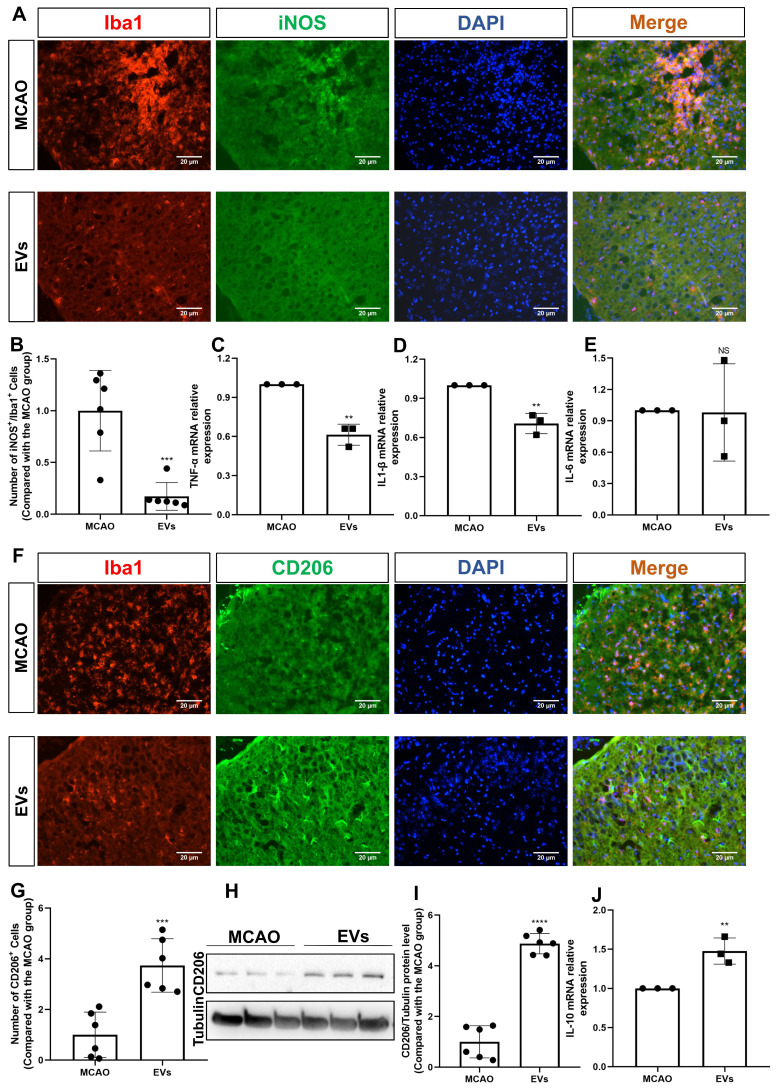
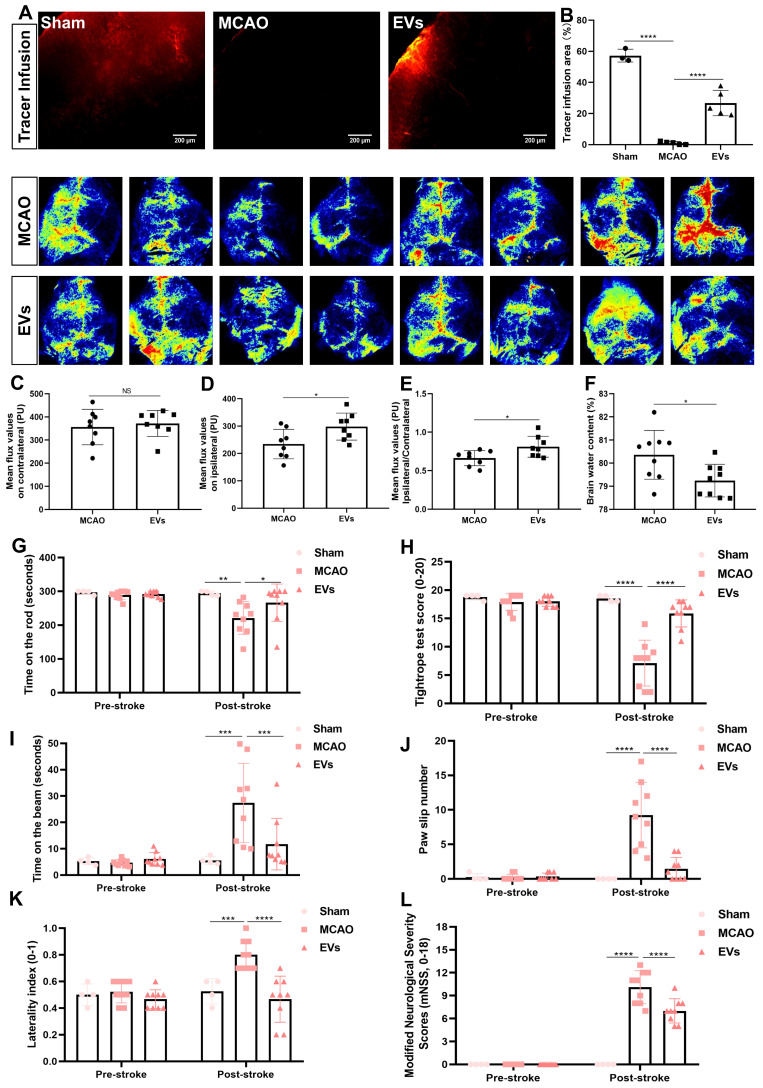
Background: Stroke stimulates reactive astrogliosis, aquaporin 4 (AQP4) depolarization and neuroinflammation. Preconditioned extracellular vesicles (EVs) from microglia exposed to hypoxia, in turn, reduce poststroke brain injury. Nevertheless, the underlying mechanisms of such effects are elusive, especially with regards to inflammation, AQP4 polarization, and cerebrospinal fluid (CSF) flow. Methods: Primary microglia and astrocytes were exposed to oxygen-glucose deprivation (OGD) injury. For analyzing the role of AQP4 expression patterns under hypoxic conditions, a co-culture model of astrocytes and microglia was established. Further studies applied a stroke model, where some mice also received an intracisternal tracer infusion of rhodamine B. As such, these in vivo studies involved the analysis of AQP4 polarization, CSF flow, astrogliosis, and neuroinflammation as well as ischemia-induced brain injury. Results: Preconditioned EVs decreased periinfarct AQP4 depolarization, brain edema, astrogliosis, and inflammation in stroke mice. Likewise, EVs promoted postischemic CSF flow and cerebral blood perfusion, and neurological recovery. Under in vitro conditions, hypoxia stimulated M2 microglia polarization, whereas EVs augmented M2 microglia polarization and repressed M1 microglia polarization even further. In line with this, astrocytes displayed upregulated AQP4 clustering and proinflammatory cytokine levels when exposed to OGD, which was reversed by preconditioned EVs. Reduced AQP4 depolarization due to EVs, however, was not a consequence of unspecific inflammatory regulation, since LPS-induced inflammation in co-culture models of astrocytes and microglia did not result in altered AQP4 expression patterns in astrocytes. Conclusions: These findings show that hypoxic microglia may participate in protecting against stroke-induced brain damage by regulating poststroke inflammation, astrogliosis, AQP4 depolarization, and CSF flow due to EV release.

Keywords: AQP4 polarization; CSF flow; astrogliosis; extracellular vesicles; inflammation; microglia; stroke.


Conflict of interest statement

Competing Interests: The authors have declared that no competing interest exists.

Figures

Figure 1
Figure 1
Identification of primary cortical microglia and the impact of hypoxia on microglial polarization. Primary microglia were extracted from neonatal C57BL/6 mice and plated for 24 h before use. Immunofluorescence staining found microglia positive for the expression of CD68 (A), CD11b (B), Iba1 (C), and CX3CR1 (D). DAPI was used as a counterstain for the cell nuclei. (E-F) Light microscopy of p3 passaged primary microglia in culture. Microglia appeared healthy and displayed processes and a ramified morphology. (G) MTT (Thiazolyl Blue Tetrazolium Bromide) was used to test the microglia viability exposed to 2, 4, 6, and 8 h of OGD followed by 24-h reoxygenation. Cells incubated under standard cell culture conditions ('Normoxia') were defined as 100% cell survival (n = 6). (H-I) RT-qPCR was employed to detect the M2 signature genes IL-10 and CD206 on the mRNA levels (n = 4). (J) MTT was used to test the cell viability exposed to 4 h of OGD followed by 24-, 48-, and 72-h reoxygenation. Cells incubated under standard cell culture conditions ('Normoxia') were defined as 100 % cell survival (n = 6). *p < 0.05; **p < 0.01; ****p < 0.0001; P-microglia, primary microglia; NS, not statistically significant; IL, Interleukin; OGD, oxygen-glucose deprivation; RT-qPCR, quantitative real-time PCR analysis; RO, reoxygenation.
Figure 2
Figure 2
Characterization of EVs from formerly hypoxic microglia and the impact of the increased concentration of such EVs on cortical microglia polarization upon induction of hypoxia. (A) In the schematic diagram, EVs were enriched from the conditioned medium of OGD-preconditioned microglia by the method of PEG precipitation combined with various centrifugation steps. (B) Western blot analysis of EVs against the exosomal representative markers such as Alix, CD9, Tsg101 and CD63. Western blots were conducted on total cell lysates and EV lysates (UC and PEG) from hypoxia-preconditioned microglia. (C) TEM analysis of vesicles derived from hypoxic microglia. (D) The size distribution patterns of EVs were assessed by NTA (n = 3). (E-F) RT-qPCR analysis assay of M2 microglia polarization marker IL-10 and CD206 mRNA in primary microglia in three groups: normoxia, 4 h of OGD followed by 24-h reoxygenation, and 4 h of OGD followed by 24-h reoxygenation with EV treatment (n = 4). (G-I) RT-qPCR assay of M1 microglia polarization marker TNF-α, iNOS, and IL-1β mRNA in primary microglia (n = 4). *p < 0.05; **p < 0.01; ***p < 0.001; ****p < 0.0001; NS, not statistically significant; RO, reoxygenation; TSG101, tumor susceptibility gene 101; IL, Interleukin; TNF-α, tumor necrosis factor-α; NTA, nanoparticle tracking analysis; PEG, polyethylene glycol; TEM, transmission electron microscopy; EVs, extracellular vesicles; iNOS, inducible nitric oxide synthase; UC, ultracentrifugation; OGD, oxygen-glucose deprivation; RT-qPCR, quantitative real-time PCR analysis.
Figure 3
Figure 3
EVs from hypoxic microglia abrogate AQP4 depolarization and reactive astrogliosis in the periinfarct cortex. (A) Dynamic evolution of AQP4 polarity and GFAP fluorescence in the periinfarct cortex. (B-C) Statistical plots of AQP4 polarity and GFAP mean fluorescence intensity in the periinfarct cortex of different groups of mice (n = 5-6). The polarity of AQP4 decreased significantly at all time points compared with the sham group. The GFAP intensity was boosted on dpi7 and dpi21. (D) The dynamic GFAP protein expression in the ischemic cortex on dpi1, 7, and 21 was measured by western blot. Compared with the sham group, the protein expression of GFAP on dpi1 was not significantly increased, whereas the protein expression of GFAP on dpi7 and dpi21 were significantly increased (n = 4). (E) Schematic diagram of the cortex of interest along with representative immunofluorescence maps among the MCAO+PBS and EV treatment groups. The white boxes represent the region of interest. (F-G) Statistical analysis of the polarity of AQP4 and GFAP intensity. The EV treatment group was associated with a higher AQP4 polarity and a lower GFAP intensity in the ischemic cortex on dpi7 (n = 6). (H-I) The impact of EV treatment on GFAP protein level in the ischemic cortex on dpi7 was measured by western blot (n = 6). *p < 0.05; **p < 0.01; ****p < 0.0001; NS, not statistically significant; MCAO, middle cerebral artery occlusion; EVs, extracellular vesicles; AQP4, aquaporin 4; dpi, day post-ischemia; GFAP, glial fibrillary acidic protein.
Figure 4
Figure 4
EVs derived from hypoxic microglia augment AQP4 polarity and attenuate astrogliosis in different regions of the periinfarct cortex and striatum. (A) Schematic diagram of the cortex and striatum at post-MCAO day 7 of interest along with representative immunofluorescence maps. (B-G) Statistical plots of the polarity of AQP4 and GFAP mean fluorescence intensity in the periinfarct region 1 (R1), R2, R3, R4, R5, and striatum (n = 6). The EV-treated mice exhibited a higher polarity of AQP4 in all periinfarct regions and striatum than those of the MCAO control mice. Likewise, the EV-treated mice were associated with a lower GFAP mean fluorescence intensity in the peri-infarct R2, R3, R4, and striatum. *p < 0.05; **p < 0.01; ****p < 0.0001; NS, not statistically significant; MCAO, middle cerebral artery occlusion; EVs, extracellular vesicles; AQP4, aquaporin 4.
Figure 5
Figure 5
EV treatment reduces the clustering of AQP4 in the astrocyte plasma membrane exposed to hypoxia. (A) Identification of primary cortical astrocytes. Cell cultures were immunoassayed for GFAP (red) and counterstained with DAPI (blue). (B) MTT (Thiazolyl Blue Tetrazolium Bromide) was used to assess the astrocyte viability exposed to 2, 4, 6, 8 10, and 12 h of OGD followed by 24-h reoxygenation. Cells incubated under standard cell culture conditions ('Normoxia') were defined as 100 % cell survival (n = 6). (C) EVs labeled with DiI (red) were taken up into the cytoplasm of GFAP+ (green) astrocytes. (D) RT-qPCR assay of the impact of EV treatment of AQP4 gene expression in primary astrocytes exposed to 8 h of OGD followed by 24 h of reoxygenation (n = 3). (E-F) Immunocytochemistry with the antibody specific for AQP4 confirmed AQP4 protein clustering in the plasma membrane under different treatment conditions (n = 6). (G-H) Western blot analysis showing the AQP4 protein in primary astrocytes after OGD in untreated cells or cells treated with EVs (n = 7). (I-J) EVs decreased the capability of migration of astrocytes in the scratch wound model (24 h, n = 5). *p < 0.05; **p < 0.01; ***p < 0.001; ****p < 0.0001; NS, not statistically significant; OGD, oxygen-glucose deprivation; EVs, extracellular vesicles; AQP4, aquaporin 4; RT-qPCR, quantitative real-time PCR analysis.
Figure 6
Figure 6
EVs derived from hypoxic microglia shift inflammation in primary astrocytes exposed to hypoxia. (A-E) RT-qPCR assay of IL-1β, iNOS, TNF-α, IL-10, and CD206 mRNA levels in primary astrocytes in the three groups: normoxic astrocytes and 8 h of OGD followed by 24-h reoxygenation in untreated astrocytes or astrocytes treated with EVs (n = 3). (F) The construction of the co-culture system of astrocyte-microglia communication. Astrocytes and microglia were respectively seeded on the upper and lower compartment. (G) Experimental paradigm summarizing the in vitro communication co-culture model. (H) Microglia were exposed to co-culture with astrocytes under three statuses: normoxia, 8 h of OGD followed by 24-h reoxygenation, and 8 h of OGD followed by 24-h reoxygenation with EV treatment. (I-M) An alteration of AQP4 level in modulating astrocyte-to-microglia communication in terms of neuroinflammation. Secreted anti-inflammatory cytokines (CD206 and IL-10 mRNA) and pro-inflammatory cytokines (IL-1β, iNOS, and TNF-α mRNA) in primary microglia were measured using RT-qPCR (n = 3). *p < 0.05; **p < 0.01; ***p < 0.001; ****p < 0.0001; NS, not statistically significant; OGD, oxygen-glucose deprivation; EVs, extracellular vesicles; AQP4, Aquaporin 4; PM, primary microglia; AS; astrocytes; RT-qPCR, quantitative real-time PCR analysis; IL, Interleukin; TNF-α, tumor necrosis factor-α; iNOS, inducible nitric oxide synthase.
Figure 7
Figure 7
EV administration diminishes neuroinflammation in the periinfarct cortex. (A-B) On day 7 after stroke, the periinfarct cortex was co-stained for iNOS and Iba1 and quantification of the number of iNOS+/Iba1+ cells (M1 polarization of microglia cells) was carried by immunofluorescence staining in the untreated MCAO mice and MCAO mice treated with EVs (n = 6). (C-E) RT-qPCR assay of proinflammatory cytokines TNF-α, IL-1β, and IL-6 mRNA levels in the ischemic brain at post-MCAO day 7. In contrast to the untreated group, the TNF-α and IL-1β mRNA levels were reduced in the postischemic brain from EV-treated mice (n = 3). (F-G) Quantitative analysis of M2 polarization of microglia cells (CD206, green) in the ischemic cortex at post-MCAO day 7 by immunofluorescence staining (n = 6). (H-I) The CD206 protein level in the ischemic brain. EV infusion boosts M2 polarization rates of microglial cells in the ischemic brain at post-MCAO day 7 compared with the untreated group (n = 6). (J) RT-qPCR assay of anti-inflammatory cytokines IL-10 mRNA level in the ischemic brain at post-MCAO day 7. In contrast to the untreated group, the IL-10 mRNA level increased in the postischemic brain from EV treatment mice (n = 3). **p < 0.01; ***p < 0.001; ****p < 0.0001; NS, not statistically significant; EVs, extracellular vesicles; MCAO, middle cerebral artery occlusion; IL, Interleukin; TNF-α, tumor necrosis factor-α; RT-qPCR, quantitative real-time PCR analysis.
Figure 8
Figure 8
EV administration protects against ischemia-induced brain damage in mice. (A-B) To evaluate perivascular CSF penetration into the brain parenchyma, 10 μL of fluorescent CSF tracer were injected intracisternally into sham, MCAO + PBS, and MCAO + EVs mice. Thirty min after injection, the periinfarct fluorescence was measured. Representative images indicate that compared to sham brains, CSF tracer penetration into MCAO brains was markedly slowed. However, CSF tracer penetration was dramatically increased in MCAO + EVs mice compared to MCAO + PBS mice (n = 3-5). (C-E) Statistical analysis of laser speckle perfusion results in mice. Cerebral perfusion in the contralateral cortex is comparable among the untreated MCAO mice and MCAO mice treated with EVs on day 7 after stroke. The EV-treated mice were associated with a higher ipsilateral cortex blood flow and value of ipsilateral ratio to contralateral cortex blood flow (n = 8). (F) Statistical results of mouse brain water content between the untreated MCAO mice and MCAO mice treated with EVs (n = 9). (G-L) EV delivery protects against ischemia-induced motor coordination impairment. The rotarod test, the tightrope test, the balance beam test, the paw slips recording, the corner turn test, and the modified neurological severity scores were tested on day 1 before the stroke and day 7 after the stroke (n = 4-9). *p < 0.05; **p < 0.01; ***p < 0.001; ****p < 0.0001; NS, not statistically significant; EVs, extracellular vesicles; MCAO, middle cerebral artery occlusion.

References

    1. Fischer R, Wajant H, Kontermann R, Pfizenmaier K, Maier O. Astrocyte-specific activation of TNFR2 promotes oligodendrocyte maturation by secretion of leukemia inhibitory factor. Glia. 2014;62(2):272–83. - PubMed
    1. Stoll G, Jander S, Schroeter M. Inflammation and glial responses in ischemic brain lesions. Prog Neurobiol. 1998;56(2):149–71. - PubMed
    1. Nayak AR, Kashyap RS, Kabra D, Purohit HJ, Taori GM, Daginawala HF. Time course of inflammatory cytokines in acute ischemic stroke patients and their relation to inter-alfa trypsin inhibitor heavy chain 4 and outcome. Ann Indian Acad Neurol. 2012;15(3):181–5. - PMC - PubMed
    1. Koyama Y. Signaling molecules regulating phenotypic conversions of astrocytes and glial scar formation in damaged nerve tissues. Neurochem Int. 2014;78:35–42. - PubMed
    1. Huang L, Wu ZB, Zhuge Q, Zheng W, Shao B, Wang B. et al. Glial scar formation occurs in the human brain after ischemic stroke. Int J Med Sci. 2014;11(4):344–8. - PMC - PubMed

Publication types