. 2023 Jul 12;26(8):107295.
doi: 10.1016/j.isci.2023.107295. eCollection 2023 Aug 18.

Roquin-1 resolves sepsis-associated acute liver injury by regulating inflammatory profiles via miRNA cargo in extracellular vesicles

Affiliations

Roquin-1 resolves sepsis-associated acute liver injury by regulating inflammatory profiles via miRNA cargo in extracellular vesicles

Lei Zheng et al. iScience. .

Abstract

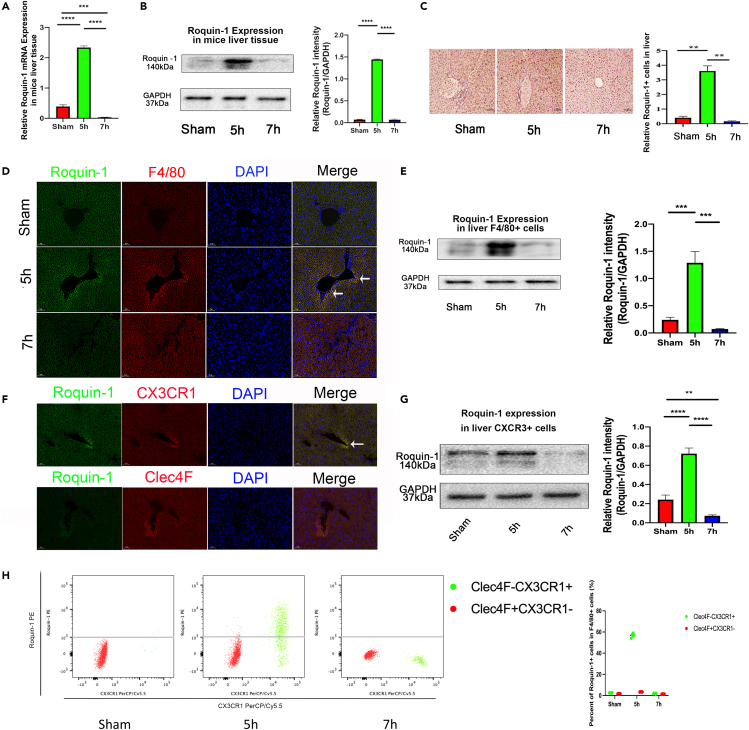
Sepsis-associated acute liver injury (SALI) is an independent risk for sepsis-induced death orchestrated by innate and adaptive immune responses. Here, we found that Roquin-1 was decreased during SALI and expressed mainly in monocyte-derived macrophages. Meanwhile, Roquin-1 was correlated with the inflammatory profiles in humans and mice. Mechanically, Roquin-1 in macrophages promoted Ago2-K258-ubiquitination and inhibited Ago2-S387/S828-phosphorylation. Ago2-S387-phosphorylation inhibited Ago2-miRNA's complex location in multivesicular bodies and sorting in macrophages-derived extracellular vesicles (MDEVs), while Ago2-S828-phosphorylation modulated the binding between Ago2 and miRNAs by special miRNAs-motifs. Then, the anti-inflammatory miRNAs in MDEVs decreased TSC22D2 expression directly, upregulated Tregs-differentiation via TSC22D2-STAT3 signaling, and inhibited M1-macrophage-polarization by TSC22D2-AMPKα-mTOR pathway. Furthermore, WT MDEVs in mice alleviated SALI by increasing Tregs ratio and decreasing M1-macrophage frequency synchronously. Our study showed that Roquin-1 in macrophages increased Tregs-differentiation and decreased M1-macrophage-polarization simultaneously via miRNA in MDEVs, suggesting Roquin-1 can be used as a potential tool for SALI treatment and MDEVs engineering.

Keywords: Immunology; Molecular biology; Pathophysiology.


Conflict of interest statement

The authors have declared that no conflict of interest exists.

Figures

None
Graphical abstract
Figure 1
Figure 1
Roquin-1 in liver møs was inhibited and correlated with SALI in WT mice (A) RT‒qPCR analysis of Roquin-1 in mice liver tissue with SALI (n = 6). (B) WB and quantitation of Roquin-1 expression in mice liver tissue with SALI (n = 6). (C) IHC stains and quantitation of Roquin-1 in mice liver tissue with SALI (n = 6, scale bars 100 μm). (D) Immunofluorescence images of Roquin-1 (green) and F4/80+ møs (red) i in mice liver tissue with SALI (n = 6, scale bars: 100 μm). (E) RT‒qPCR of Roquin-1 expression in F4/80+ møs of the mice liver with SALI (n = 6). (F) Double immunofluorescence labeling of Roquin-1 (green) and CX3CR1+/Clec-4F+ cells (red) in mice liver tissue at 5 h after SALI (n = 6, scale bars: 50 μm). (G) WB analysis (F) of Roquin-1 expression in mice liver F4/80+CX3CR1+ cells at 5 h after SALI (n = 6). (H) Liver non-parenchymal cells were isolated from Sham and SALI mice. Clec4F-CX3CR + cells (green dots) and Clec4F + CX3CR-cells (red dots) were gated based on FACS staining of CD11b+F4/80+ cells. Representative Roquin-1 expression of each gated population. p < 0.01∗, p < 0.01 ∗∗, p < 0.001 ∗∗∗, p < 0.0001 ∗∗∗∗. The data are expressed as the mean ± SD. Student’s t test and one-way analysis of variance (ANOVA) were used to compare two groups and multiple groups, respectively.
Figure 2
Figure 2
Roquin-1 alleviated SALI by promoting the differentiation of Tregs via MDEVs (A) Schematic overview of experiments analyzing the effect of Roquin-1 in chimeric mice with SALI (n = 6 mice in every group at each observation time). (B) HE stains (scale bars: 100 μm), Suzuki’s score in chimeric mice after SALI. (C–D) Flow cytometry of M1 møs (C, CD11b+F4/80+CD11C + CD206-) and Tregs (D, CD3+CD4+CD25+FoxP3) in mouse liver tissue after SALI (n = 6). (E) The protocol for the coculture of BMDMs and naive T cells. (F) Flow cytometry analysis of Treg (CD3+CD4+CD25+FoxP3+) differentiation in the coculture of WT/Roquin-1san/san BMDMs with/without GW4869 (Inhibitor of EVs) (n = 6). p < 0.01∗, p < 0.01 ∗∗, p < 0.001 ∗∗∗, p < 0.0001 ∗∗∗∗. The data are expressed as the mean ± SD. Student’s t test and ANOVA were used to compare two groups and multiple groups, respectively.
Figure 3
Figure 3
Roquin-1 modulated the sorting of miRNAs into MDEVs by specific miRNAs-motif and Ago2 involved in it (A) Heatmap of miRNAs in BMDM and MDEVs by miRNA sequencing analysis (n = 6). (B) RT‒qPCR shows the relative expression levels of mature miR-let-7a in BMDM/MDEVs normalized to U6 (n = 6). (C) The relative expression of miR-let-7a in WT and Roquin-1san/san BMDM treated with actinomycin. (D) Unbiased analyses of specific miRNA motifs in BMDM and MDEVs. (E) The miR-let-7a-BMDM-miRNA motif (top) and miR-18a-MDEV-miRNA motif (bottom). (F and G) The miR-let-7a WT and mut were constructed in BMDM. RT‒qPCR was used to detect miR-let-7a expression in miR-let-7a WT/mut BMDM and MDEVs (n = 6). (H) The MDEVs/BMDM ratio of miR-let-7a (WT) and miR-let-7a (mutation) (n = 6). (I) WB of WT/Mut miR-let-7a pulldown in BMDM. (J) The miR-let-7a WT and mut were constructed in BMDM. RT‒qPCR was used to detect miR-let-7a expression in Ago2 immunoprecipitation (n = 6). p < 0.01∗, p < 0.01 ∗∗, p < 0.001 ∗∗∗, p < 0.0001 ∗∗∗∗. The data are expressed as the mean ± SD. Student’s t test and ANOVA were used to compare two groups and multiple groups, respectively.
Figure 4
Figure 4
Roquin-1 regulated Ago2 localization to MVEs in BMDM and secretion to MDEVs (A) Representative confocal immunofluorescence images of Ago2 and CD63 in WT and Roquin-1san/san BMDM (n = 6, scale bars: 20 μm). (B) WB of WT and Roquin-1san/san BMDM subcellular fractionations through the continuous iodixanol gradient for Ago2, MVE marker (Flot1 and Rab7), and P-body marker (DCP1a and GW182) (n = 6). (C) The relative intensities of Ago2 and Rab7 in the WT and Roquin-1san/san fractions (n = 6). (D) WB (K) and quantification in equal numbers of MDEVs and MVE from WT and Roquin-1san/san BMDM. HSP70 was used as the loading control (n = 6). (E) WB and quantification of Tsg101 in the equal number of MDEVs isolated from WT and Roquin-1san/san BMDM (n = 6). HSP70 was used as the loading control. (F) WB of Ago2, Flot1 and Tsg101 from iodixanol density gradient fractionation of 18-h and 2-h MDEVs from Roquin-1san/san BMDM (n = 6). (G) WB and quantification of Ago2, Flot1, and Tsg101 in an equal number of fractions 6 and 7 from iodixanol density purification of 18-h MDEVs (n = 6). HSP70 was used as the loading control. (H) MDEVs from WT BMDM were IP with an antibody against CD63 or normal mouse IgG and immunoblotted (IB) for the indicated proteins (n = 6). p < 0.01∗, p < 0.01 ∗∗, p < 0.001 ∗∗∗, p < 0.0001 ∗∗∗∗. The data are expressed as the mean ± SD. The Student’s t test was used for comparison between the two groups.
Figure 5
Figure 5
Roquin-1 regulated Ago2 sorting in MDEVs by upregulating ubiquitination and inhibiting S387/S828 phosphorylation in BMDMs simultaneously (A) WB of the coimmunoprecipitation of Roquin-1 and Ago2 in BMDM (n = 6). (B) Immunofluorescent labeling of Roquin-1 (green) and Ago2 (red) in BMDM (n = 6, scale bars: 20 μm). (C) Roquin-1 133–1330, which was deleted from the RING domain and lacked ubiquitination activity, was used to investigate the relationship between Roquin-1 ubiquitination activity and the phosphorylation of Ago2 in BMDM (n = 6). (D) The candidate ubiquitin sites on Ago2. (E) The expression of Ago2 WT and KR mutant ubiquitination was compared using si-Roquin-1 to interfere with its expression and coprecipitate FLAG (n = 6). (F) The relationship between mutations in the ubiquitination sites of Ago2 KR and the phosphorylation of Ago2 (n = 6). (G) The co-localization of Ago2 and miR-let-7a in WT/Roquin-1san/san BMDM (n = 6). (H) The co-localization of miR-let-7a and CD63 in WT/Roquin-1san/san BMDM (n = 6). p < 0.01∗, p < 0.01 ∗∗, p < 0.001 ∗∗∗, p < 0.0001 ∗∗∗∗. The data are expressed as the mean ± SD. Co-localization Student’s t test was used for comparison between the two groups.
Figure 6
Figure 6
MDEVs affected Treg differentiation via TSC22D2-STAT3/FoxP3 pathway and regulated M1 polarization via the TSC22D2-AMPKα/mTOR pathway (A and B) Sequence-based gene expression profile analyses identify the function and/or signaling pathways. (C) The flow cytometer and quantitation of Tregs in the coculture of WT/Roquinn-1 san/san MDEVs and naive T cells with the inducement of Tregs differentiation (n = 6). (D) Western blot and quantitation of FoxP3/p-STAT3/STAT3 in Tregs with MDEVs stimulation (n = 6). (E) Western blot and quantitation of FoxP3/p-STAT3/STAT3 in Tregs with/without the stimulation of MDEVs and/or STAT3 inhibitor (n = 6). (F) The flow cytometer and quantitation of M1 mø in the coculture of MDEVs and mø with LPS stimulation (n = 6). (G) Western blot and quantitation of AMPKα/mTOR in BMDM with/without the stimulation of LPS and MDEVs (n = 6). (H) Western blot and quantitation of AMPKα/mTOR in BMDM with/without the stimulation of MDEVs and/or AMPKα activator/inhibitor (n = 6). (I) The flow cytometry of M1 mø in the coculture of mø and WT/miR-let-7a/miR-486a/miR-142a inhibit MDEVs with LPS stimution (n = 6). (J) The flow cytometry of Treg in the coculture of WT/miR-let-7a/miR-486a/miR-142a inhibit MDEVs and naive T cells with the inducement of Tregs differentiation (n = 6). (K) Western and quantitation of TSC22D2 and p-STAT3 in Tregs with with TSC22D2 inhibit and WT/miR-let-7a/miR-486a/miR-142a inhibit MDEVs (n = 6). (L) Western and quantitation of TSC22D2 and p-AMPKα in BMDM with with TSC22D2 inhibit and WT/miR-let-7a/miR-486a/miR-142a inhibit MDEVs (n = 6). p < 0.01∗, p < 0.01 ∗∗, p < 0.001 ∗∗∗, p < 0.0001 ∗∗∗∗. The data are expressed as the mean ± SD. The Student’s t test was used for comparison between the two groups.
Figure 7
Figure 7
MDEVs alleviate SALI by promoting Tregs differentiation and inhibiting M1 polarization synchronously (A and B) HE stains (A, scale bars: 100 μm) and Suzuki’s score (B) in mice liver during SALI with/without WT/Roquin-1san/san MEDVs injection (n = 6). (C) serum ALT and AST in SALI mice with/without WT/Roquin-1san/san MEDVs MDEVs injection (n = 6). (D and E) Flow cytometry and quantitation of M1 møs and Tregs in mice liver during SALI with/without MEDVs injection (n = 6). (F–I) Serum TNF-α (f)/TGF-β (g)/IL-6 (h)/IL-10 (i) in SALI mice with/without MDEVs injection (n = 6). p < 0.01∗, p < 0.01 ∗∗, p < 0.001 ∗∗∗, p < 0.0001 ∗∗∗∗. The data are expressed as the mean ± SD. The Student’s t test was used for comparison between the two groups.
Figure 8
Figure 8
Dysregulation of Roquin-1, inflammatory genes, and miRNA signatures in patients with SALI (A) Roquin-1 expression in the liver tissue of SALI patients (n = 10 human SALI patients) and control healthy samples (n = 7 healthy controls) was measured by RT‒qPCR (p = 0.002). (B) Double immunofluorescence labeling was performed to detect the expression of Roquin-1 (green) in liver CD11b+ møs (red) (normal (n = 7) and SALI (n = 10). Scale bars: 100 μm). (C) Flow cytometry was performed to assess the frequency of Tregs in CD4+ T cells and the ratio of M1/mø in blood. Serum TGF-β, TNF-α, IL-6 and IL-10 were measured by ELISA. (D) A regression curve was generated by plotting relative Roquin-1 mRNA expression against TGF-β/TNF-α/IL-6/IL-10/Tregs frequency/M1 ratio in the SALI patient and normal person. (E) RT-qPCR analysis of miR-let-7a, miR142a, miR-486a and miR-18a in plasma EVs of SALI patients. (F) RT-qPCR analysis of TSC22D2 in liver of SALI patients. p < 0.01∗, p < 0.01 ∗∗, p < 0.001 ∗∗∗, p < 0.0001 ∗∗∗∗. The data are expressed as the mean ± SD. The Student’s t test was used for comparison between the two groups.

References

    1. van der Poll T., Shankar-Hari M., Wiersinga W.J. The immunology of sepsis. Immunity. 2021;54:2450–2464. doi: 10.1016/j.immuni.2021.10.012. - DOI - PubMed
    1. Sygitowicz G., Sitkiewicz D. Molecular mechanisms of organ damage in sepsis: an overview. Braz. J. Infect. Dis. 2020;24:552–560. doi: 10.1016/j.bjid.2020.09.004. - DOI - PMC - PubMed
    1. Jacobi J. The pathophysiology of sepsis - 2021 update: Part 2, organ dysfunction and assessment. Am. J. Health Syst. Pharm. 2022;79:424–436. doi: 10.1093/ajhp/zxab393. - DOI - PubMed
    1. Kübler A., Adamik B., Durek G., Mayzner-Zawadzka E., Gaszyński W., Karpel E., Duszyńska W. Results of the severe sepsis registry in intensive care units in Poland from 2003-2009. Anaesthesiol. Intensive Ther. 2015;47:7–13. doi: 10.5603/AIT.2015.0002. - DOI - PubMed
    1. Woźnica E.A., Inglot M., Woźnica R.K., Łysenko L. Liver dysfunction in sepsis. Adv. Clin. Exp. Med. 2018;27:547–551. doi: 10.17219/acem/68363. - DOI - PubMed

LinkOut - more resources