. 2023 Feb 9;3(5):100190.
doi: 10.1016/j.xjidi.2023.100190. eCollection 2023 Sep.

Skin Infiltrate Composition as a Telling Measure of Responses to Checkpoint Inhibitors

Affiliations

Skin Infiltrate Composition as a Telling Measure of Responses to Checkpoint Inhibitors

Cory Kosche et al. JID Innov. .

Abstract

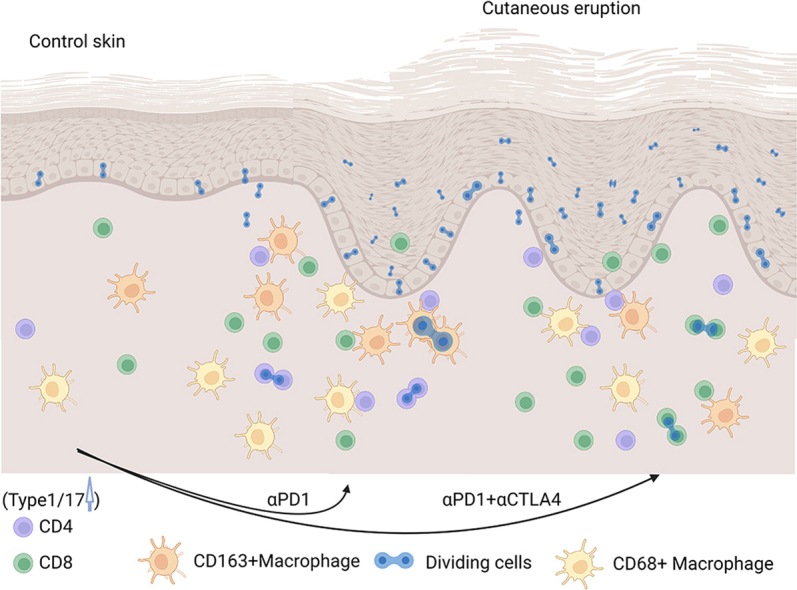
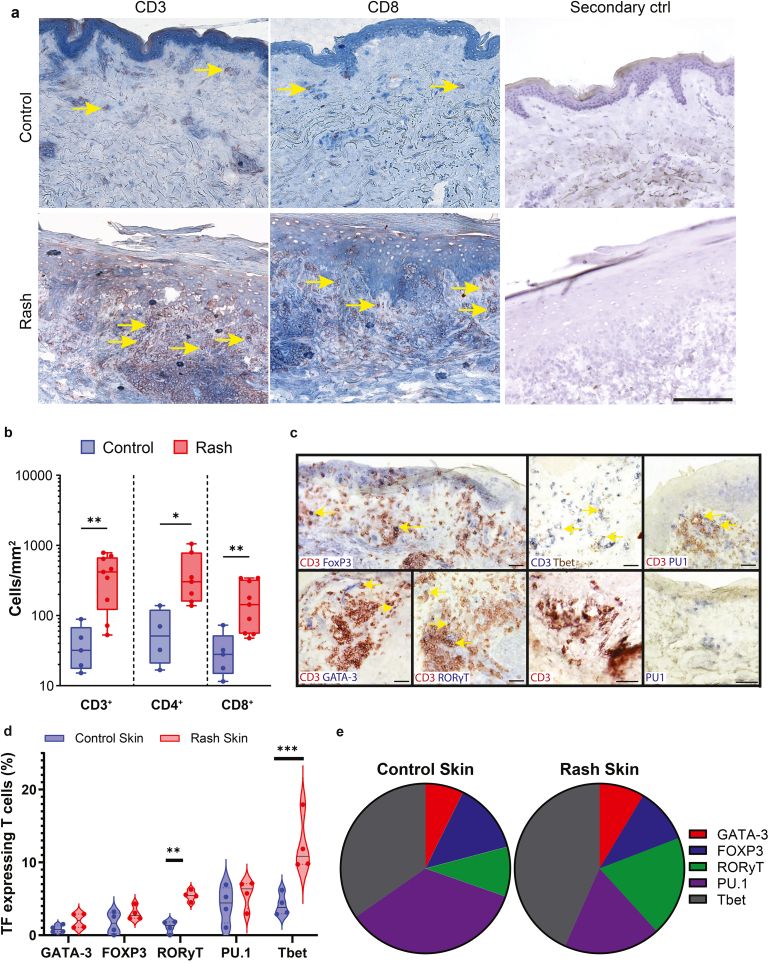
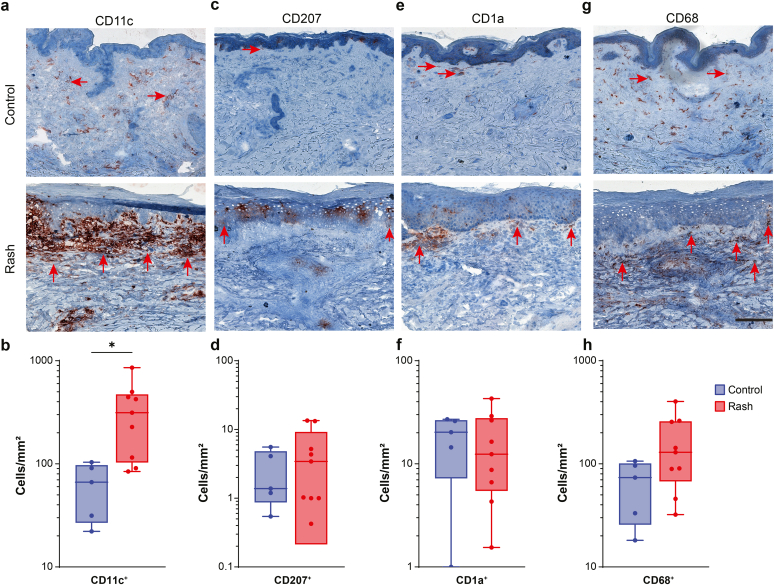
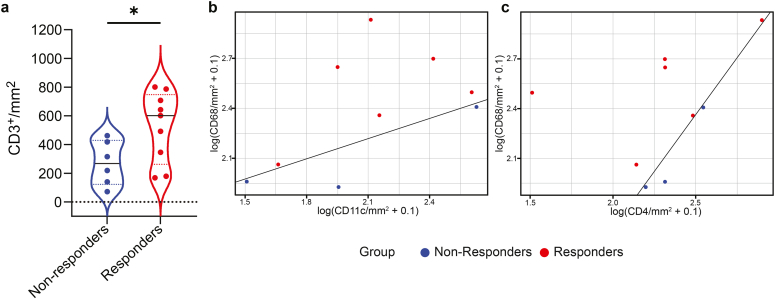
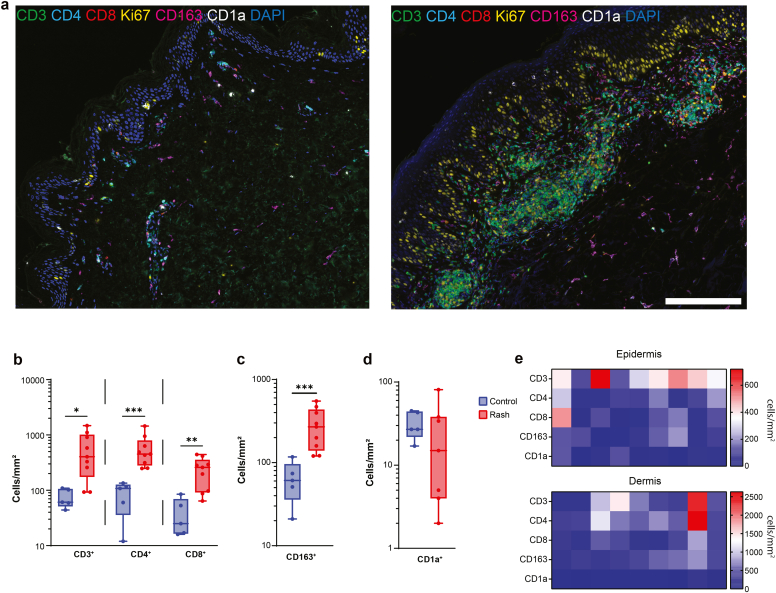
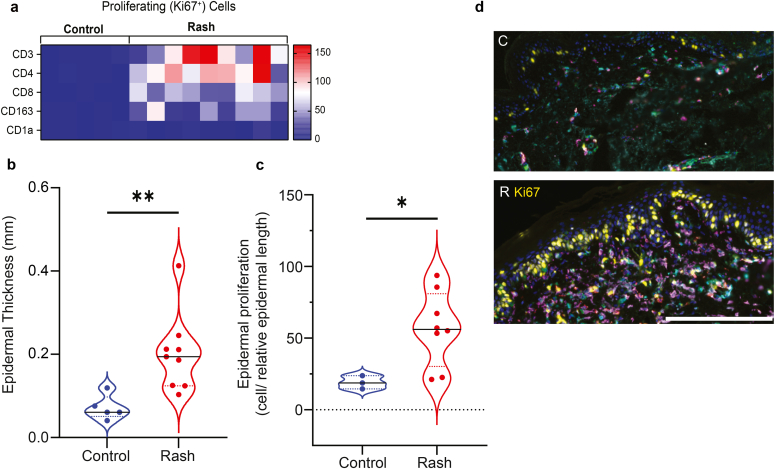
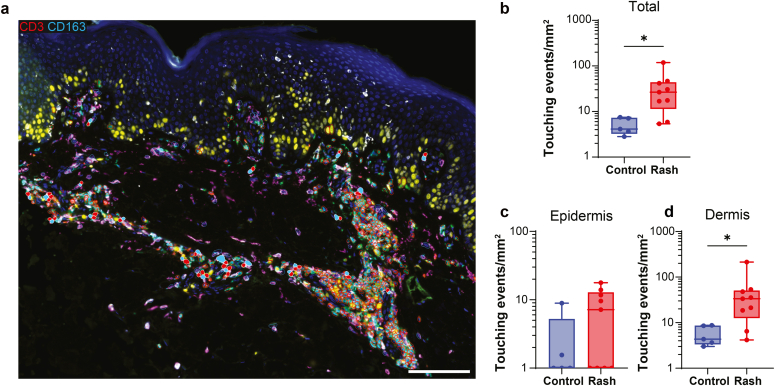
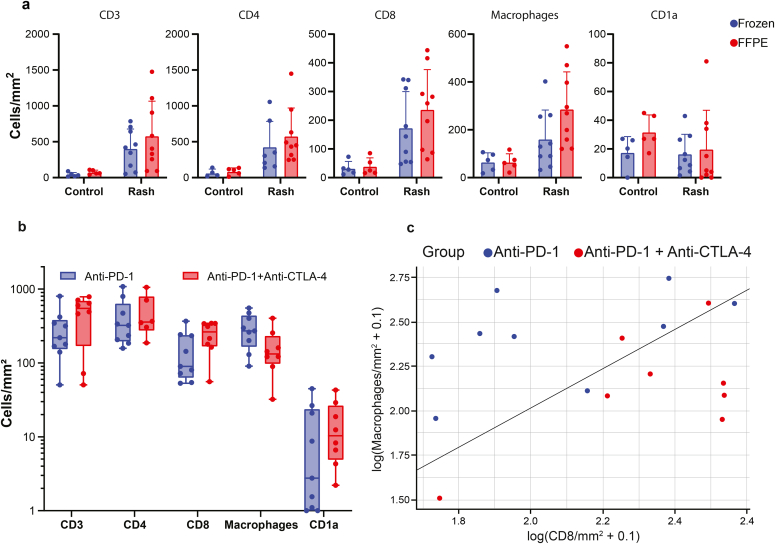
Checkpoint inhibitors treat a variety of tumor types with significant benefits. Unfortunately, these therapies come with diverse adverse events. Skin rash is observed early into treatment and might serve as an indicator of downstream responses to therapy. We studied the cellular composition of cutaneous eruptions and whether their contribution varies with the treatment applied. Skin samples from 18 patients with cancer and 11 controls were evaluated by mono- and multiplex imaging, quantification, and statistical analysis. T cells were the prime contributors to skin rash, with T cells and macrophages interacting and proliferating on site. Among T cell subsets examined, type 1 and 17 T cells were relatively increased among inflammatory skin infiltrates. A combination of increased cytotoxic T cell content and decreased macrophage abundance was associated with dual checkpoint inhibition over PD1 inhibition alone. Importantly, responders significantly separated from nonresponders by greater CD68+ macrophage and either CD11c+ antigen-presenting cell or CD4+ T cell abundance in skin rash. The microenvironment promoted epidermal proliferation and thickening as well. The combination of checkpoint inhibitors used affects the development and composition of skin infiltrates, whereas the combined abundance of two cell types in cutaneous eruptions aligns with responses to checkpoint inhibitor therapy.


Figures

None
Graphical abstract
Figure 1
Figure 1
Increased T cell infiltration in rash skin tissues. (a) CD3 and CD8 immunoperoxidase staining as well as secondary antibody only control staining in the control donor (top panel) and rash donor (bottom panel) skin tissue sections. Arrows indicate stained cells. Bar = 100 μm. (b) Quantification of CD3, CD4, and CD8 cell densities (cells/mm2 in log scale) in all available control and rash skin tissue samples. Values are shown as dots displaying the median, the 25th through 75th percentiles, and the range of values for individual patients or controls. Lines indicate median value, 13-fold, 6-fold, and 5-fold increase in rash skin, respectively. Asterisks denote statistical significance determined by Mann-Whitney test: Here, ∗∗P = 0.004 for CD3 pan-T cells and ∗∗P = 0.007 for CD8 T cells with N = 5 and 9 for control and rash skin, respectively for both analyses, and ∗P = 0.012 for CD4 T cells with N = 4 and 7 for control and rash skin, respectively. T cells were double-stained for transcription factor expression, and (c) example double stainings and controls with one primary antibody left out. Transcription factors are shown in blue except for Tbet (brown), and CD3+ cells are shown in red except when double-stained for Tbet (blue). Bar = 50 μm. (d) T cell subsets quantified as transcription factor double-stained CD3+ cells in skin rash and control skin samples as displayed in violin plots indicating the 25th and 75th percentile by dotted lines. The continuous line signifies the median value, 4-fold elevated for RORγt-expressing T cells (∗∗P = 0.001), and 2.8-fold elevated for Tbet-expressing T cells in skin rash samples (∗∗∗P < 0.001) as calculated using a specific binomial generalized linear model to account for correlations in double-positive cell counts within sample sets when comparing control and rash tissues. (e) Transcription factor–expressing cells are shown as a percentage of double-stained T cells, represented in pie chart format.
Figure 2
Figure 2
Increased CD11c infiltration in rash skin tissues. (a, c, e, g) CD11c, CD207, CD1a, and CD68 immunoperoxidase staining in control (top panel) and rash (bottom panel) skin tissues. Arrows indicate stained cells. Bar = 100 μm. (b, d, f, h) Quantification of cell density was performed in all available control and rash skin tissue samples and presented in box plots showing the range and 25th and 75th percentile values. The values shown represent individual patients or controls. Lines indicate median values. Asterisks denote statistical significance determined by the Mann-Whitney test: ∗P = 0.012 when comparing CD11c+ cells in skin rash samples to control skin.
Figure 3
Figure 3
Responders and nonresponders separate based on the abundance of two cell types within skin rash. (a) Analyzing T cells only among patients receiving immune checkpoint inhibitor therapy, a significant difference in abundance was found between responders and nonresponders (P < 0.050), although there is a significant overlap between the groups. (b) Responders and nonresponders to checkpoint inhibitor therapy separate based on the abundance of CD68+ and CD11c+ cells combined and on the abundance of CD68+ and CD4+ cells combined. Supporting Vector Machine (SVM) was used to plot a hyperplane separating the two groups of patients; this fitted straight line was used to quantify the relationship between CD8 and macrophages. Above this line, the predicted chance of being a responder is >0.5, whereas below the line, the chance of being a nonresponder is >0.5. Both regression lines were statistically significant (P = 0.003).
Figure 4
Figure 4
Immune cell infiltrate diversity in control and rash skin tissues by multispectral imaging. (a) Multispectral images for control (left) and rash (right) skin with high immune infiltrates observed in rash skin. Bar = 250 μm. Colors represent cell types indicated within the figure. (b) Quantification of CD3, CD4, and CD8 T cell densities for paraffin-embedded control and rash skin tissue samples listed in Table 1. Values shown as dots represent individual patients or controls in box plots showing the range and 25th and 75th percentile values. Lines indicate the median values. Asterisks denote statistical significance determined by the Mann-Whitney test: for CD3, P = 0.012; for CD4, P = 0.001; and for CD8, P = 0.020. (c) The same comparison was made for control and rash samples relative to CD163+ macrophage abundance (P = 0.001). (d) Comparing CD1a+ Langerhans cell abundance in rash and control skin. (e) Immune cell density (cells/mm2) heat maps of individual rash skin samples stratified as epidermis and dermis.
Figure 5
Figure 5
Increased proliferation in rash skin tissues. (a) Proliferating (Ki67+) immune cell density (cells/mm2) heat maps of control and rash skin tissue. Each immune cell marker was co-stained with Ki67. (b) Quantification of epidermal thickness in frozen samples of control and rash skin tissues as shown in a violin plot indicating 25th and 75th percentile values by dashed lines. Continuous lines indicate median values, and an increased 3.2-fold in rash skin. Asterisks denote significance determined by a Mann-Whitney test, ∗∗P = 0.002. (c) Comparing epidermal proliferation by ki67 staining of paraffin-embedded tissues per epidermal length by a Mann-Whitney test. Values are represented in a violin plot, showing the 25th and 75th percentile values as dashed lines. Continuous lines indicate median values, which are 3-fold elevated in rash skin. ∗ P = 0.049; (d) Example multispectral images with ki67 staining in yellow, highlighting the epidermis in control skin “C” above and in rash skin “R” below. Bar = 250 mm.
Figure 6
Figure 6
Increased T cell association with macrophages in rash skin by spatial analysis. (a) Representative multispectral imaging of a rash tissue section analyzed to determine touching CD3 (indicated by red filled objects) and CD163 (indicated by blue filled objects) cells. Bar = 100 μm (b) Quantification of touching CD3 and CD163 cells in the total tissue (top) and in the epidermis or dermis (bottom) in box plots with dashed lines showing 25th and 75th percentile values. Values shown represent individual patients or controls. Continuous line indicates median value, 6.5-fold increase in rash total skin and 7.7-fold increase in dermal tissue alone. Asterisks denote statistically significant differences determined by Mann-Whitney test: ∗P = 0.012 or ∗0.019 for total skin or dermal tissues, respectively.
Figure 7
Figure 7
Combination treatment is associated with reduced macrophage and increased cytotoxic T cell numbers. (a) Similar immune cell density profiles are derived from frozen and paraffin-embedded tissues. Two fixatives (and detection methods) were compared: acetone-fixed frozen sections were subjected to immunoperoxidase staining and paraffin-embedded tissues to immunofluorescent multiplex staining. Control and rash tissue staining are shown together in bar graphs, showing mean values ± SD. No significant differences were found in two-sided t tests, assuming equal variance in each group. (b) Measuring T cell and antigen-presenting cell numbers in rash skin after single agent or anti-PD-L1 or combination therapy (anti-PD1 and anti–CTLA-4), resulting populations deviate from one another based on the combination of macrophages and CD8 T cell abundance in the tissue. Values shown represent individual patients or controls in box plots showing the range and 25th and 75th percentile values. Lines indicate the median values. No significant differences were found in two-sided t tests, assuming equal variance in each group. (c) Analysis of deviance, modeled by stepwise selection and logistic regression. A Supporting Vector Machine (SVM) was used to plot a hyperplane separating the two groups of patients; this fitted straight line was used to quantify the relationship between treatment groups. Above this line, patients are more likely (P > 0.5) to have received single checkpoint inhibitor treatment, whereas patients below the line have more likely (P > 0.5) received dual checkpoint inhibitor therapy, ∗∗P = 0.002.

Similar articles

Cited by

  • Dermatologic toxicities related to cancer immunotherapy.
    Vaez-Gharamaleki Y, Akbarzadeh MA, Jadidi-Niaragh F, Mahmoodpoor A, Sanaie S, Hosseini MS. Vaez-Gharamaleki Y, et al. Toxicol Rep. 2025 Apr 5;14:102021. doi: 10.1016/j.toxrep.2025.102021. eCollection 2025 Jun. Toxicol Rep. 2025. PMID: 40271531 Free PMC article.

References

    1. Adam K., Iuga A., Tocheva A.S., Mor A. A novel mouse model for checkpoint inhibitor-induced adverse events. PLoS One. 2021;16 - PMC - PubMed
    1. Akano Y., Kuribayashi K., Funaguchi N., Koda Y., Fujimoto E., Mikami K., et al. Analysis of pleiotropic effects of nivolumab in pretreated advanced or recurrent non-small cell lung cancer cases. In Vivo. 2019;33:507–514. - PMC - PubMed
    1. Cencini E., Fabbri A., Sicuranza A., Gozzetti A., Bocchia M. The role of tumor-associated macrophages in hematologic malignancies. Cancers (Basel) 2021;13:3597. - PMC - PubMed
    1. Chistiakov D.A., Killingsworth M.C., Myasoedova V.A., Orekhov A.N., Bobryshev Y.V. CD68/macrosialin: not just a histochemical marker. Lab Invest. 2017;97:4–13. - PubMed
    1. Choi J., Anderson R., Blidner A., Cooksley T., Dougan M., Glezerman I., et al. Multinational Association of Supportive Care in Cancer (MASCC) 2020 clinical practice recommendations for the management of severe dermatological toxicities from checkpoint inhibitors. Support Care Cancer. 2020;28:6119–6128. - PMC - PubMed