. 2023 Jun 1;5(8):305-320.
doi: 10.1096/fba.2023-00036. eCollection 2023 Aug.

Comprehensive analysis of circRNAs for N7-methylguanosine methylation modification in human oral squamous cell carcinoma

Affiliations

Comprehensive analysis of circRNAs for N7-methylguanosine methylation modification in human oral squamous cell carcinoma

Dongyuan Sun et al. FASEB Bioadv. .

Abstract

N7-methylguanosine (m7G) modification is closely related to the occurrence of tumors. However, the m7G modification of circRNAs in oral squamous cell carcinoma (OSCC) remains to be investigated. Methylated RNA immunoprecipitation sequencing (MeRIP-seq) was used to measure the methylation levels of m7G and identify m7G sites in circRNAs in human OSCC and normal tissues. The host genes of differentially methylated and differentially expressed circRNAs were analyzed by Gene Ontology (GO) enrichment and Kyoto Encyclopedia of Genes and Genomes (KEGG) pathway analyses, and circRNA-miRNA-mRNA networks were predicted using the miRanda and miRDB databases. The analysis identified 2348 m7G peaks in 624 circRNAs in OSCC tissues. In addition, the source of m7G-methylated circRNAs in OSCC was mainly the sense overlap region compared with normal tissues. The most conserved m7G motif in OSCC tissues was CCUGU, whereas the most conserved motif in normal tissues was RCCUG (R = G/A). Importantly, GO enrichment and KEGG pathway analysis showed that the host genes of differentially methylated and differentially expressed circRNAs were involved in many cellular biological functions. Furthermore, the significantly differentially expressed circRNAs were analyzed to predict the circRNA-miRNA-mRNA networks. This study revealed the whole profile of circRNAs of differential m7G methylation in OSCC and suggests that m7G-modified circRNAs may impact the development of OSCC.

Keywords: N7‐methylguanosine (m7G); RNA methylation; circular RNA; methylated RNA immunoprecipitation sequencing (MeRIP‐seq); oral squamous cell carcinoma (OSCC).


Conflict of interest statement

The authors declare that they have no competing interests.

Figures

FIGURE 1
FIGURE 1
Flow chart of the methylated RNA immunoprecipitation sequencing (MeRIP‐seq) experiment and m7G methylation distribution characteristics. (A) After the extracted RNA was fragmented, the 5′‐cap was removed; one group subsequently pulled down the m7G‐rich RNA fragment with m7G‐antibody enrichment, and another group was used as input. (B) Venn diagram of m7G peaks identified in circRNAs in OSCC and normal tissues. (C) Venn diagram of m7G target genes in OSCC and normal tissues. C, cancer; N, normal.
FIGURE 2
FIGURE 2
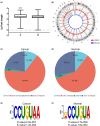
Common features of m7G‐modified circRNAs in OSCC tissues. (A) Comparison of the width of m7G peaks in OSCC and normal tissues. C: cancer; N: normal. ****p < 0.0001 (B) Visualization of chromosomes in OSCC and normal tissues. (C, D) Pie chart of the source composition of m7G‐modified circRNA classified according to the source region in OSCC and normal tissues. (E, F) Most representative motifs in OSCC and normal tissues, respectively.
FIGURE 3
FIGURE 3
GO enrichment and KEGG pathway analysis of host genes of differentially methylated circRNAs. (A) GO enrichment analysis of host genes of upregulated m7G circRNAs in OSCC, including: biological process (BP), cellular component (CC), and molecular function (MF) analysis. (B) KEGG pathway analysis of host genes of upregulated m7G circRNAs in OSCC. (C) GO enrichment analysis of host genes of downregulated m7G circRNAs in OSCC, including: biological process (BP), cellular component (CC), and molecular function (MF) analysis. (D) KEGG pathway analysis of host genes of downregulated m7G circRNAs in OSCC.
FIGURE 4
FIGURE 4
GO enrichment and KEGG pathway analysis of host genes of differentially expressed circRNAs. (A) GO enrichment analysis of host genes with upregulated circRNAs in OSCC, including: biological process (BP), cellular component (CC), and molecular function (MF) analysis. (B) KEGG pathway analysis of host genes with upregulated circRNAs in OSCC. (C) GO enrichment analysis of host genes with downregulated circRNAs in OSCC, including: biological process (BP), cellular component (CC), and molecular function (MF) analysis. (D) KEGG pathway analysis of host genes with downregulated circRNAs in OSCC.
FIGURE 5
FIGURE 5
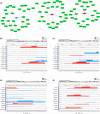
Visualization of methylation peaks on differential m7G methylation modifies circRNAs in OSCC tissues. (A) Methylation peaks of circRNA “chr3:170079046‐170099129” at the locus (Start: 170088920; End: 170089300). (B) Methylation peaks of circRNA “chr1:111690501‐111724893” at the locus (Start: 111695100; End: 111695340). (C) Methylation peaks of circRNA “chr2: 24799260‐24799540” at the locus (Start: 24799260; End: 24799540). (D) Methylation peaks of circRNA “chr1: 91390201‐91390480” at the locus (Start: 91390201; End: 91390480).
FIGURE 6
FIGURE 6
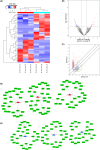
Analysis of circRNA differential expression in OSCC tissues. (A) Heatmap of cluster analysis of circRNA expression in OSCC and normal tissues. (B) Volcano plot of circRNA expression in OSCC tissues compared to normal tissues. (C) Scatter plot of circRNA expression in OSCC tissues compared to normal tissues. C, cancer; N, normal. (D) The circRNA–miRNA–mRNA network of the top three upregulated circRNAs (chr8:48192450‐48206619, chr17:28180406‐28182248 and chr10:116590611‐116608496). (E) The circRNA–miRNA–mRNA network of the top three downregulated circRNAs (chr3:99567139‐99569914, chr2:179516028‐179516243, and chr2:24357989‐24369956) and their target miRNAs and mRNAs (Top five miRNAs and mRNAs are shown on the map).
FIGURE 7
FIGURE 7
Co‐analysis of m7G methylation and transcriptome in OSCC. (A) The circRNAs–miRNAs–mRNAs networks for hyper‐methylated and hypo‐methylated downregulated circRNAs. (B) Methylation peaks of circRNA “chr1:169947226‐170001116” at the locus (Start: 169974141; End:169974500). (C) Methylation peaks of circRNA “chr1:169947226‐170001116” at the locus (Start:169956461; End:169956900). (D) Methylation peaks of circRNA “chr1:169947226‐170001116” at the locus (Start:169957121; End:169957340). (E) Methylation peaks of circRNA “chr1:169947226‐170001116” at the locus (Start:169973641; End:169974020).

Similar articles

Cited by

References

    1. Ali J, Sabiha B, Jan HU, Haider SA, Khan AA, Ali SS. Genetic etiology of oral cancer. Oral Oncol. 2017;70:23‐28. - PubMed
    1. Panzarella V, Pizzo G, Calvino F, Compilato D, Colella G, Campisi G. Diagnostic delay in oral squamous cell carcinoma: the role of cognitive and psychological variables. Int J Oral Sci. 2014;6:39‐45. - PMC - PubMed
    1. Shahinas J, Hysi D. Methods and risk of bias in molecular marker prognosis studies in oral squamous cell carcinoma. Oral Dis. 2018;24:115‐119. - PubMed
    1. Sung H, Ferlay J, Siegel RL, et al. Global cancer statistics 2020: GLOBOCAN estimates of incidence and mortality worldwide for 36 cancers in 185 countries. CA Cancer J Clin. 2021;71:209‐249. - PubMed
    1. Manzano‐Moreno FJ, Costela‐Ruiz VJ, García‐Recio E, Olmedo‐Gaya MV, Ruiz C, Reyes‐Botella C. Role of salivary MicroRNA and cytokines in the diagnosis and prognosis of oral squamous cell carcinoma. Int J Mol Sci. 2021;22:12215. - PMC - PubMed