. 2023 Aug 7;3(8):1473-1485.
doi: 10.1158/2767-9764.CRC-23-0097. eCollection 2023 Aug.

Exploring the Onset and Progression of Prostate Cancer through a Multicellular Agent-based Model

Affiliations

Exploring the Onset and Progression of Prostate Cancer through a Multicellular Agent-based Model

Margot Passier et al. Cancer Res Commun. .

Abstract

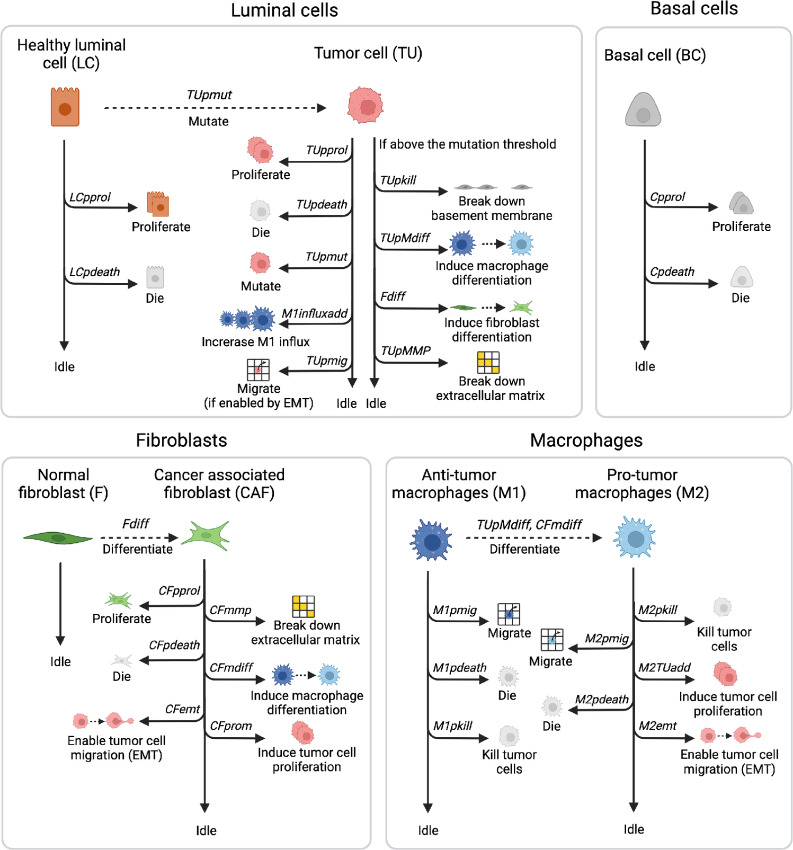
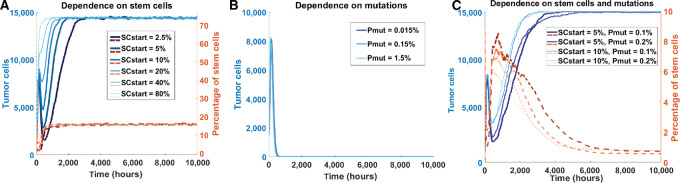
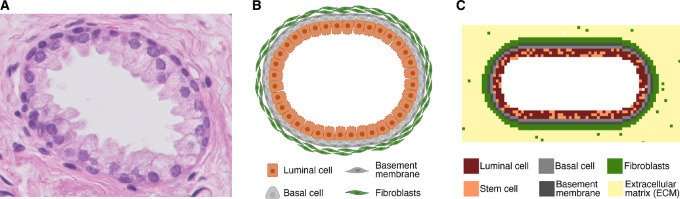
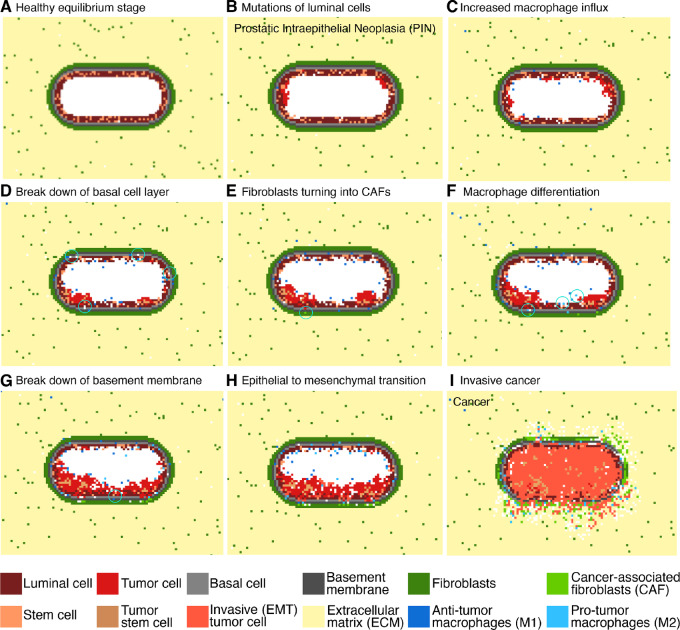
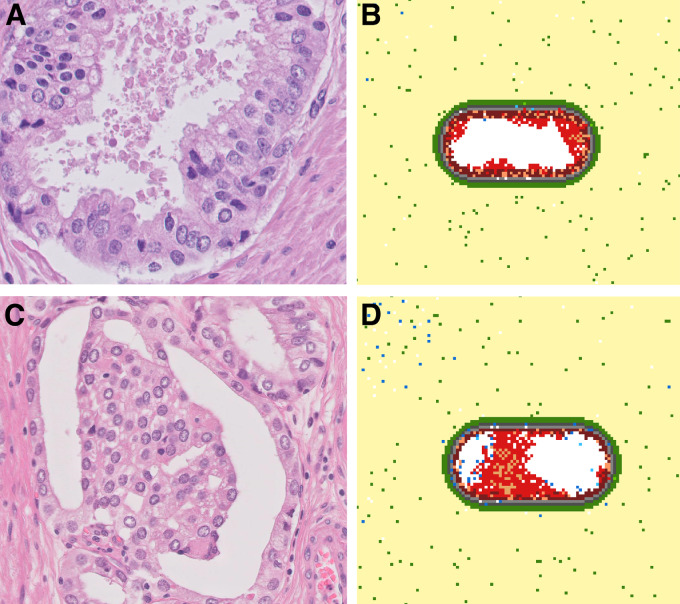
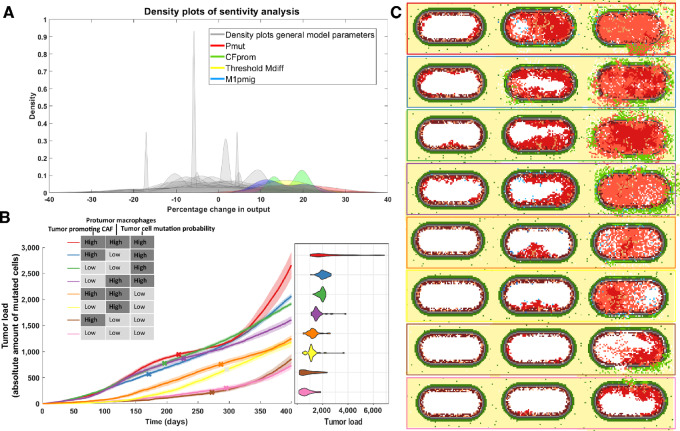
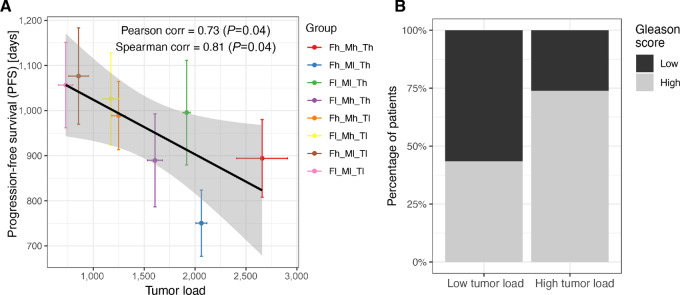
Over 10% of men will be diagnosed with prostate cancer during their lifetime. Arising from luminal cells of the prostatic acinus, prostate cancer is influenced by multiple cells in its microenvironment. To expand our knowledge and explore means to prevent and treat the disease, it is important to understand what drives the onset and early stages of prostate cancer. In this study, we developed an agent-based model of a prostatic acinus including its microenvironment, to allow for in silico studying of prostate cancer development. The model was based on prior reports and in-house data of tumor cells cocultured with cancer-associated fibroblasts (CAF) and protumor and/or antitumor macrophages. Growth patterns depicted by the model were pathologically validated on hematoxylin and eosin slide images of human prostate cancer specimens. We identified that stochasticity of interactions between macrophages and tumor cells at early stages strongly affect tumor development. In addition, we discovered that more systematic deviations in tumor development result from a combinatorial effect of the probability of acquiring mutations and the tumor-promoting abilities of CAFs and macrophages. In silico modeled tumors were then compared with 494 patients with cancer with matching characteristics, showing strong association between predicted tumor load and patients' clinical outcome. Our findings suggest that the likelihood of tumor formation depends on a combination of stochastic events and systematic characteristics. While stochasticity cannot be controlled, information on systematic effects may aid the development of prevention strategies tailored to the molecular characteristics of an individual patient.

Significance: We developed a computational model to study which factors of the tumor microenvironment drive prostate cancer development, with potential to aid the development of new prevention strategies.


Figures

FIGURE 1
FIGURE 1
Overview of the agents and actions they can perform during each model iteration. The simulation starts with luminal cells (LC) and basal cells (BC) that can proliferate, die, or idle, all within physiologic regions and with fixed probabilities. The starting geometry also contains quiescent fibroblasts (F) and the passive agents (basement membrane and ECM), macrophages enter throughout the simulation. LCs can gain mutations, resulting in an increased M1-macrophage influx, once these mutated cells are sensed by macrophages. These mutated cells (TU) can additionally break down basement membrane and ECM and affect macrophage and fibroblast differentiation upon reaching mutation thresholds. Differentiated fibroblasts (CAF) proliferate, die, and can perform tumor-promoting actions. Just as the differentiated M2 macrophages, they stimulate TU proliferation and allow for TU migration. Macrophages (M1 and M2) can also kill tumor cells and die or migrate. Image created with BioRender.com.
FIGURE 2
FIGURE 2
In silico testing of requirements for tumor maintenance. A, Amount of tumor cells (blue) and percentage of stem cells (orange, dotted) simulated over time under the condition that included only stem cells to maintain tumors. Simulations for six different initial percentages of stem cells (SCstart) are shown. B, Similar plot testing the condition in which the proliferative advantage of mutated tumor cells is the only source for tumor maintenance. Simulations for three different probabilities of acquiring mutations (Pmut) are shown. C, Similar plot testing the condition in which tumor maintenance depends on both stem cells and tumor cells that can gain mutations. Four combinations of initial stem cell percentage and probability of mutation acquisition are shown.
FIGURE 3
FIGURE 3
Overview of the starting geometry in 3-fold; a pathology slice, schematic representation, and model geometry visualization. A, A histology slice of a healthy prostatic acinus (H&E staining, 400x magnification). B, Schematic representation of the acinus (created with BioRender.com). C, Modeled starting geometry, including a color scheme of all cells included in the starting geometry.
FIGURE 4
FIGURE 4
Initial healthy stage and following eight steps of prostate cancer development as by prostate cancer ABM simulation. A, Healthy prostatic acinus. B, Mutations start to occur in the luminal cells converting them into tumor cells. C, The presence of mutated cells increases the influx of M1 macrophages. D, Mutated cells start to occupy spaces in the basal cell layer. E, Fibroblasts are differentiating toward their tumor-promoting phenotype (CAFs). F, Macrophages are differentiating toward their tumor-promoting phenotype. G, All these factors lead to break down of the basement membrane. H, Mutated cells become more invasive and start undergoing EMT. I, Invasive cancer with cells spreading through the surrounding tissue. The white grid spaces indicate “empty space,” corresponding to the lumen or to the cleaved ECM (e.g. by CAFs).
FIGURE 5
FIGURE 5
Comparison between model simulations and histology images (tufting and bridging). A, Pathology slice of a prostate cancer patient (H&E staining, 400x magnification) showing a “tufted” pattern of growths on the luminal cell layer. B, Model simulation depicting the tufting growth pattern. C, Pathology slice of a prostate cancer patient (H&E staining, 400x magnification) showing bridging; growth of cells from one side of the acinus toward the other side. D, Simulated prostate cancer development showing the bridging growth pattern.
FIGURE 6
FIGURE 6
Effect on tumor growth of varying sensitive model parameters. A, Grouped histogram of the repeated sensitivity analysis (five times for each parameter), overlapped by four (differently colored) histograms of the most sensitive parameters: mutation probability of luminal cells (Pmut, red), probability of CAFs promoting tumor cell proliferation (CFprom, green), yellow represents the amount of mutations needed before tumor cells affect macrophage differentiation (TUthrshM) and M1 macrophage migration probability (M1pmig, blue). B, The averaged evolution of the amount of tumor cells for 40 simulations that developed cancer for each of the eight subclasses. These classes were based on the “high” or “low” status of sensitive parameters for CAFs, TAMs, and tumor cells. Included is a violin plot depicting the spread of simulated tumor cell amounts. C, An example of tumor development for each group at an early point in the simulation (50 days), the point at which it becomes invasive and the state at the end of the simulation (400 days).
FIGURE 7
FIGURE 7
Clinical validation of model predictions for different patient groups. A, Correlation between the simulated tumor growth (simulation time 400 days, 40 simulations per modeled patient group) and the average PFS time for clinical patients assigned to the matching patients groups based on molecular markers. Colors correspond to those used in Fig. 6B, portraying simulated tumor growth over time of the same classes. B, Binary Gleason scores per patient group; Gleason scores of 8 or higher were considered “high” and Gleason scores of 6 or lower were considered “low”.

Similar articles

Cited by

References

    1. Sung H, Ferlay J, Siegel RL, Laversanne M, Soerjomataram I, Jemal A, et al. . Global cancer statistics 2020: GLOBOCAN estimates of incidence and mortality worldwide for 36 cancers in 185 countries. CA Cancer J Clin 2021;71:209–49. - PubMed
    1. Ramon J, Denis LJ. Prostate cancer. New York (NY): Springer Science & Business Media; 2007.
    1. Davidson D, Bostwick DG, Qian J, Wollan PC, Oesterling JE, Rudders RA, et al. . Prostatic intraepithelial neoplasia is a risk factor for adenocarcinoma: predictive accuracy in needle biopsies. J Urol 1995;154:1295–9. - PubMed
    1. Fahmy O, Alhakamy NA, Rizg WY, Bagalagel A, Alamoudi AJ, Aldawsari HM, et al. . Updates on molecular and biochemical development and progression of prostate cancer. J Clin Med Res 2021;10:5127. - PMC - PubMed
    1. Wang G, Zhao D, Spring DJ, DePinho RA. Genetics and biology of prostate cancer. Genes Dev 2018;32:1105–40. - PMC - PubMed