. 2022 Mar 17:1:815778.
doi: 10.3389/fnimg.2022.815778. eCollection 2022.

Decoding the Brain's Surface to Track Deeper Activity

Affiliations

Decoding the Brain's Surface to Track Deeper Activity

Mark L Tenzer et al. Front Neuroimaging. .

Abstract

Neural activity can be readily and non-invasively recorded from the scalp using electromagnetic and optical signals, but unfortunately all scalp-based techniques have depth-dependent sensitivities. We hypothesize, though, that the cortex's connectivity with the rest of the brain could serve to construct proxy signals of deeper brain activity. For example, functional magnetic resonance imaging (fMRI)-derived models that link surface connectivity to deeper regions could subsequently extend the depth capabilities of other modalities. Thus, as a first step toward this goal, this study examines whether or not surface-limited support vector regression of resting-state fMRI can indeed track deeper regions and distributed networks in independent data. Our results demonstrate that depth-limited fMRI signals can in fact be calibrated to report ongoing activity of deeper brain structures. Although much future work remains to be done, the present study suggests that scalp recordings have the potential to ultimately overcome their intrinsic physical limitations by utilizing the multivariate information exchanged between the surface and the rest of the brain.

Keywords: cerebral cortex; functional magnetic resonance imaging; multimodal; resting state connectivity; support vector machine.


Conflict of interest statement

The authors declare that the research was conducted in the absence of any commercial or financial relationships that could be construed as a potential conflict of interest.

Figures

Figure 1
Figure 1
Illustration of the surface decoding approach. Left: At each point in time, voxels from the surface of the brain (yellow) are extracted. Their intensities comprise the training features, xtrain(t). In addition, training labels, ytrain(t), are extracted from the average of voxels in a network or region of interest (green). (Not illustrated: Induction is used to train a regression model, w, that relates xtrain(t) to ytrain(t)). Right: In a new dataset, xtest(t) and ytest(t) are extracted. Combining each testing vector with the regression weights w yields the predicted testing label ŷtest (brown). In this study, the correlation between the predictions, ŷtest(t), and the true values, ytest(t), is defined as the prediction accuracy.
Figure 2
Figure 2
Masking the surface. First, a whole-brain mask was generated (A). All voxels within mask thickness m of the surface were eliminated to generate (B), containing the interior of the brain. A surface mask was then generated (AB). To eliminate the inferior surface, (B) was repeatedly translated downward along the z-axis. After the first shift, each subsequent translational iteration was added to the previous one, creating an extended inferior volume shown in (C). Finally, C was used to exclude inferior regions in the final mask (ABC).
Figure 3
Figure 3
Decoding is highly accurate across a practical range of surface-limited recording depths. Each line is a participant's average across 16 target signals (10 RSNs and 6 anatomical regions). The bold line connected by points shows the average prediction accuracy across all 13 participants. The inset replicates the plot at a magnified vertical scale to emphasize that prediction accuracy increases monotonically with mask thickness and to highlight the observation that, even within the tight range of observed correlation values, participants are highly consistent in their performance ranking across the tested mask thicknesses.
Figure 4
Figure 4
Graphical depiction of the iterative surface volumetric subdivision. Group maps were generated for each RSN and anatomical target signal using the 99-participant SVR surface models. Each significant cluster was then volumetrically subdivided to generate sparse feature sets for each target. This example shows the iterative steps used to subdivide cluster 1 in the insula target group map (see also Supplementary Table S14). The cluster spans frontal, postcentral, temporal, and parietal regions. This particular cluster was subdivided in 5 iterations, reducing 489 voxels to 17 subdivisions. Colors distinguish individual subdivisions. Subsequently, the signal average within each subdivision was used as a training/testing feature in the independent 13-participant data.
Figure 5
Figure 5
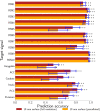
10 mm depth-limited prediction accuracies for all target signals demonstrates the general feasibility of tracking activity using the brain's surface. The full voxel resolution results are shown in maroon and the volumetrically subdivided results are shown in orange. Error bars are plus-or-minus one standard deviation. Non-parametric estimates of significance were generated from wavestrapped distributions and were corrected for multiple comparisons with respect to these 32 hypothesis tests. *** indicates corrected p < 0.001, ** indicates corrected p < 0.01, * indicates FDR-corrected p < 0.05, ∙ indicates corrected p < 0.06. ACC denotes anterior cingulate cortex. PCC denotes posterior cingulate cortex.
Figure 6
Figure 6
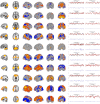
Support vector regression group maps for the ten resting-state networks from Smith et al. (2009). Left panel: The resting-state network templates (with RSN1 to RSN10 ordered from top to bottom, respectively). Center panel: Group maps from the 99-participant SVR models using the full-resolution (10 mm depth) mask for each participant (FDR-corrected p < 0.05). Group maps for all network targets are fully described in Supplementary Tables S1–S10. Right panel: The least and most accurate predictions for each target, respectively from the 13-participant data set. The actual target time series is black and the surface-limited prediction is red. Residual time series (target - predicted) are shown on the same scale below in blue. Annotations indicate the participant number, resting-state run number and correlation (r) between the target and predicted time series. For example, “Participant 1, run 2” indicates that a surface SVR model trained on that participant's run 1 data was used to decode her/his run 2 target activity (red time series). See Figure 7 for corresponding results for the six bilateral anatomical targets.
Figure 7
Figure 7
Support vector regression for the six bilateral anatomical targets. Left panel: Bilateral anatomical target regions. Ordered from top to bottom are amygdala, anterior cingulate, caudate, insula, posterior cingulate, and putamen. Center panel: Group maps from the 99-participant SVR models using the full-resolution (10 mm depth) mask for each participant (FDR-corrected p < 0.05). Group maps for all anatomical targets are fully described in Supplementary Tables S11–S16. Right panel: The least and most accurate predictions for each target, respectively from the 13-participant data set. The actual target time series is black and the surface-limited prediction is red. Residual time series (target-predicted) are shown on the same scale below in blue. Annotations indicate the participant number, resting-state run number and correlation (r) between the target and predicted time series. For example, “Participant 1, run 2” indicates that a surface SVR model trained on that participant's run 1 data was used to decode her/his run 2 target activity (red time series). See Figure 6 for corresponding RSN results.

References

    1. Amaral D. G., Price J. L. (1984). Amygdalo-cortical projections in the monkey (Macaca fascicularis). J. Comp. Neurol. 230, 465–496. 10.1002/cne.902300402 - DOI - PubMed
    1. Bickart K. C., Dickerson B. C., Barrett L. F. (2014). The amygdala as a hub in brain networks that support social life. Neuropsychologia 63, 235–248. 10.1016/j.neuropsychologia.2014.08.013 - DOI - PMC - PubMed
    1. Bickart K. C., Hollenbeck M. C., Barrett L. F., Dickerson B. C. (2012). Intrinsic amygdala-cortical functional connectivity predicts social network size in humans. J. Neurosci. 32, 14729–14741. 10.1523/JNEUROSCI.1599-12.2012 - DOI - PMC - PubMed
    1. Breakspear M., Brammer M. J., Bullmore E. T., Das P., Williams L. M. (2004). Spatiotemporal wavelet resampling for functional neuroimaging data. Hum. Brain Mapp. 23, 1–25. 10.1002/hbm.20045 - DOI - PMC - PubMed
    1. Bullmore E., Fadili J., Maxim V., Şendur L., Whitcher B., Suckling J., et al. . (2004). Wavelets and functional magnetic resonance imaging of the human brain. Neuroimage 23, S234–S249. 10.1016/j.neuroimage.2004.07.012 - DOI - PubMed

LinkOut - more resources