. 2023 Jan 16:1:1069500.
doi: 10.3389/fnimg.2022.1069500. eCollection 2022.

Inconsistencies in mapping current distribution in transcranial direct current stimulation

Affiliations

Inconsistencies in mapping current distribution in transcranial direct current stimulation

Anita S Jwa et al. Front Neuroimaging. .

Abstract

Introduction: tDCS is a non-invasive neuromodulation technique that has been widely studied both as a therapy for neuropsychiatric diseases and for cognitive enhancement. However, recent meta-analyses have reported significant inconsistencies amongst tDCS studies. Enhancing empirical understanding of current flow in the brain may help elucidate some of these inconsistencies.

Methods: We investigated tDCS-induced current distribution by injecting a low frequency current waveform in a phantom and in vivo. MR phase images were collected during the stimulation and a time-series analysis was used to reconstruct the magnetic field. A current distribution map was derived from the field map using Ampere's law.

Results: The current distribution map in the phantom showed a clear path of current flow between the two electrodes, with more than 75% of the injected current accounted for. However, in brain, the results did evidence a current path between the two target electrodes but only some portion ( 25%) of injected current reached the cortex demonstrating that a significant fraction of the current is bypassing the brain and traveling from one electrode to the other external to the brain, probably due to conductivity differences in brain tissue types. Substantial inter-subject and intra-subject (across consecutive scans) variability in current distribution maps were also observed in human but not in phantom scans.

Discussions: An in-vivo current mapping technique proposed in this study demonstrated that much of the injected current in tDCS was not accounted for in human brain and deviated to the edge of the brain. These findings would have ramifications in the use of tDCS as a neuromodulator and may help explain some of the inconsistencies reported in other studies.

Keywords: current mapping; functional magnetic resonance imaging; non-invasive neuromodulation; transcranial direct current stimulation; transcranial electrical stimulation.


Conflict of interest statement

The authors declare that the research was conducted in the absence of any commercial or financial relationships that could be construed as a potential conflict of interest.

Figures
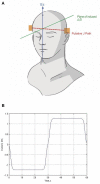
Figure 1
Figure 1
Human subject experiment setup. (A) Location of two electrodes (T3 and T4) and putative current (J) path and plane of induced magnetic field (ΔB). (B) One cycle of the current waveform (repeated six times during the scan). We used a Fermi waveform (±1.25 mA; 60-s period) for 6-min stimulation to maximize the RMS current while controlling for abrupt current transitions.
Figure 2
Figure 2
Phantom experiment setup. We crafted a gelatin phantom doped with NaCl to reduce T1 as well as add electrical conductivity. In the cartoon diagram, the two red disks on the top and bottom of the phantom indicate the location of electrodes.
Figure 3
Figure 3
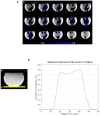
Current distribution in phantom experiment. (A) Average current distribution map across the four consecutive stimulation scans showing 3-pixel-thick slab in which total current was measured as slab location was varied. The maps demonstrate Posterior (P) to Anterior (A) current flow (Jy) in the phantom. (B) Magnitude of Posterior (P) to Anterior (A) current flow (Jy) in the 3-pixel-thick slabs in the coronal plane averaged across the four consecutive scans. The maximum total sum of the current passing through the coronal plane is 0.96 mA.
Figure 4
Figure 4
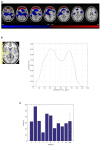
Current distribution in human subject experiments. (A) The average current distribution map across ten subjects normalized into a common atlas (MNI152_T1_2 mm) using the T2 anatomic images. The maps show Right (R) to Left (L) (Jx) current flow in the brain. The blue area shows Right to Left current flow (the primary direction). The red area shows Left to Right current flow which indicates an artifact of boundary conditions at the edge of the brain near the frontal orbital region where susceptibility changes rapidly. (B) Magnitude of Right (R) to Left (L) current flow (Jx) in 3-pixel-thick slabs in the sagittal plane in normalized space averaged across ten subjects' average current distribution maps from the four consecutive scans. The maximum total sum of the current (Jx) passing through the sagittal plane is 0.07 mA. (C) The maximum total sum of magnitude of Right (R) to Left (L) (Jx) current in 3-pixel-thick slabs in the sagittal plane in ten subjects, subject average, and standard deviation. The average maximum total sum of the current passing through the sagittal plane is 0.33 ± 0.12 mA.
Figure 5
Figure 5
Current distribution maps in four consecutive stimulation scans (repeated with no change) in the phantom and one of human subjects. (A) Current distribution maps across the four consecutive stimulation scans in the phantom. (B) Magnetic field maps across the four consecutive stimulation scans in subject10. The areas with red and blue gradient represent positive and negative polarity, respectively. (C) Current distribution maps across the four consecutive stimulation scans in subject10. The blue area shows Right to Left current (Jx) flow (the primary direction) and the red area shows Left to Right current (Jx) flow which may be an artifact of boundary conditions at the edge of the brain near the frontal orbital region where susceptibility changes rapidly.
Figure 6
Figure 6
Repeatability of the four consecutive stimulation scans in the phantom and human subjects. (A) SSIM measures of the current distribution maps across the four scans in the phantom and human subjects. For both the phantom and each human subject, we took the current distribution map from the first of the four consecutive scans as reference and calculated SSIM between the maps from the reference and second (SSIM12), the reference and third (SSIM13), and the reference and fourth scans (SSIM14) to quantify the changes in the maps. (B) SSIM measures of the structural maps across the four scans in the phantom and human subjects. (C) The normalized average SSIM measures of the current distribution maps across all subjects. The normalized SSIM measures showed a decreasing trend in the similarity of the current maps across the time [1 (SSIM12); 0.945 (SSIM13; STD = 0.126); 0.884 (SSIM14; STD = 0.139)].

Similar articles

Cited by

References

    1. Arora Y., Dutta A. (2022a). Human-in-the-Loop optimization of transcranial electrical stimulation at the point of care: a computational perspective. Brain Sci. 12, 1294. 10.3390/brainsci12101294 - DOI - PMC - PubMed
    1. Arora Y., Dutta A. (2022b). Transcranial Electrical Stimulation Effects on Neurovascular Coupling. 10.21203/rs.3.rs-1429599/v1 - DOI - PubMed
    1. Arora Y., Walia P., Hayashibe M., Muthalib M., Chowdhury S. R., Perrey S., et al. . (2021). Grey-box modeling and hypothesis testing of functional near-infrared spectroscopy-based cerebrovascular reactivity to anodal high-definition tDCS in healthy humans. PLoS Comput. Biol. 17, e1009386. 10.1371/journal.pcbi.1009386 - DOI - PMC - PubMed
    1. Berryhill M. E., Martin D. (2018). Cognitive effects of transcranial direct current stimulation in healthy and clinical populations: an overview. J. ECT. 34, e25–e35. 10.1097/YCT.0000000000000534 - DOI - PubMed
    1. Berryhill M. E., Peterson D. J., Jones K. T., Stephens J. A. (2014). Hits and misses: leveraging tDCS to advance cognitive research. Front. Psychol. 5, 800. 10.3389/fpsyg.2014.00800 - DOI - PMC - PubMed

LinkOut - more resources