. 2023 Sep 19;148(12):959-977.
doi: 10.1161/CIRCULATIONAHA.123.063332. Epub 2023 Aug 9.

Epigenetic Induction of Smooth Muscle Cell Phenotypic Alterations in Aortic Aneurysms and Dissections

Affiliations

Epigenetic Induction of Smooth Muscle Cell Phenotypic Alterations in Aortic Aneurysms and Dissections

Abhijit Chakraborty et al. Circulation. .

Abstract

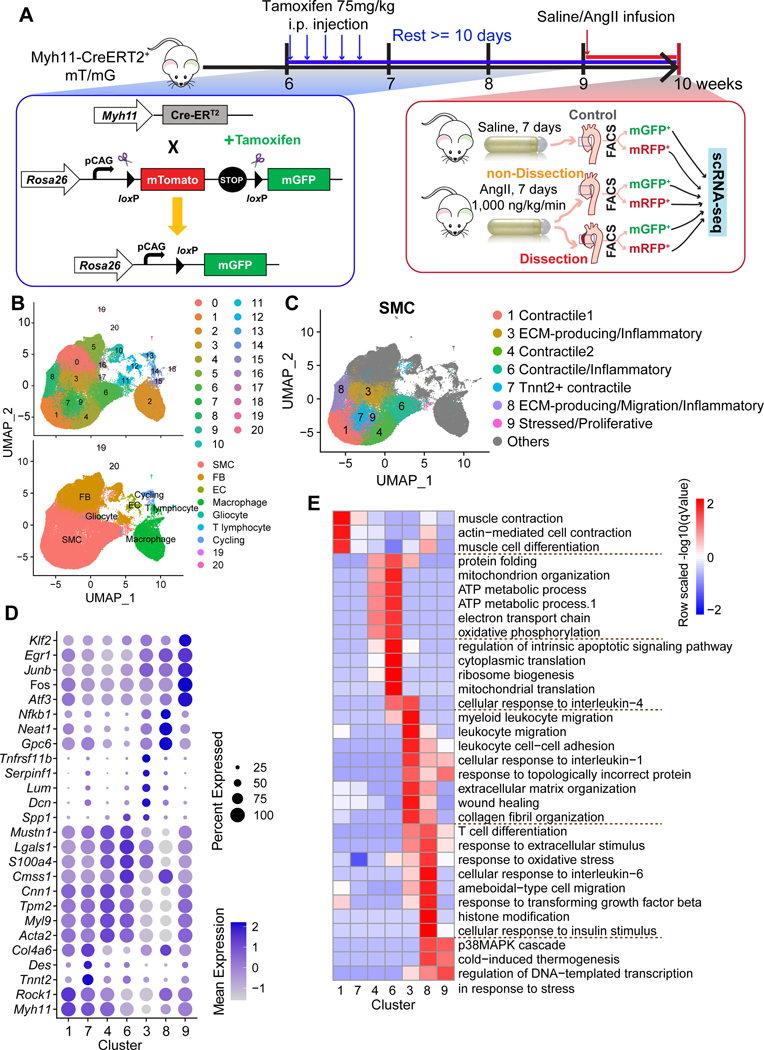
Background: Smooth muscle cell (SMC) phenotypic switching has been increasingly detected in aortic aneurysm and dissection (AAD) tissues. However, the diverse SMC phenotypes in AAD tissues and the mechanisms driving SMC phenotypic alterations remain to be identified.

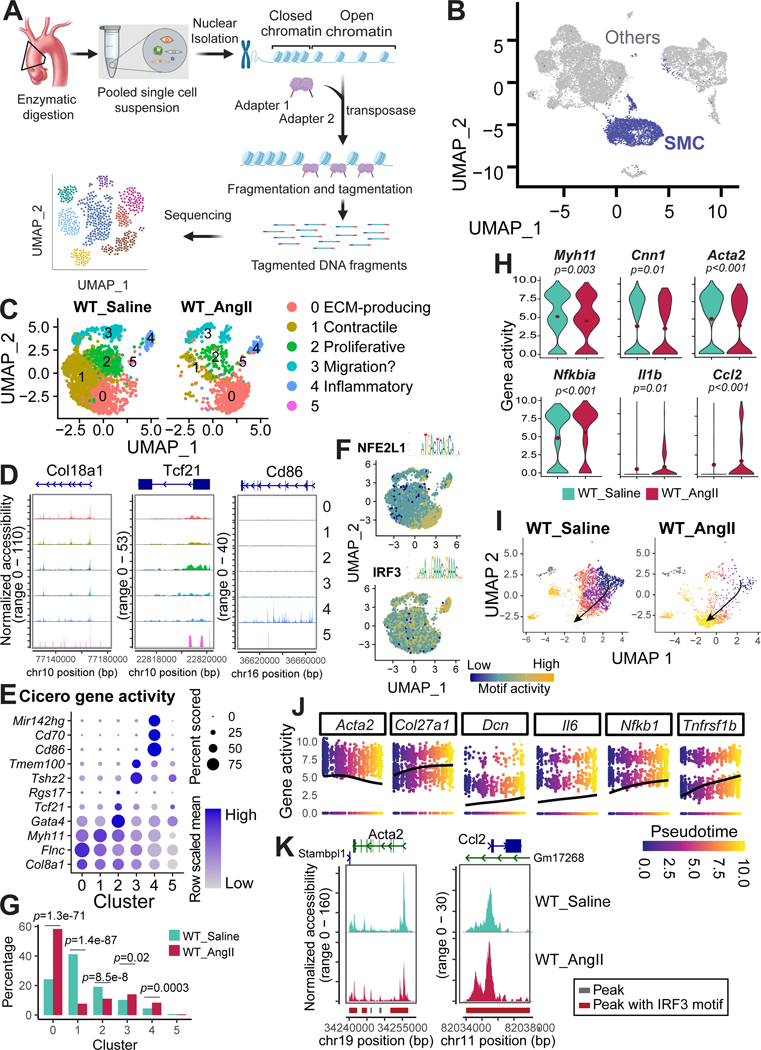
Methods: We examined the transcriptomic and epigenomic dynamics of aortic SMC phenotypic changes in mice with angiotensin II-induced AAD by using single-cell RNA sequencing and single-cell sequencing assay for transposase-accessible chromatin. SMC phenotypic alteration in aortas from patients with ascending thoracic AAD was examined by using single-cell RNA sequencing analysis.

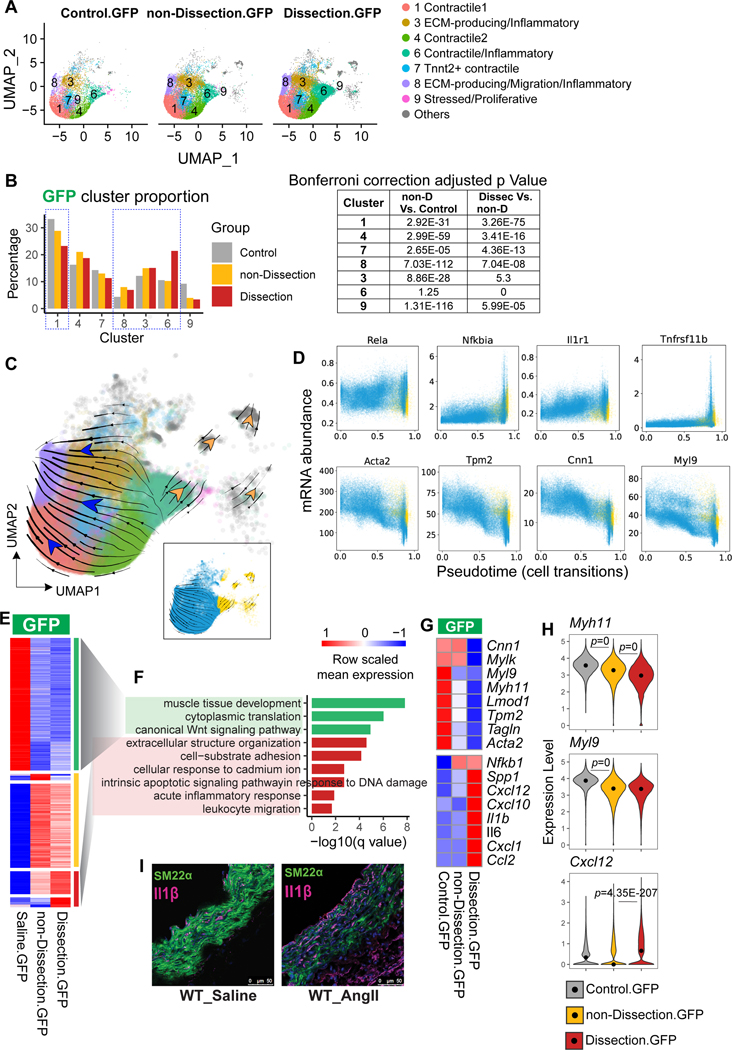
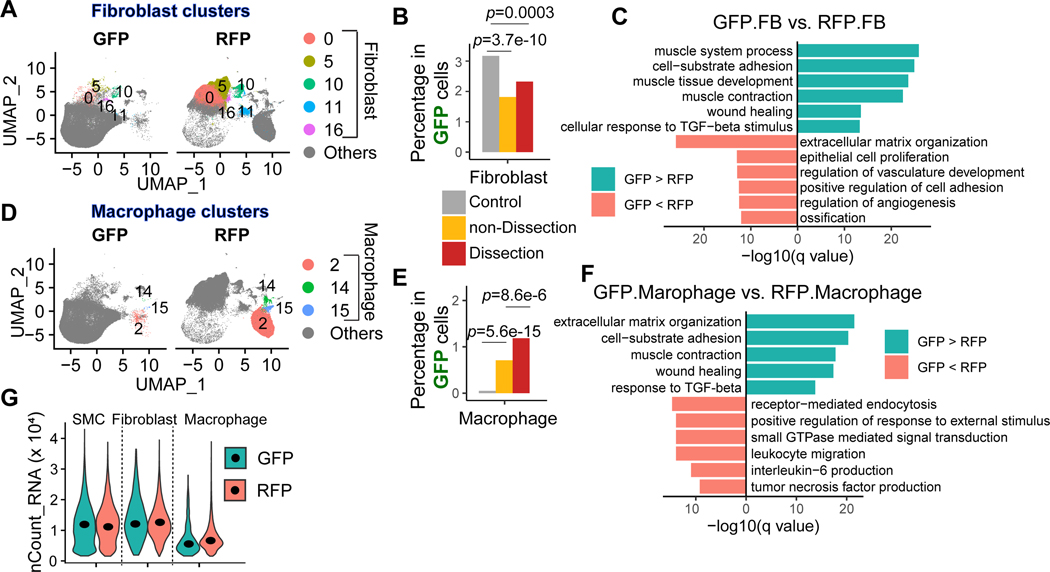
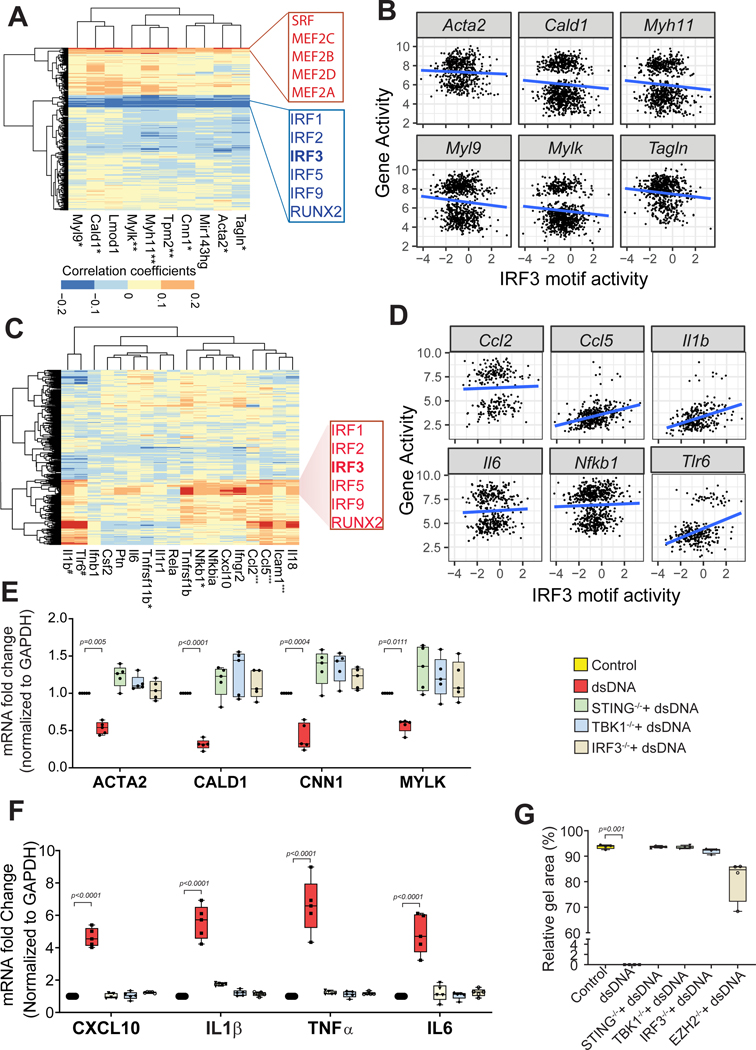
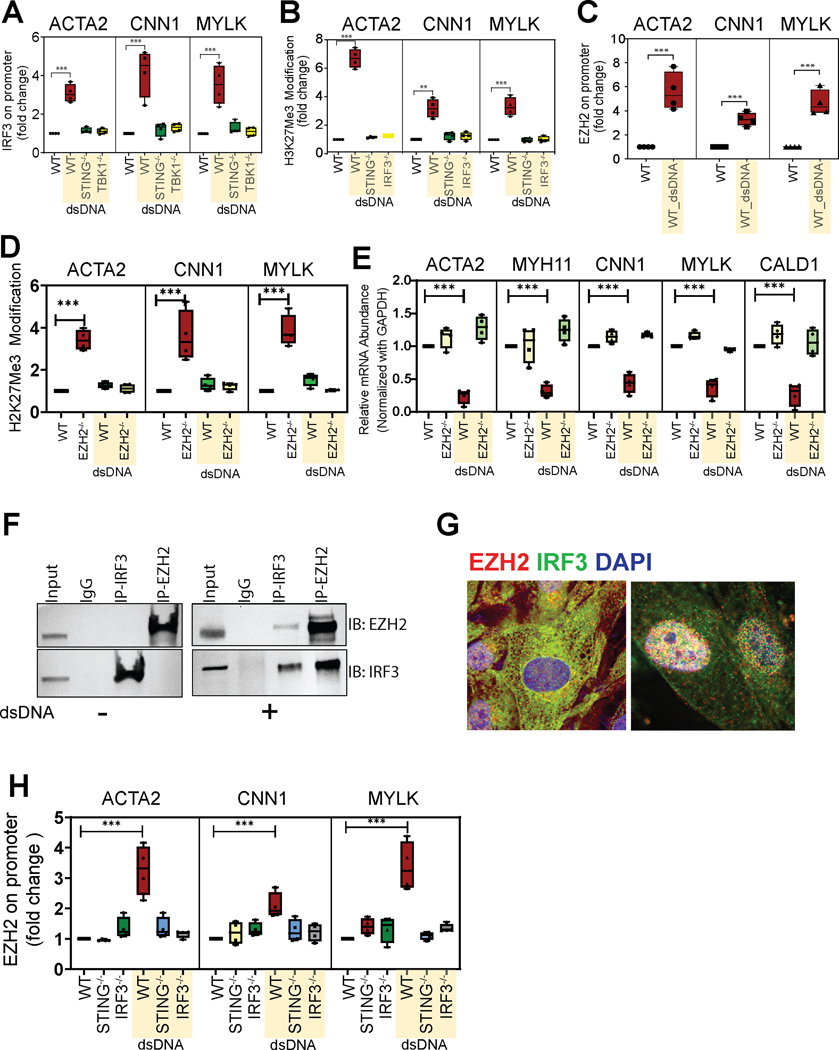
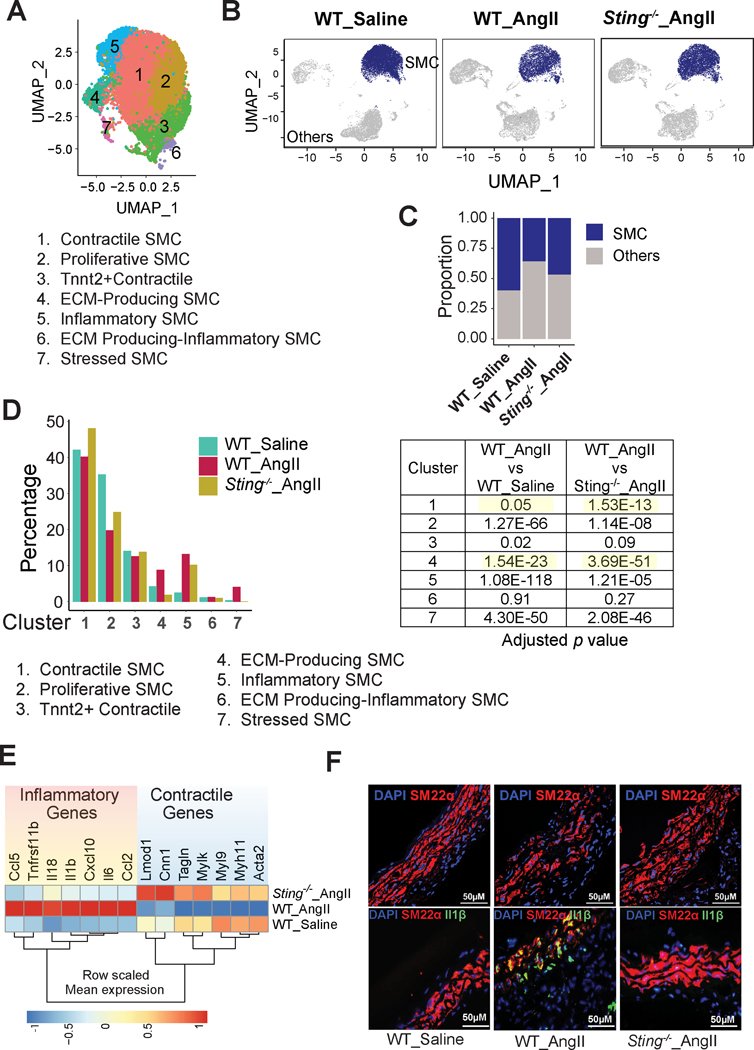
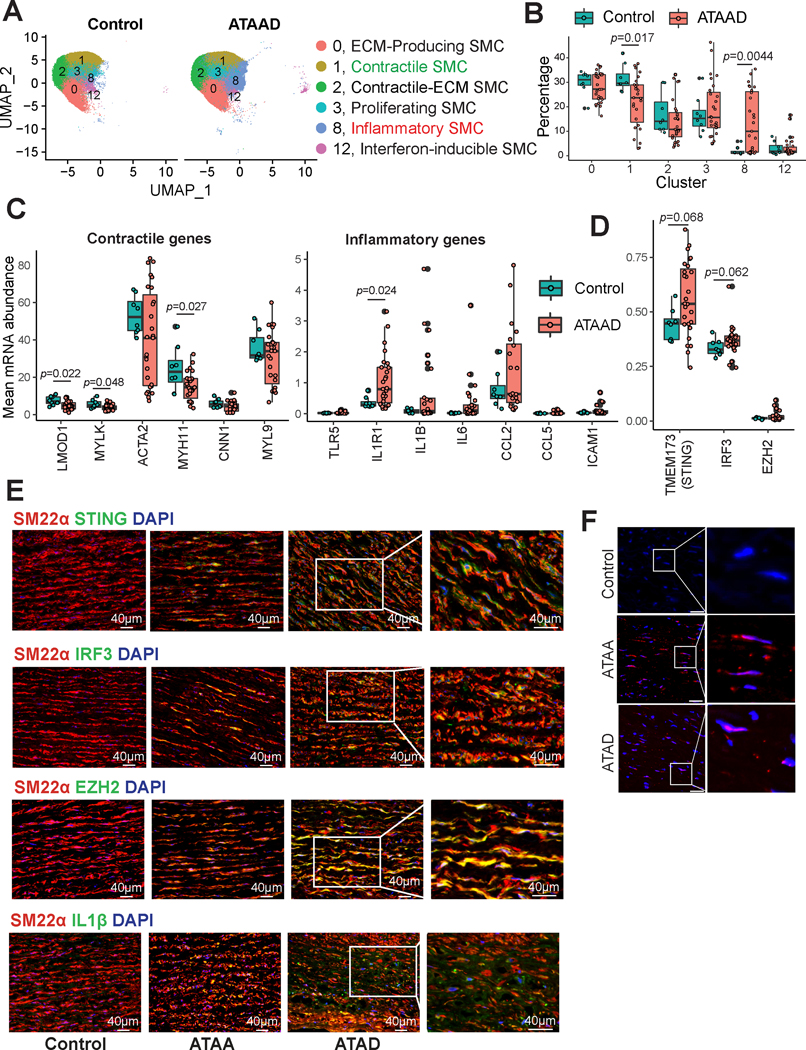
Results: Single-cell RNA sequencing analysis revealed that aortic stress induced the transition of SMCs from a primary contractile phenotype to proliferative, extracellular matrix-producing, and inflammatory phenotypes. Lineage tracing showed the complete transformation of SMCs to fibroblasts and macrophages. Single-cell sequencing assay for transposase-accessible chromatin analysis indicated that these phenotypic alterations were controlled by chromatin remodeling marked by the reduced chromatin accessibility of contractile genes and the induced chromatin accessibility of genes involved in proliferation, extracellular matrix, and inflammation. IRF3 (interferon regulatory factor 3), a proinflammatory transcription factor activated by cytosolic DNA, was identified as a key driver of the transition of aortic SMCs from a contractile phenotype to an inflammatory phenotype. In cultured SMCs, cytosolic DNA signaled through its sensor STING (stimulator of interferon genes)-TBK1 (tank-binding kinase 1) to activate IRF3, which bound and recruited EZH2 (enhancer of zeste homolog 2) to contractile genes to induce repressive H3K27me3 modification and gene suppression. In contrast, double-stranded DNA-STING-IRF3 signaling induced inflammatory gene expression in SMCs. In Sting-/- mice, the aortic stress-induced transition of SMCs into an inflammatory phenotype was prevented, and SMC populations were preserved. Finally, profound SMC phenotypic alterations toward diverse directions were detected in human ascending thoracic AAD tissues.

Conclusions: Our study reveals the dynamic epigenetic induction of SMC phenotypic alterations in AAD. DNA damage and cytosolic leakage drive SMCs from a contractile phenotype to an inflammatory phenotype.

Keywords: DNA damage; STING1 protein, human; aortic aneurysm; aortic dissection; chromatin remodeling; muscle, smooth, vascular; phenotype.


Conflict of interest statement

Disclosures Dr LeMaire serves as a consultant for Terumo Aortic and Cerus and serves as a principal investigator for clinical studies sponsored by Terumo Aortic and CytoSorbents. The other authors report no conflicts.

Figures

Figure 1.
Figure 1.. Single-cell analysis reveals the heterogeneity of cell populations in the aortic wall of SMC lineage-tracing mice.
A, Workflow for obtaining single-cell RNA-sequencing (scRNA-seq) data from Myh11-creERT2+ mT/mG lineage-tracing mice infused with saline (control mice) or angiotensin II (AngII-infused mice). The aortas were classified as control, non-dissection, and dissection. The cells were separated into GFP+ cells and RFP+ cells by flow cytometry. B, Two-dimensional uniform manifold approximation and projection (UMAP) plots showing all cells colored according to the identified 21 clusters. C, UMAP plot showing the subclusters of SMCs. A total of 7 clusters were identified. All other types of cells were colored in gray. D, Dot plot representing the conserved genes. E, Gene ontology (GO) analysis of the conserved genes for SMC subclusters.
Figure 2.
Figure 2.. Decreased contractile smooth muscle cell (SMC) population and contractile gene expression and increased pro-inflammatory SMC population and inflammatory gene expression in the aorta of angiotensin II (AngII)-infused mice.
A, Uniform manifold approximation and projection (UMAP) plots representing the intercluster similarity in the aorta among control, non-dissection, and dissection aortas with GFP+ and RFP+ cells separately. B, A bar plot representing the percentage of different SMC subclusters in the GFP+ cells from aortas of control, non-dissection, and dissection mice. The chi-square test of goodness-of-fit was performed to compare the proportion between groups; the p values were adjusted by Bonferroni correction. C-D, RNA velocity analysis was performed to estimate the transition of aortic SMCs induced by aortic challenge. E, Heatmap showing the row-scaled mean expression of DEGs identified from non-dissection vs control, and from dissection vs non-dissection. DEGs were classified according to their expression profiles across 3 samples. F, The top biological process enriched from decreased DEGs (green bars) and increased DEGs (red bars) in GFP+ SMCs of AngII-infused mice. G, Heatmap showing the mean expression of contractile and inflammatory genes expression in GFP+ SMCs in control, non-dissection, and dissection samples. H, Violin plot showing the distribution of Myh11, Myl9, and Cxcl12 expression values in GFP+ SMCs of control, non-dissection, and dissection samples. Black dots in the violins indicate the median values. The Wilcoxon rank sum test was performed to compare the genes between two groups; p values were adjusted by Bonferroni correction using all genes in the dataset. I, Immunofluorescence analysis of mT/mG lineage tracing showing SM22α and IL-1β expression in the aortic tissue of WT mice infused with saline (left panel) or AngII (right panel).
Figure 3.
Figure 3.. SMC lineage cells transformed to fibroblasts and macrophages.
A, Uniform manifold approximation and projection (UMAP) plots representing the fibroblast clusters in each sample. B, Proportion of fibroblasts in GFP+ cells in control, non-dissection, and dissection samples. C, A bar plot showing the top enriched biological process of significantly upregulated and downregulated genes in GFP+ fibroblasts compared with RFP+ fibroblasts. A one-tailed Fisher exact test was applied; all the mouse genes were set as background genes, and the p-value was adjusted by using the Benjamini-Hochberg method. The Fisher exact test was performed to compare the proportion between groups; the p values were adjusted by Bonferroni correction. D, Uniform manifold approximation and projection (UMAP) plots representing the macrophage clusters in each sample. E, Proportion of macrophages in GFP+ cells in control, non-dissection, and dissection samples. F, Bar plot showing the top enriched biological process of significantly upregulated and downregulated genes in GFP+ macrophages compared with RFP+ macrophages. A one-tailed Fisher exact test was applied; all the mouse genes were set as background genes, and the p-value was adjusted by using the Benjamini-Hochberg method. G, A violin plot showing the distribution of counts of RNA per cell in SMCs, fibroblasts, and macrophages that were GFP+ or RFP+.
Figure 4.
Figure 4.. Decreased chromatin accessibility in contractile genes and increased chromatin accessibility in inflammatory genes in aortic smooth muscle cells (SMCs) of angiotensin II (AngII)-infused mice.
A, Workflow for obtaining and analyzing single-cell sequencing assay for transposase-accessible chromatin (scATAC-seq) data from the aortic tissues of saline-infused wild-type (WT) mice infused with saline or AngII-infused WT mice. B, Uniform manifold approximation and projection (UMAP) plot showing the SMCs identified from the scATAC-seq data. C, UMAP plot showing the SMC clusters identified by re-clustering all the SMCs. D, Chromatin accessibility of at locus of several marker genes in each SMC clusters. E, Dot plot of gene activity. The activity of genes was calculated by Cicero, and genes that were identified as markers by their activity are presented in the dot plot. F, Feature plot showing the motif activity of NFE2L1 and IRF3. G, Bar plot representing the percentage of different clusters in AngII-infused WT mice versus saline-infused WT mice. The Fisher exact test was performed to examine differences in the cluster proportion between groups; the p values were adjusted by Bonferroni correction. H, Violin plots showing the expression of contractile genes and inflammatory genes in control versus AngII-infused mice. I-J, Trajectory analysis illustrating the SMC transition from well-differentiated contractile SMCs in saline-infused mice to de-differentiated SMCs in AngII-infused mice. K, scATAC-seq analysis showing accessibility and peaks detected at the chromatin regions of a selected contractile gene (Acta2, left panel) and of a selected inflammatory gene (Ccl2, right panel). Peaks harboring Irf3 motifs were highlighted in red. Accessibility was shown for SMCs under different conditions.
Figure 5.
Figure 5.. Single-cell sequencing assay for transposase-accessible chromatin (scATAC-seq) and in vitro analysis data reveals IRF3 as a key transcription factor in the inhibition of smooth muscle cell (SMC) gene expression and the induction of inflammatory gene expression in aortic SMCs.
A, Heat map showing correlation coefficients between contractile genes and SMC-related transcription factor motif activity in mouse aortic SMCs. B, Representation of correlation between IRF3 motif activity and activity of SMC contractile genes. C, Heat map showing correlation coefficients between selected inflammatory genes and SMC-related transcription factor motif activity. D, Representation of correlation between IRF3 motif activity and activity of inflammatory genes. E, Quantitative PCR analysis from cultures of human VSMCs showing that treatment with dsDNA suppresses contractile gene expression in wild-type (WT) SMCs; this was partially reversed in STING−/−, TBK1−/−, and IRF3−/− SMCs. F, Treatment with dsDNA increased inflammatory gene expression in WT SMCs that was partially prevented in STING−/−, TBK1−/−, and IRF3−/− SMCs. G, dsDNA treatment compromised SMC contraction, which was restored in STING−/−, TBK1−/−, IRF3−/−, and EZH2−/− SMCs. dsDNA: double-stranded DNA, KO: knockout. *p≤0.05; **p≤0.01; ***p≤0.0001.
Figure 6.
Figure 6.. Suppression of aortic smooth muscle cell (SMC) gene expression by IRF3 via the recruitment of EZH2 and the role of IRF3 in the induction of repressive chromatin remodeling.
Chromatin immunoprecipitation (ChIP) analysis in cultured human aortic SMCs confirms (A) the dsDNA-induced binding of IRF3 to the promoter region of selected contractile genes (ACTA2, CCN1, MYLK). Treatment with dsDNA increased H3K27me3 modification (B) and EZH2 binding (C) at the promoter of contractile genes in wild-type aortic SMCs but not in STING−/− or IRF3−/− SMCs. D, Silencing EZH2 reversed the dsDNA-induced H3K27me3 modification of selected contractile genes in aortic SMCs. E, Quantitative PCR analysis confirming that EZH2 depletion suppresses the expression of contractile genes. F, Results of a co-immunoprecipitation assay with endogenous proteins from cultured aortic SMCs confirming the EZH2-IRF3 interaction in response to dsDNA treatment. G, Immunofluorescence microscopy showing the colocalization of the individual components of the EZH2-IRF3 complex. H, ChIP assay confirmed that STING and IRF3 are necessary for the binding of EZH2 to the contractile gene promoter. dsDNA, double-stranded DNA. **p=0.0011; ***p<0.001.
Figure 7.
Figure 7.. Reduced aortic smooth muscle cell (SMC) phenotypic alterations in Sting-deficient mice.
A, Uniform manifold approximation and projection (UMAP) plot representing the distribution of SMC subclusters. A total of 7 clusters were identified. B, UMAP showing a significant reduction in the size of the SMC population in angiotensin II (AngII)-infused wild-type (WT) mice that was partially prevented in AngII-infused Sting−/− mice. C, The proportion of SMC clusters in AngII-infused Sting−/− and in saline-infused mice. D, Bar diagram showing the percentage of the cluster population in aortic SMCs of the three different groups of mice. The Fisher exact test was performed to examine differences in the cluster proportion between groups. E, Heatmap representing the differential gene expression of contractile genes and inflammatory genes in aortic SMCs of the three different groups of mice. F, Immunofluorescence staining showing Sm22α and Il-1β expression in different groups of mice.
Figure 8.
Figure 8.. Single-cell RNA sequencing (scRNA-seq) analysis of human ascending thoracic aortic aneurysm and dissection (ATAAD) tissue revealing smooth muscle cell (SMC) phenotypic switching from a contractile to an inflammatory subtype.
A, Uniform manifold approximation and projection (UMAP) plot of SMC clusters identified from scRNA-seq analysis of patient ATAAD tissue and control tissue. B, Box plot representing the percent distribution of SMC clusters. The Wilcoxon rank sum test using the cluster percentage per sample was performed to compare the cluster proportion between ATAAD and control tissues. C, Boxplot showing the mean expression of contractile genes and inflammatory genes per sample in non-diseased controls versus patient ATAAD tissues. A Wilcoxon rank sum test using the mean expression value per sample per gene was performed to compare expression between ATAAD and control tissues. D, Boxplot showing the mean expression of STING, IRF3, and EZH2 per sample in non-diseased controls versus patient ATAAD tissues. A Wilcoxon rank sum test using the mean expression value per sample per gene was performed to compare expression between ATAAD and control tissues. E, Immunofluorescence staining showing SM22α, STING, IRF3 IL-1β, and EZH2 expression in patient ATAAD tissue versus non-diseased control tissue. F, Control, thoracic aortic aneurysm without dissection (ATAA), and acute ascending thoracic aortic dissection (ATAD) tissues were used to perform a proximity ligation assay followed by analysis by fluorescence microscopy. Scale bar, 40 μm.

Similar articles

Cited by

References

    1. Beamish JA, He P, Kottke-Marchant K, Marchant RE. Molecular regulation of contractile smooth muscle cell phenotype: implications for vascular tissue engineering. Tissue Eng Part B Rev. 2010;16:467–491. - PMC - PubMed
    1. Owens GK. Regulation of differentiation of vascular smooth muscle cells. Physiol Rev. 1995;75:487–517. - PubMed
    1. Stegemann JP, Hong H, Nerem RM. Mechanical, biochemical, and extracellular matrix effects on vascular smooth muscle cell phenotype. J Appl Physiol (1985). 2005;98:2321–2327. - PubMed
    1. Wirka RC, Wagh D, Paik DT, Pjanic M, Nguyen T, Miller CL, Kundu R, Nagao M, Coller J, Koyano TK, et al. Atheroprotective roles of smooth muscle cell phenotypic modulation and the TCF21 disease gene as revealed by single-cell analysis. Nat Med. 2019;25:1280–1289. - PMC - PubMed
    1. Petsophonsakul P, Furmanik M, Forsythe R, Dweck M, Schurink GW, Natour E, Reutelingsperger C, Jacobs M, Mees B, Schurgers L. Role of vascular smooth muscle cell phenotypic switching and calcification in aortic aneurysm formation. Arterioscler Thromb Vasc Biol. 2019;39:1351–1368. - PubMed

Publication types