. 2023 Sep 29;74(18):5667-5681.
doi: 10.1093/jxb/erad279.

Experimental validation of the mechanism of stomatal development diversification

Affiliations

Experimental validation of the mechanism of stomatal development diversification

Yuki Doll et al. J Exp Bot. .

Abstract

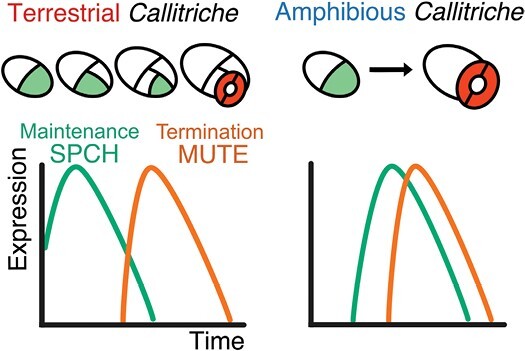
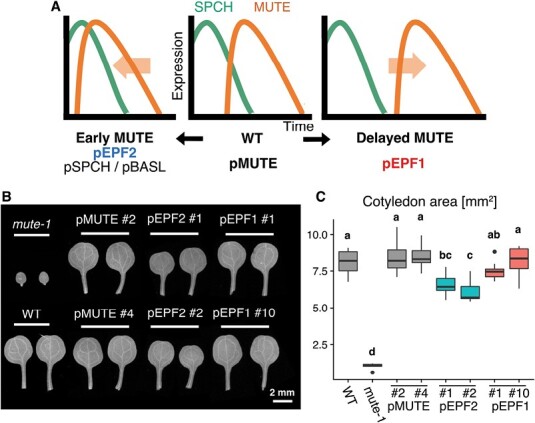
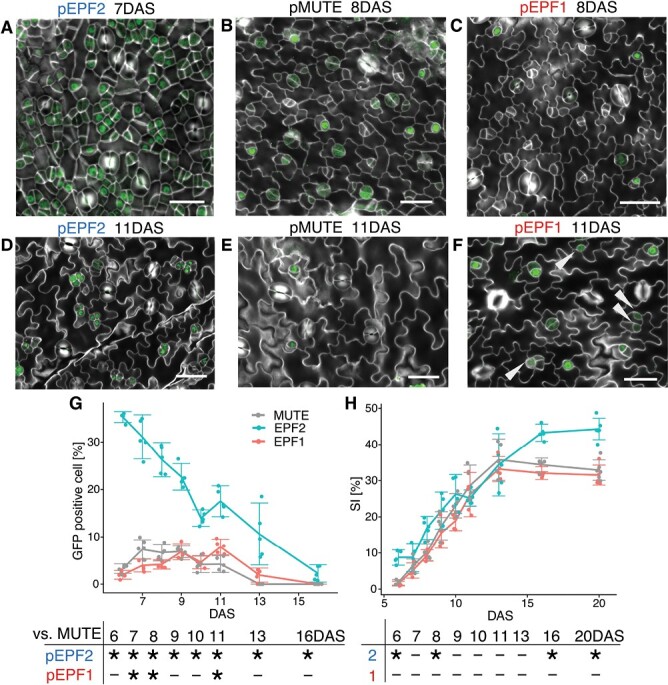
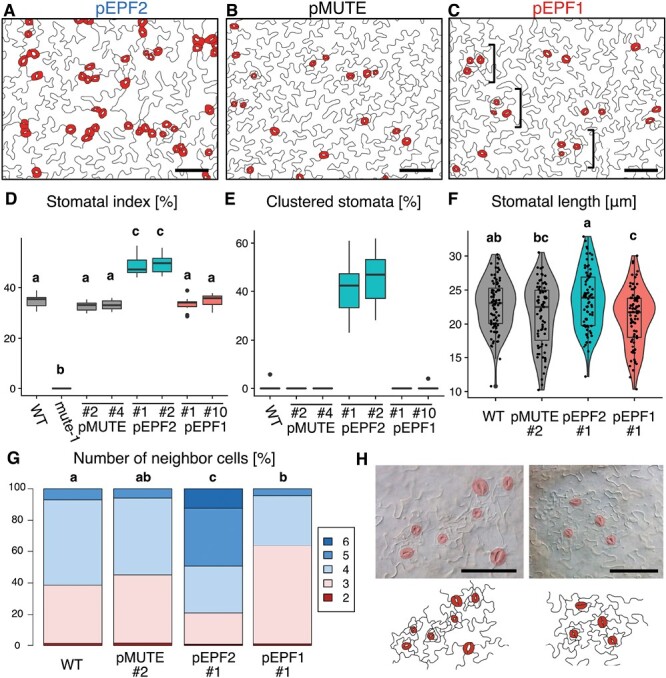
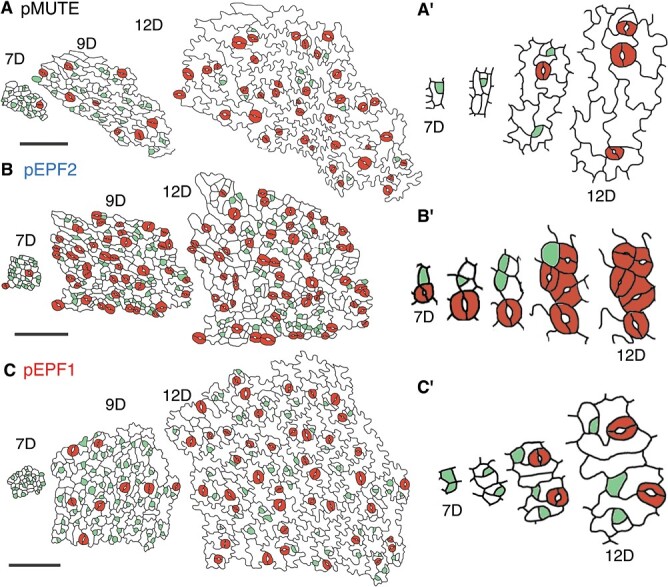
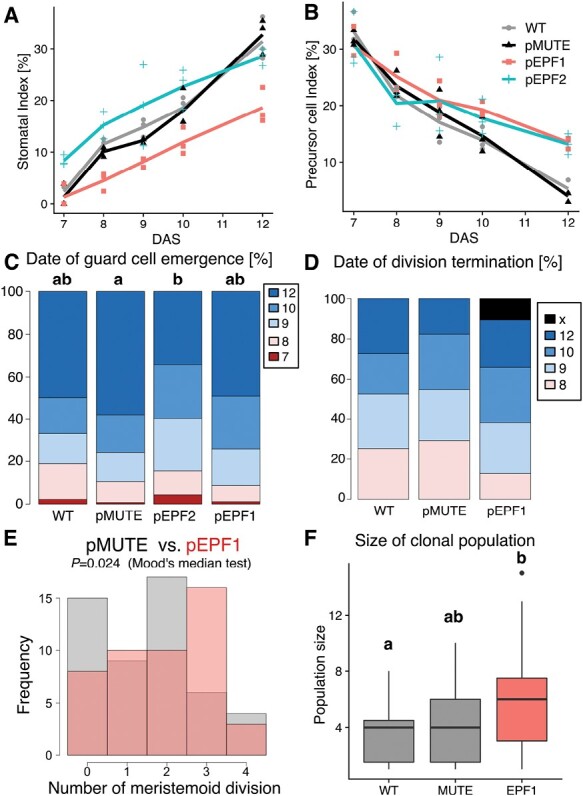
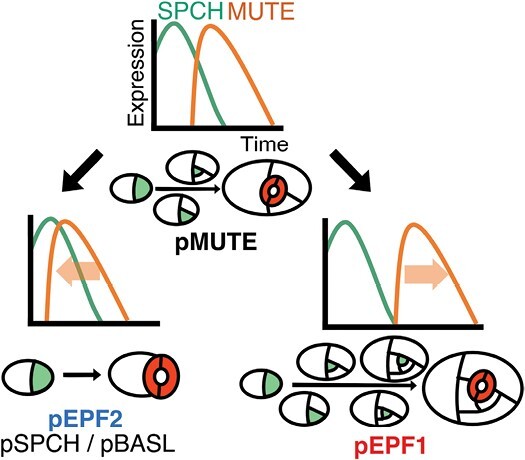
Stomata are the structures responsible for gas exchange in plants. The established framework for stomatal development is based on the model plant Arabidopsis, but diverse patterns of stomatal development have been observed in other plant lineages and species. The molecular mechanisms behind these diversified patterns are still poorly understood. We recently proposed a model for the molecular mechanisms of the diversification of stomatal development based on the genus Callitriche (Plantaginaceae), according to which a temporal shift in the expression of key stomatal transcription factors SPEECHLESS and MUTE leads to changes in the behavior of meristemoids (stomatal precursor cells). In the present study, we genetically manipulated Arabidopsis to test this model. By altering the timing of MUTE expression, we successfully generated Arabidopsis plants with early differentiation or prolonged divisions of meristemoids, as predicted by the model. The epidermal morphology of the generated lines resembled that of species with prolonged or no meristemoid divisions. Thus, the evolutionary process can be reproduced by varying the SPEECHLESS to MUTE transition. We also observed unexpected phenotypes, which indicated the participation of additional factors in the evolution of the patterns observed in nature. This study provides novel experimental insights into the diversification of meristemoid behaviors.

Keywords: Callitriche; Amplifying division; Arabidopsis; MUTE; SPEECHLESS; evo-devo; guard cells; meristemoid; stomata; stomatal development.


Conflict of interest statement

The authors declare no conflict of interest.

Figures

Fig. 1.
Fig. 1.
Graphic representation of the hypothetical molecular basis for intrageneric diversity of meristemoid behavior in the genus Callitriche. This diagram is reproduced and slightly modified from our previous study (Doll et al., 2021a). According to this model, differences in meristemoid behavior between terrestrial and amphibious Callitriche species can be attributable to differences in the temporal expression patterns of the key stomatal transcription factors SPCH and MUTE. Meristemoids are indicated in light green and guard cells are indicated in red.
Fig. 2.
Fig. 2.
Establishment of the Arabidopsis lines with early or delayed MUTE expression. (A) Schematic view of the experimental design. (B) Cotyledon morphology at 20 DAS of each of the established Arabidopsis lines, WT, and mute-1. (C) Comparison of the cotyledon area at 20 DAS. Groups labeled with different letters are significantly different (P<0.05) according to the Tukey–Kramer test (n=10).
Fig. 3.
Fig. 3.
Validation of the experimental design by MUTE–GFP fluorescence observation. (A–F) Confocal microscopy images of the abaxial surface of developing first foliage leaves in each line. The MUTE–GFP signal is shown in green, and the Calcofluor-stained cell wall is shown in gray. Bars: 25 μm. The images shown are for pEPF2 #1 at 7 DAS (A) and 11 DAS (D), pMUTE #2 at 8 DAS (B) and 11 DAS (E), and pEPF1 #1 at 8 DAS (C) and 11 DAS (F). The white arrowheads in (F) indicate meristemoids without MUTE–GFP signals, which are supposed to be still undergoing amplifying divisions. (G, H) Time-course changes in the GFP-positive cell percentage (G) and stomatal index (SI) (H). Each dot represents the data from one leaf primordium. The mean is shown with the ±95% confidence interval as an error bar. The table below each graph summarizes the results of the Brunner–Munzel test with Bonferroni correction (*P<0.05; n=5–6) for each time point.
Fig. 4.
Fig. 4.
Epidermal morphology of Arabidopsis lines with early or delayed MUTE expression. (A–C) Epidermal morphology of mature cotyledons at 20 DAS in early MUTE pEPF2 #1 (A), control pMUTE #2 (B), and delayed MUTE pEPF1 #1 (C) lines. Bars: 100 μm. The brackets in (C) indicate the clusters of stomata and small pavement cells that resemble non-contiguous stomatal clusters in helicocytic species (see also H). (D) Quantification of SI on the abaxial side of 20 DAS cotyledons of the tested lines. Groups labeled with different letters are significantly different (P<0.05) according to the Tukey–Kramer test (n=10). (E) Quantification of stomata clustering rate on the abaxial side of 20 DAS cotyledons. The number of guard cells in stomata that directly neighbor one or more stomata was divided by the total number of guard cells to calculate the percentage of clustering stomata (n=10). (F) Quantification of stomatal size in the abaxial side of 20 DAS cotyledons. Each dot represents data from one stoma. Groups labeled with different letters are significantly different (P<0.05) according to the Tukey–Kramer test (n>75 stomata, examined in six different leaves). (G) Quantification of the number of cells neighboring stomata on the abaxial side of the 20 DAS first foliage leaves. More than 50 unclustered stomata in three different leaves were examined. Groups labeled with different letters are significantly different (P<0.05) according to Mood’s median test. (H) Examples of the structure that resembles a non-contiguous stomatal cluster in helicocytic species on the abaxial surface of 20 DAS cotyledons of pEPF1 #1. Small pavement cells and stomata are clustered together in accordance with the stomatal one-cell-spacing rule. Bar: 100 μm.
Fig. 5.
Fig. 5.
Results of time-lapse analyses of epidermal impressions on the abaxial surface of developing first foliage leaves in Arabidopsis lines with early or delayed MUTE expression. The serial replicas represent impressions from 7 DAS (7D) to 12 DAS (12D). GCs are indicated in red, and stomatal precursor cells, including both meristemoids and GMCs, are in light green. (A) Control pMUTE #2 line. (B) Early MUTE pEPF2 #1 line. (C) Delayed MUTE pEPF1 line. Aʹ–Cʹ depict the typical processes of stomatal differentiation in each line, which are taken from a different series of replicas than that shown in A–C. Bars: 100 μm.
Fig. 6.
Fig. 6.
Quantification of time-lapse changes in epidermal impressions of the abaxial surface of developing first foliage leaves in Arabidopsis lines with early or delayed MUTE expression. The representative lines pMUTE #2, pEPF2 #1, and pEPF1 #1 were analysed as shown in Fig. 5. For each line, three regions from different leaves comprising more than 50 cells at 7 DAS were examined. (A, B) Time-course changes in SI (A) and PCI (B). (C) Quantification of the time point at which the stomata identified at 12 DAS underwent differentiation. Groups labeled with different letters are significantly different (P<0.05) according to Mood’s median test (n>90). (D) Quantification of the time point of division termination for all the meristemoids identified at 7 DAS (n>45). The time point at which meristemoids differentiated into GCs was calculated. ‘×’ refers to the meristemoids that were left undifferentiated at 12 DAS. pEPF2 was omitted from the analysis because of the difficulty associated with annotation of meristemoids in this line (see text). (E) Comparison of the number of divisions during the observation period (7–12 DAS) for each meristemoid identified at 7 DAS in pMUTE (gray) and pEPF1 (transparent red). The P-value according to Mood’s median test (n=46 for pEPF1 and n=51 for pMUTE) is shown. (F) Comparison of the size of the clonal population that each meristemoid identified at 7 DAS had finally produced by 12 DAS. To minimize the effect of GC production and focus on the division potential of meristemoids, symmetric divisions giving rise to stomata are ignored: the number of GCs is divided by half for calculating the population size (the number of descendant cells for each meristemoid identified at 7 DAS) at 12 DAS. Groups labeled with different letters are significantly different (P<0.05) according to the Brunner–Munzel test with Bonferroni correction (n>45).
Fig. 7.
Fig. 7.
Graphical summary of the result. By modifying the temporal expression patter of MUTE, we successfully obtained the predicted behaviors of meristemoids in each line. Stomatal precursor cells are indicated in green, and GCs are indicated in red.

References

    1. Akita K, Hasezawa S, Higaki T.. 2013. Breaking of plant stomatal one-cell-spacing rule by sugar solution immersion. PLoS One 8, e72456. - PMC - PubMed
    1. Berger D, Altmann T.. 2000. A subtilisin-like serine protease involved in the regulation of stomatal density and distribution in Arabidopsis thaliana. Genes & Development 14, 1119–1131. - PMC - PubMed
    1. Bergmann DC, Lukowitz W, Somerville CR.. 2004. Stomatal development and pattern controlled by a MAPKK kinase. Science 304, 1494–1497. - PubMed
    1. Chater C, Caine RS, Fleming AJ, Gray JE.. 2017. Origins and evolution of stomatal development. Plant Physiology 174, 624–638. - PMC - PubMed
    1. Chater CC, Caine RS, Tomek M, et al. . 2016. Origin and function of stomata in the moss Physcomitrella patens. Nature Plants 2, 16179. - PMC - PubMed

Publication types

MeSH terms

Substances