Self-Assembled Nanostructures in Aprotic Ionic Liquids Facilitate Charge Transport at Elevated Pressure
- PMID: 37555825
- PMCID: PMC10450691
- DOI: 10.1021/acsami.3c08606
Self-Assembled Nanostructures in Aprotic Ionic Liquids Facilitate Charge Transport at Elevated Pressure
Abstract
Ionic liquids (ILs), revealing a tendency to form self-assembled nanostructures, have emerged as promising materials in various applications, especially in energy storage and conversion. Despite multiple reports discussing the effect of structural factors and external thermodynamic variables on ion organization in a liquid state, little is known about the charge-transport mechanism through the self-assembled nanostructures and how it changes at elevated pressure. To address these issues, we chose three amphiphilic ionic liquids containing the same tetra(alkyl)phosphonium cation and anions differing in size and shape, i.e., thiocyanate [SCN]-, dicyanamide [DCA]-, and tricyanomethanide [TCM]-. From ambient pressure dielectric and mechanical experiments, we found that charge transport of all three examined ILs is viscosity-controlled at high temperatures. On the other hand, ion diffusion is much faster than structural dynamics in a nanostructured supercooled liquid (at T < 210 ± 3 K), which constitutes the first example of conductivity independent from viscosity in neat aprotic ILs. High-pressure measurements and MD simulations reveal that the created nanostructures depend on the anion size and can be modified by compression. For small anions, increasing pressure shapes immobile alkyl chains into lamellar-type phases, leading to increased anisotropic diffusivity of anions through channels. Bulky anions drive the formation of interconnected phases with continuous 3D curvature, which render ion transport independent of pressure. This work offers insight into the design of high-density electrolytes with percolating conductive phases providing efficient ion flow.
Keywords: charge transport mechanism; high pressure; ionic liquids; liquid−liquid phase transition; self-assembly.
Conflict of interest statement
The authors declare no competing financial interest.
Figures


 (right axis). Avrami–Avramov plot
constructed for [P666,14][DCA] at 209 K (left axis). (d)
Rate constant k of the crystallization process as
a function of inverse temperature.
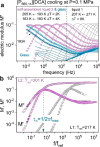
 to experimental data. Dashed lines indicate Tg and the temperature of LLT (blue and red arrows).
Zooms highlight different τσ(Tg) obtained on cooling (blue arrow) and heating (gray
arrow) scans. (b) Apparent activation energy Ea =
  calculated from dielectric data
obtained
on cooling and heating for [P666,14][SCN], [P666,14][DCA], and [P666,14][TCM].


Similar articles
-
Non-Isochronal Behavior of Charge Transport at Liquid-Liquid and Liquid-Glass Transition in Aprotic Ionic Liquids.J Phys Chem B. 2024 May 23;128(20):5118-5126. doi: 10.1021/acs.jpcb.4c00939. Epub 2024 May 14. J Phys Chem B. 2024. PMID: 38742730 Free PMC article.
-
Effect of Structure on Transport Properties (Viscosity, Ionic Conductivity, and Self-Diffusion Coefficient) of Aprotic Heterocyclic Anion (AHA) Room Temperature Ionic Liquids. 2. Variation of Alkyl Chain Length in the Phosphonium Cation.J Phys Chem B. 2016 Jun 30;120(25):5767-76. doi: 10.1021/acs.jpcb.6b03934. Epub 2016 Jun 15. J Phys Chem B. 2016. PMID: 27243107
-
Thermophysical properties of imidazolium tricyanomethanide ionic liquids: experiments and molecular simulation.Phys Chem Chem Phys. 2016 Aug 17;18(33):23121-38. doi: 10.1039/c6cp01943a. Phys Chem Chem Phys. 2016. PMID: 27492890
-
Ion and Proton Transport In Aqueous/Nonaqueous Acidic Ionic Liquids for Fuel-Cell Applications-Insight from High-Pressure Dielectric Studies.ACS Appl Mater Interfaces. 2021 Jul 7;13(26):30614-30624. doi: 10.1021/acsami.1c06260. Epub 2021 Jun 24. ACS Appl Mater Interfaces. 2021. PMID: 34164974 Free PMC article.
-
Ionic liquids: environmentally sustainable materials for energy conversion and storage applications.Environ Sci Pollut Res Int. 2024 Feb;31(7):10296-10316. doi: 10.1007/s11356-023-25468-w. Epub 2023 Jan 31. Environ Sci Pollut Res Int. 2024. PMID: 36719584 Review.
Cited by
-
Non-Isochronal Behavior of Charge Transport at Liquid-Liquid and Liquid-Glass Transition in Aprotic Ionic Liquids.J Phys Chem B. 2024 May 23;128(20):5118-5126. doi: 10.1021/acs.jpcb.4c00939. Epub 2024 May 14. J Phys Chem B. 2024. PMID: 38742730 Free PMC article.
-
Inflection Point in Pressure Dependence of Ionic Conductivity as a Fingerprint of Local Structure Formation.J Phys Chem B. 2024 May 23;128(20):5109-5117. doi: 10.1021/acs.jpcb.3c08506. Epub 2024 May 8. J Phys Chem B. 2024. PMID: 38718191 Free PMC article.
-
Structural Properties of [N1888][TFSI] Ionic Liquid: A Small Angle Neutron Scattering and Polarizable Molecular Dynamics Study.J Phys Chem B. 2024 Nov 14;128(45):11313-11327. doi: 10.1021/acs.jpcb.4c06255. Epub 2024 Nov 5. J Phys Chem B. 2024. PMID: 39498611 Free PMC article.
-
Crystallization Kinetics of Phosphonium Ionic Liquids: Effect of Cation Alkyl Chain Length and Thermal History.J Phys Chem B. 2024 Jul 11;128(27):6610-6621. doi: 10.1021/acs.jpcb.4c01720. Epub 2024 Jun 26. J Phys Chem B. 2024. PMID: 38924509 Free PMC article.
References
-
- MacFarlane D. R.; Forsyth M.; Howlett P. C.; Kar M.; Passerini S.; Pringle J. M.; Ohno H.; Watanabe M.; Yan F.; Zheng W.; Zhang S.; Zhang J. Ionic Liquids and Their Solid-State Analogues as Materials for Energy Generation and Storage. Nat. Rev. Mater. 2016, 1, 15005.10.1038/natrevmats.2015.5. - DOI
-
- Wojnarowska Z.; Grzybowska K.; Hawelek L.; Swiety-Pospiech A.; Masiewicz E.; Paluch M.; Sawicki W.; Chmielewska A.; Bujak P.; Markowski J. Molecular Dynamics Studies on the Water Mixtures of Pharmaceutically Important Ionic Liquid Lidocaine HCl. Mol. Pharmaceutics 2012, 9 (5), 1250–1261. 10.1021/mp2005609. - DOI - PubMed
LinkOut - more resources
Full Text Sources

