. 2023 Oct 1;34(11):ar106.
doi: 10.1091/mbc.E23-03-0090. Epub 2023 Aug 9.

Endoplasmic Reticulum Exit Sites scale with somato-dendritic size in neurons

Affiliations

Endoplasmic Reticulum Exit Sites scale with somato-dendritic size in neurons

Ruben Land et al. Mol Biol Cell. .

Abstract

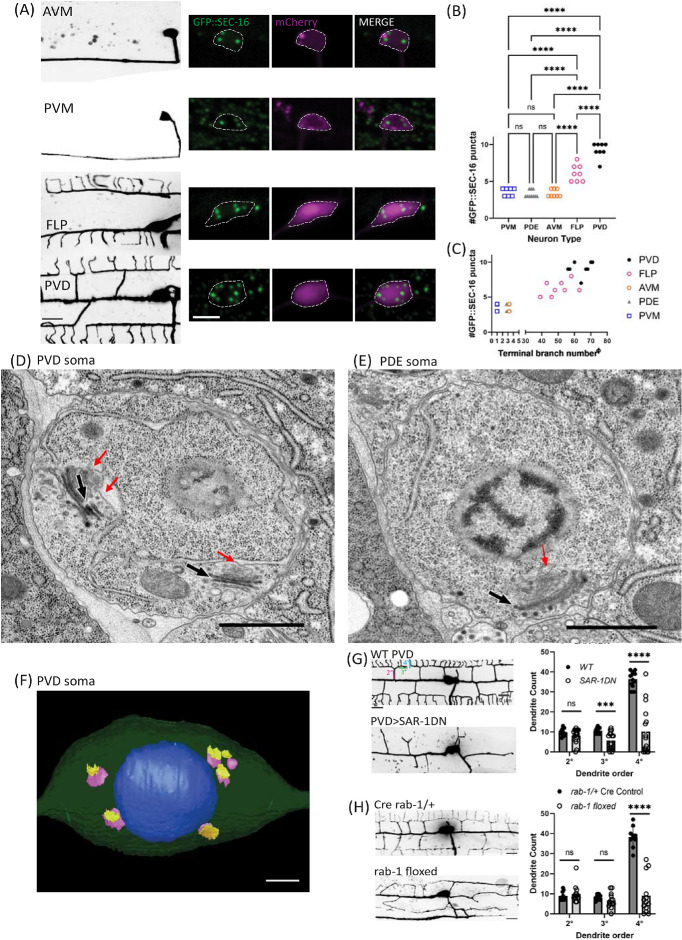
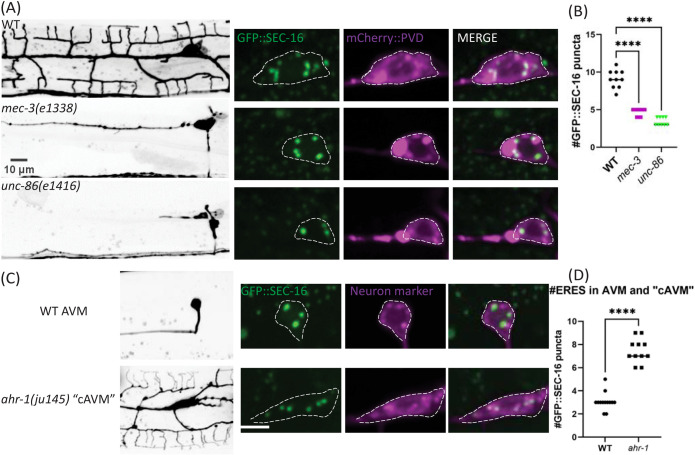
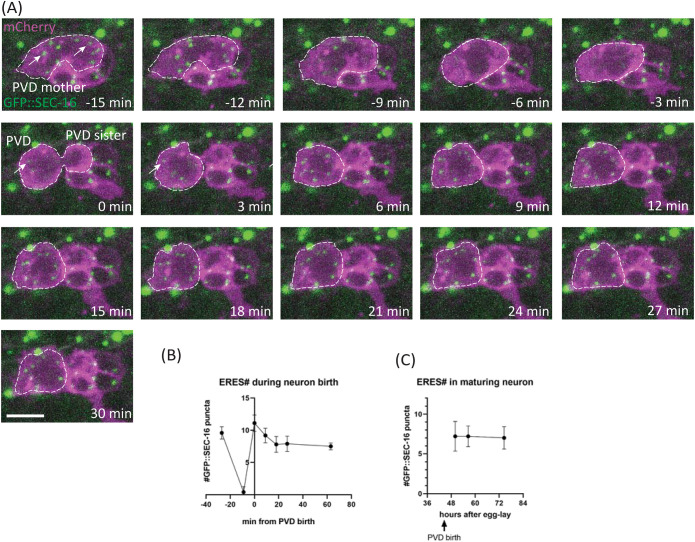
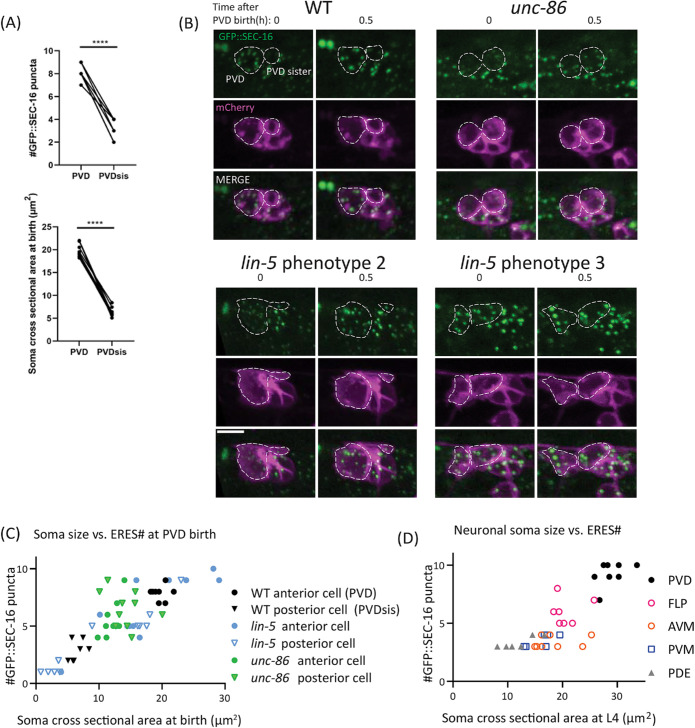
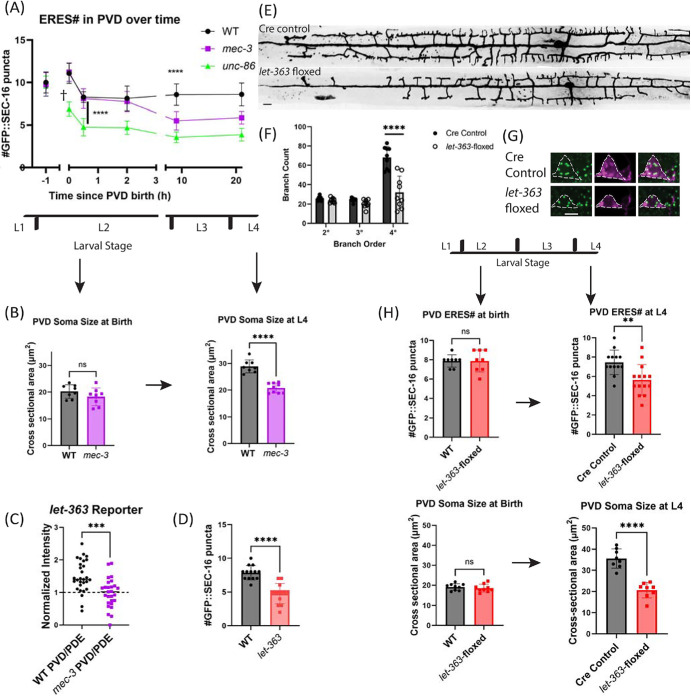
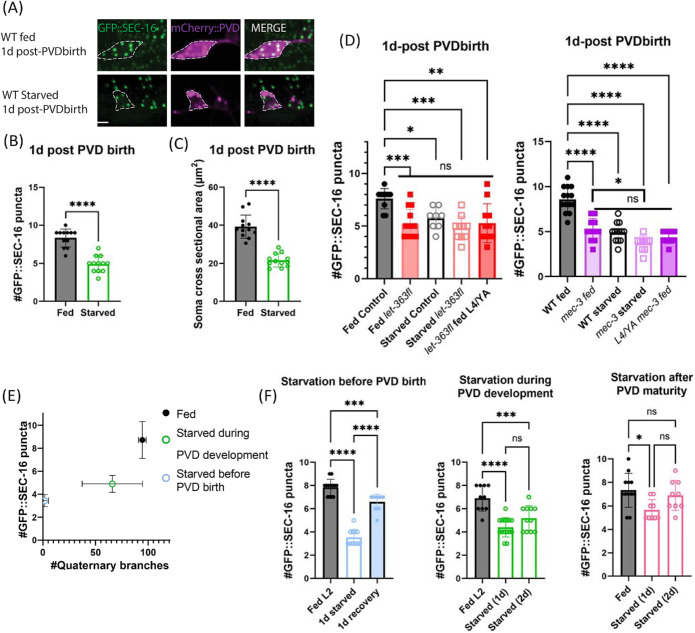
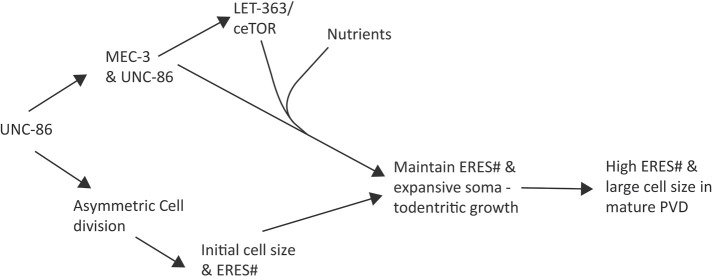
Nervous systems exhibit dramatic diversity in cell morphology and size. How neurons regulate their biosynthetic and secretory machinery to support such diversity is not well understood. Endoplasmic reticulum exit sites (ERESs) are essential for maintaining secretory flux, and are required for normal dendrite development, but how neurons of different size regulate secretory capacity remains unknown. In Caenorhabditis elegans, we find that the ERES number is strongly correlated with the size of a neuron's dendritic arbor. The elaborately branched sensory neuron, PVD, has especially high ERES numbers. Asymmetric cell division provides PVD with a large initial cell size critical for rapid establishment of PVD's high ERES number before neurite outgrowth, and these ERESs are maintained throughout development. Maintenance of ERES number requires the cell fate transcription factor MEC-3, C. elegans TOR (ceTOR/let-363), and nutrient availability, with mec-3 and ceTOR/let-363 mutant PVDs both displaying reductions in ERES number, soma size, and dendrite size. Notably, mec-3 mutant animals exhibit reduced expression of a ceTOR/let-363 reporter in PVD, and starvation reduces ERES number and somato-dendritic size in a manner genetically redundant with ceTOR/let-363 perturbation. Our data suggest that both asymmetric cell division and nutrient sensing pathways regulate secretory capacities to support elaborate dendritic arbors.


Figures

FIGURE 1:
FIGURE 1:
Larger neurons have more ERESs in their somas. (A) Confocal-fluorescence microscopic images of neuron morphology on the left (scale bar = 10 µm), with closeups of soma and an endogenous ERES marker, GFP::SEC-16, on the right (scale bar = 5 µm). Background of PVM image was removed to more clearly show PVM morphology. (B) Quantification of number of GFP::SEC-16 puncta per soma in different cell types. Significance determined by one-way ANOVA, ****p < 0.0001, n ≥ 7 animals. (C) Quantification of number of GFP::SEC-16 puncta per soma in different cell types vs. number of terminal dendrites (see Methods). X-values have been nudged slightly to increase visibility of data points for PDE (x – 0.25) and AVM (x + 0.25). Pearson correlation between ERES number and terminal-dendrite number: r = 0.9282, R2 = 0.8615, p < 0.0001, n = 41 neurons with at least seven of each type. EM images of PVD (D), and PDE (E) soma. Red arrows indicate ERES. Black & white arrows indicate Golgi stacks. Scale bars = 1 µm. (F) 3D model of PVD soma constructed from EM images showing nucleus in blue, with cis (purple), and trans (yellow) cisternae of Golgi. Scale bar = 1 µm. (G) Confocal-fluorescence microscopic images of WT PVD and PVD with exogenously expressed SAR-1 dominant negative (SAR-1DN), with quantifications of secondary (2°), tertiary (3°), and quaternary (4°) dendrites in WT (n = 12 animals) and SAR-1-DN (n = 16 animals). Significance determined by multiple t tests, ***p < 0.001, ****p < 0.0001. (H) Confocal-fluorescence microscopic images of Cre rab-1/+ heterozygous control PVD (n = 10) and rab-1 floxed PVD (n = 13), with corresponding dendrite quantifications as in (I). Results were additionally repeated in at least two independent experiments.
FIGURE 2:
FIGURE 2:
Cell-fate mutants that alter neuron size perturb ERES abundance. (A and C) confocal-fluorescence microscopy of neuron morphology of WT and mutant worms on the left (scale bars = 10 µm, with closeups of soma and an endogenous ERES marker, GFP::SEC-16, on the right (scale bar = 5 µm). (B and D) Quantification of number of GFP::SEC-16 puncta per soma. Significance determined by one-way ANOVA (n ≥ 9 animals) in (B), and Student’s t test two-tailed in (D), ****p < 0.0001, n ≥ 11. Results were additionally repeated in at least two independent experiments.
FIGURE 3:
FIGURE 3:
ERES number is established rapidly (Phase one) after neuron birth and persists over time. (A) Time-lapse confocal-fluorescence microscopic images of PVD cell birth in WT L2 worms with Plin-32::mCherry::PH labeling neuron membranes and an endogenous fusion protein GFP::SEC-16 labeling ERESs (white arrows). Scale bar = 5 µm. (B) Quantification of ERES number from long-term time-lapse imaging during PVD birth, n ≥ 9 for each time point. (C) Quantification of ERES number after PVD birth, via confocal microscopy, as worm matures, n = 10 for each time point. Results were additionally repeated in at least two independent experiments.
FIGURE 4:
FIGURE 4:
Asymmetric-cell division is important for establishment phase of ERES number. (A) Quantification of ERES number shortly after birth (top), and soma cross-sectional area at birth (bottom) in PVD and PVD sister. Significance determined by Student’s t test two-tailed, ****p < 0.0001, n = 8 for each cell-type. (B) Representative images of WT and mutant worms at PVD birth and 0.5 h after birth. unc-86 mutants (top right) consistently disrupt asymmetry of PVD birth, displaying symmetric cell division of PVD mother. lin-5 mutants sometimes increase asymmetry of division (bottom left) and sometimes reduce asymmetry of division (bottom right). Scale bar = 5 µm. (C) Quantification of cross-sectional soma area at birth vs. ERES number 30 min after birth of PVD and PVD sister in WT and mutants. Pearson correlation between soma size and ERES number: r = 0.8404, R2 = 0.7062, p < 0.0001, n = 58 cells from 29 animals (WT: n = 8, lin-5: n = 11, unc-86: n = 10). (D) Quantification of cross-sectional soma area vs. ERES number across mature neuron types at larval stage L4. Pearson correlation between soma size and ERES number: r = 0.8449, R2 = 0.7138, p < 0.0001, n = 35 cells with at least six of each type. Results were additionally repeated in at least two independent experiments.
FIGURE 5:
FIGURE 5:
MEC-3 and LET-363 maintain ERESs during neurite outgrowth in PVD. (A) Time course of ERES number in WT and cell-fate mutants. Points at t = 0 (PVD birth) were counted from time-lapse images to provide accurate timing information. Significance determined by one-way ANOVA, ****p < 0.0001, n ≥ 8 animals for each genotype at each time point. (B) Soma cross-sectional area of WT and mec-3 PVD at birth (left) and larval stage 4 (right). Significance determined by Student’s t test two-tailed ****p < 0.0001, n ≥ 8 animals. (C) Plet-363::GFP ceTOR transcriptional reporter intensity in PVD normalized to PDE intensity in WT and mec-3 animals at larval stage three. Significance determined by unpaired Student’s t test two-tailed ***p < 0.001, n = 29 (WT) & 26 (mec-3) animals. Data is from two independent experiments. (D) Quantification of number of GFP::SEC-16 puncta in WT vs. ceTOR/let-363(ok3018) constitutive mutant animal PVD somas. Significance determined by Student’s t test two-tailed ****p < 0.0001, n = 13 for each genotype. (E) Confocal-fluorescence microscopic images of PVD morphology in control and mutant worms (scale bar = 10 µm), with (F) quantification of branches. Significance determined by multiple t tests ****p < 0.0001. (G) Confocal-fluorescence microscopic images of PVD soma and endogenous ERES marker, GFP::SEC-16 in Pnhr-81::cre control worms (top) and conditionally floxed let-363 worms (bottom). Scale bar = 5 µm. (H) Quantification of number of GFP::SEC-16 puncta (top) and soma cross-sectional area (bottom) per PVD soma in control and mutant L2 (left) and L4 (right) worms. Significance determined by Student’s t test two-tailed, **p < 0.01, ****p < 0.0001, n ≥ 8 animals. Larval stages from youngest to oldest: L1, L2, L3, and L4. YA = Young Adult. Results were additionally repeated in at least one (C and H, left) or two independent experiments.
FIGURE 6:
FIGURE 6:
Stage-specific nutrient deprivation reduces PVD ERES number and somatodendritic size. (A) Confocal-fluorescence microscopy closeups of PVD soma and endogenous ERES marker, GFP::SEC-16, 1 d after PVD birth in fed or 1-d starved WT animals (scale bar = 5 µm). PVDs in fed and starved animals were quantified for (B) number of PVD GFP::SEC-16 puncta (n = 12 per condition), and (C) soma size (n = 12 per condition) measured as described in Methods. Significance determined by Student’s t test two-tailed, ****p < 0.0001. (D) Number of GFP::SEC-16 puncta in PVD soma of fed vs. starved animals in Cre-control vs let-363-floxed (left, n ≥ 8 animals for each condition) and WT vs. mec-3 animals (right, n ≥ 10 animals for each condition). Animals were counted 1 d after PVD birth except where indicated. Fed animals at this time point were in late L3 or early L4 stages. (E) Quantification of PVD quaternary dendrite number vs. ERES number in either animals that were removed from food 7 h before PVD birth and starved for 1 d (pink, n = 9), animals that were removed from food just after PVD birth and starved for 1 d (green, n = 9), or animals that were fed for the duration of the experiment until 1 d after PVD birth at the L4 larval stage (black, n = 7). Points shown are mean values for each condition with standard deviations indicated by error bars. Pearson correlation between quaternary dendrite number and ERES number across conditions: r = 0.7122, R2 = 0.5072, p (two-tailed) < 0.0001. Color coding corresponds to diagram of starvation timelines in Supplemental Figure S3. (F) Number of GFP::SEC-16 puncta in WT animals removed from nutrients at different stages of PVD development, and starved for either 1 d and recovered (left, n ≥ 11), or 2 d (middle and right, n ≥ 9). Significance for (D) and (E) determined by one-way ANOVA, *p < 0.05,**p < 0.01,***p < 0.001, ****p < 0.0001. Results were additionally repeated in at least two independent experiments.
FIGURE 7:
FIGURE 7:
Proposed model for PVD-neuron size control. A schematic summary of the molecular pathways that regulate somato-dendritic size and ERES number in PVD.

References

    1. Alberti S, Gladfelter A, Mittag T (2019). Considerations and Challenges in Studying Liquid-Liquid Phase Separation and Biomolecular Condensates. Cell 176, 419–434. - PMC - PubMed
    1. Armenti ST, Lohmer LL, Sherwood DR, Nance J (2014). Repurposing an endogenous degradation system for rapid and targeted depletion of C. elegans proteins. Development 141, 4640–4647. - PMC - PubMed
    1. Balklava Z, Pant S, Fares H, Grant BD (2007). Genome-wide analysis identifies a general requirement for polarity proteins in endocytic traffic. Nat Cell Biol 9, 1066–1073. - PubMed
    1. Barlowe C, Helenius A (2016). Cargo Capture and Bulk Flow in the Early Secretory Pathway. Annu Rev Cell Dev Biol 32, 197–222. - PubMed
    1. Baugh LR, Hu PJ (2020). Starvation Responses Throughout the Caenorhabditiselegans Life Cycle. Genetics 216, 837. - PMC - PubMed

Publication types

MeSH terms

Substances

LinkOut - more resources