. 2023 Aug 29;42(8):112951.
doi: 10.1016/j.celrep.2023.112951. Epub 2023 Aug 8.

A binary module for microbiota-mediated regulation of γδ17 cells, hallmarked by microbiota-driven expression of programmed cell death protein 1

Affiliations

A binary module for microbiota-mediated regulation of γδ17 cells, hallmarked by microbiota-driven expression of programmed cell death protein 1

Hsin-I Huang et al. Cell Rep. .

Erratum in

Abstract

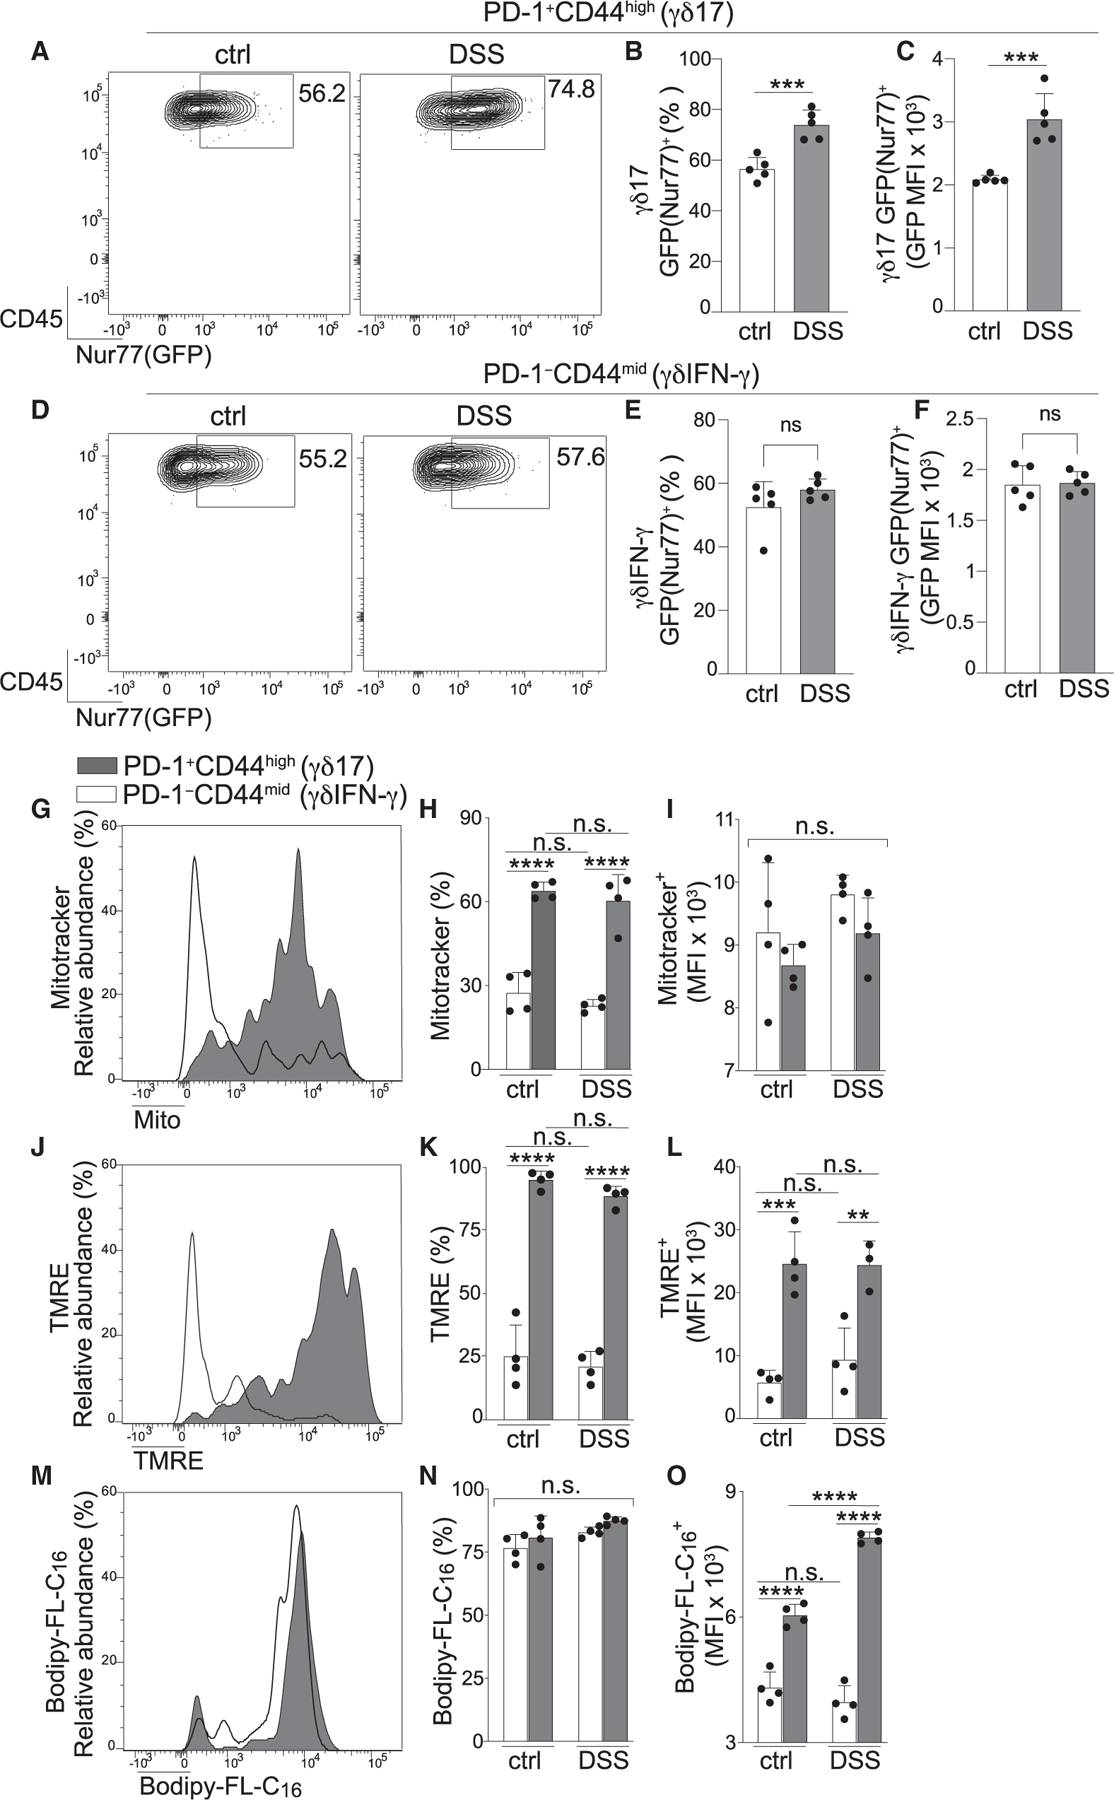
Little is known about how microbiota regulate innate-like γδ T cells or how these restrict their effector functions within mucosal barriers, where microbiota provide chronic stimulation. Here, we show that microbiota-mediated regulation of γδ17 cells is binary, where microbiota instruct in situ interleukin-17 (IL-17) production and concomitant expression of the inhibitory receptor programmed cell death protein 1 (PD-1). Microbiota-driven expression of PD-1 and IL-17 and preferential adoption of a PD-1high phenotype are conserved for γδ17 cells across multiple mucosal barriers. Importantly, microbiota-driven PD-1 inhibits in situ IL-17 production by mucosa-resident γδ17 effectors, linking microbiota to their simultaneous activation and suppression. We further show the dynamic nature of this microbiota-driven module and define an inflammation-associated activation state for γδ17 cells marked by augmented PD-1, IL-17, and lipid uptake, thus linking the microbiota to dynamic subset-specific activation and metabolic remodeling to support γδ17 effector functions in a microbiota-dense tissue environment.

Keywords: CP: Immunology; CP: Microbiology; IL-17; PD-1; T cells; female genital tract; inflammation; intestine; lung; microbiota; mucosal barrier; γδ.


Conflict of interest statement

Declaration of interests The authors declare no competing interests.

Figures

Figure 1.
Figure 1.. PD-1 expression among colon-resident γδ T cells is specific to the γδ17 subset
(A and B) Phorbol 12-myristate 13-acetate (PMA) + ionomycin stimulated IEL-γδ evaluated for PD-1 and co-expression of either IL-17 (A) or IFNγ (B). (C and D) LP-γδ analyzed as in (A) and (B). (E) Percentage of PD-1+ cells among IL-17+ or IFNγ+ LP-γδ (shaded gates in C and D). (F) LP-γδ subset by PD-1 and CD44: PD-1+CD44high (I), PD-1CD44mid (II), and PD-1CD44high (III). (G) Absolute number of the indicated population in (F). Each data point represents one mouse, and data are combined from three independent experiments. (H–J) Representative plot gated on the indicated LP-γδ population analyzed for IL-17 and IFNγ (H) and the percentages of IL-17+ (I) and IFNγ+ (J) in the indicated LP-γδ population.(K–M) Representative plot gated on the indicated LP-γδ population from Il17a-EGFP mice analyzed for GFP(IL-17)+ (K) and percentage (L) and number (M) of GFP(IL-17)+ cells in the indicated population. Each data point represents one mouse. Data in (G), (I), and (J) are combined from three independent experiments. Data in (L) and (M) are combined from five independent experiments. Data in (A)–(G) are representative of more than 10 independent experiments. Error bars represent mean ± SD. *p < 0.05, **p < 0.01, ***p < 0.001, ****p < 0.0001 (one-way ANOVA with Tukey’s post hoc test). See also Figure S1.
Figure 2.
Figure 2.. Microbiota sustain PD-1 on γδ17 cells to restrict natural IL-17 production by endogenous γδ17 effectors
(A) Colon LP γδ T cells from control or antibiotic (Abx)-treated mice. (B–D) PD-1+CD44high γδ T cells from control and Abx-treated mice evaluated for MFI of PD-1 (B) and CD44 (C) and the relative abundance of the indicated population from control and Abx-treated mice (D). (E and F) PD-1 and RORγt expression (E) and the MFI of PD-1 (F) expressed by total RORγt+ γδ T cells from control and Abx-treated mice. (G–J) Representative plot (G) and percentage of GFP(IL-17)+ cells (H) and the absolute cell number (I) and MFI (J) of GFP(IL-17)+ cells from control (ctrl) or Abx-treated Il17a-GFP mice. (K–N) Colon LP γδ T cells from mice of the indicated treatment groups were stimulated with PMA + ionomycin and analyzed for IL-17 production as in (G)–(J). (O–R) Representative plots of GFP(IL-17)+ cells among the indicated population from Il17a-GFP mice treated with the isotype (iso) ctrl (O) or anti-PD-1 (P) and the absolute number of GFP(IL-17)+ cells from PD-1+CD44high (Q) and PD-1CD44high (R) γδ T cells (gated populations in O and P) from Il17a-GFP mice from the indicated treatment group. Each data point represents one mouse and data in (H)–(J), (L)–(N), and (Q)–(R) are combined from two independent experiments. Error bars represent mean ± SD. *p < 0.05, **p < 0.01, ****p < 0.0001; n.s., not significant (unpaired Student’s t test). See also Figures S2 and S3 and Table S1.
Figure 3.
Figure 3.. Inflammation-associated activation of γδ17 cells exaggerates PD-1 and IL-17-production
(A–F) Colon LP γδ T cells from ctrl (A) or DSS-treated mice (B) and percentage of PD-1+CD44high populations (C) and their MFI of PD-1 (D) on the indicated day. Data in (D) are normalized to the average MFI for PD-1 expressed by ctrl samples analyzed on the same day. Also shown are the percentage of IL-17+ (E) and the relative MFI for IL-17 protein (F) among PMA + ionomycin-stimulated PD-1+CD44high γδ T cells in samples described in (C) and (D). Each data point represents one mouse, and data are combined from two independent experiments. (G–J) Ctrl or DSS-treated (day 7) Il17a-GFP mice analyzed for GFP(IL-17)+ (plot is gated on PD-1+CD44high γδ T cells) (G), percentage of GFP(IL-17)+ among PD-1+CD44high γδ T cells (H), the MFI for GFP(IL-17) (I), and the MFI of PD-1 among GFP and GFP(IL-17)+ populations among PD-1+CD44high γδ T cells for the indicated treatment group. Each data point represents one mouse, and data are representative of two independent experiments. Error bars represent mean ± SD. *p < 0.05, **p < 0.01, ****p < 0.0001; n.s., not significant (unpaired Student’s t test (C–I) and one-way ANOVA with Tukey’s post hoc test (J)). See also Figure S4 and Table S3.
Figure 4.
Figure 4.. Dynamic metabolic rewiring of γδ17 cells upon inflammation-associated activation enhances their lipid uptake in the colon LP
(A–F) Ctrl and DSS-treated mice evaluated for Nur77(GFP) among PD-1+CD44high (γδ17) (A–C) and PD-1CD44mid (γδIFN-γ) subsets (D–F) and Nur77(GFP) expression (A and D), percentage (B and E), and MFI of Nur77(GFP)+ populations (C and F) from either γδ17 or γδIFN-γ subsets from the indicated treatment group. (G–O) γδ17 and γδIFN-γ subsets from ctrl and DSS-treated mice were evaluated for metabolic parameters. (G–I) MitoTracker staining evaluating mitochondrial content/mass (G), percentage (H), and MitoTracker MFI (I) of MitoTracker+ cells in the indicated subset from each treatment group. (J–L) Mitochondrial activity measured by tetramethylrhodamine (TMRE) staining as in (G)–(I). (M–O) Lipid uptake evaluated by labeled palmitate (BODIPY-FL-C16) as in (G)–(I). Each data point represents one mouse, and data are representative of two independent experiments. Error bars represent mean ± SD. **p < 0.001, ***p < 0.005, ****p < 0.0001; n.s., not significant (unpaired Student’s t test (B–F) and one-way ANOVA with Tukey’s post hoc test (H–O)). See also Figure S4.

References

    1. Ribot JC, deBarros A, Pang DJ, Neves JF, Peperzak V, Roberts SJ, Girardi M, Borst J, Hayday AC, Pennington DJ, and Silva-Santos B (2009). CD27 is a thymic determinant of the balance between interferon-gamma- and interleukin 17-producing gammadelta T cell subsets. Nat. Immunol 10, 427–436. - PMC - PubMed
    1. Haas JD, González FHM, Schmitz S, Chennupati V, Föhse L, Kremmer E, Förster R, and Prinz I (2009). CCR6 and NK1.1 distinguish between IL-17A and IFN-γamma-producing gammadelta effector T cells. Eur. J. Immunol 39, 3488–3497. - PubMed
    1. Turchinovich G, and Hayday AC (2011). Skint-1 identifies a common molecular mechanism for the development of interferon-γ-secreting versus interleukin-17-secreting γδ T cells. Immunity 35, 59–68. - PubMed
    1. Haas JD, Ravens S, Düber S, Sandrock I, Oberdörfer L, Kashani E, Chennupati V, Föhse L, Naumann R, Weiss S, et al. (2012). Development of interleukin-17-producing γδ T cells is restricted to a functional embryonic wave. Immunity 37, 48–59. - PubMed
    1. Sumaria N, Grandjean CL, Silva-Santos B, and Pennington DJ (2017). Strong TCRγδ Signaling Prohibits Thymic Development of IL-17A-Secreting γδ T Cells. Cell Rep 19, 2469–2476. - PMC - PubMed

Publication types

MeSH terms

Substances