. 2023 Aug 9;9(32):eadg3800.
doi: 10.1126/sciadv.adg3800. Epub 2023 Aug 9.

A wide megafauna gap undermines China's expanding coastal ecosystem conservation

Affiliations

A wide megafauna gap undermines China's expanding coastal ecosystem conservation

Xincheng Li et al. Sci Adv. .

Abstract

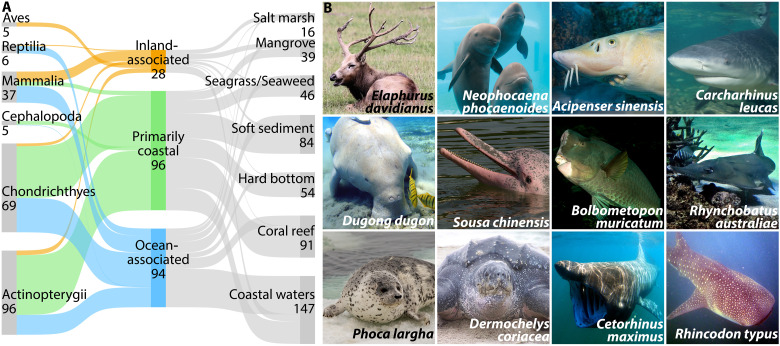
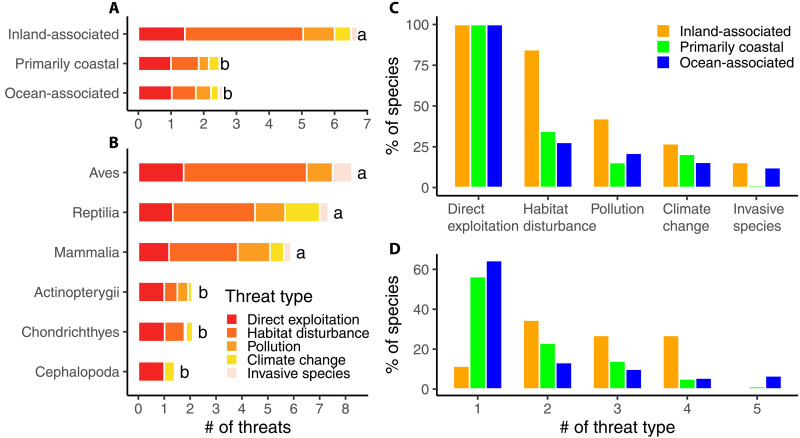
To fulfill sustainable development goals, many countries are expanding efforts to conserve ecologically and societally critical coastal ecosystems. Although megafauna profoundly affect the functioning of ecosystems, they are neglected as a key component in the conservation scheme for coastal ecosystems in many geographic contexts. We reveal a rich diversity of extant megafauna associated with all major types of coastal ecosystems in China, including 218 species of mammals, birds, reptiles, cephalopods, and fish across terrestrial and marine environments. However, 44% of these species are globally threatened, and 78% have not yet been assessed in China for extinction risk. More worrisome, 73% of these megafauna have not been designated as nationally protected species, and <10% of their most important habitats are protected. Filling this wide "megafauna gap" in China and globally would be a leading step as humanity strives to thrive with coastal ecosystems.


Figures

Fig. 1.
Fig. 1.. Many megafaunal species have habitat associations with a variety of coastal ecosystems in China.
(A) Species richness among taxonomic classes, types of coastal affinity, and associated coastal ecosystems. (B) Representative species. Because species often span multiple types of ecosystems, the bar height for types of coastal ecosystem in (A) was rescaled and is not in proportion to that for taxonomic classes. Photo credits (see table S8 for links to licenses): E. davidianus (Tim Felce, CC BY-SA 2.0), Neophocaena phocaenoides (Huangdan2060, CC BY 3.0), Acipenser sinensis (CEphoto, Uwe Aranas, CC BY-SA 3.0), Carcharhinus leucas (public domain), D. dugon (Julien Willem, GFDL), S. chinensis (Chem7, CC BY 2.0), Bolbometopon muricatum (Rickard Zerpe, CC BY 2.0), Rhynchobatus australiae (rossbennetts, CC BY 2.0), Phoca largha (jomilo75, CC BY 2.0), Dermochelys coriacea (public domain), Cetorhinus maximus (public domain), and Rhincodon typus (public domain). Photos were cropped.
Fig. 2.
Fig. 2.. Species richness of megafauna across China’s coast.
(A) Heatmap of species richness for megafauna associated with China’s coastal ecosystems. The inset in (A) illustrates human population density (59) in China’s coastal provinces in 2020. (B) The maximum species richness of megafauna in 1 km–by–1 km grids across latitude. We constrained our analysis to coastal areas ranging from supratidal, intertidal, to submerged marine neritic zones, with elevations between 5 and −200 m, all within mainland China’s coastal terrestrial areas and marine areas.
Fig. 3.
Fig. 3.. Threatened status of megafauna.
(A) Comparison of species extinction risk categories between the red lists of China and IUCN. (B) Proportion of species in different extinction risk categories according to the red lists of IUCN (wide bars) and China (narrow bars). (C) Proportion of species with population trends reported by IUCN. In (B) and (C), the numbers above each bar represent the total number of species assessed (B and C), the numbers below each bar indicate the percentage of threatened species [including EW (extinct in the wild) species] (B), or the percentage of species with a decreasing population (C), respectively. Categories: EW, CR (critically endangered), EN (endangered), VU (vulnerable), NT (near threatened), LC (least concern), DD (data deficient), and NE (not evaluated).
Fig. 4.
Fig. 4.. Anthropogenic threats to megafauna.
Average number of threats affecting megafauna per species by (A) coastal affinity and (B) taxonomic class. (C) Percent of species affected by each of the five threat types. (D) Percent of species facing a combination of threat types. Threats to species were extracted from the IUCN Red List database, and we grouped them into five threat types indicated by colors (table S6). In (A) and (B), bar length represents the average number of threats within each type of coastal affinity or taxonomic class (error bars were omitted for conciseness). Within each bar, the average number of threats per threat type across all related species is indicated using different colors. Different letters to the right of each bar indicate significant differences in the average number of threats among types of coastal affinity or taxonomic classes (alpha = 0.05).
Fig. 5.
Fig. 5.. Spatial mismatch between existing coastal PAs and important habitats for megafauna conservation.
(A) Spatial distribution of PAs and the habitat importance index for megafauna conservation. The habitat importance index was calculated on the basis of the species FUSE index. (B) Summary of the individual sizes of PAs. The box indicates the interquartile range (IQR) of 25th, 50th, and 75th percentiles. (C) Total areas of PAs. Also given is the total number of each type of PAs. (D) Proportion of PA coverage within each level of the habitat importance index for megafauna conservation (interval = 1). The dashed line indicates the top 20% quantile of the index. PAs are grouped into two categories: fully PAs (shown in red) and partially PAs (shown in orange). As boundaries are unavailable for many PAs, PAs are shown as circles of the same size instead of polygons for their actual shape.

References

    1. C. M. Duarte, S. Agusti, E. Barbier, G. L. Britten, J. C. Castilla, J.-P. Gattuso, R. W. Fulweiler, T. P. Hughes, N. Knowlton, C. E. Lovelock, H. K. Lotze, M. Predragovic, E. Poloczanska, C. Roberts, B. Worm, Rebuilding marine life. Nature 580, 39–51 (2020). - PubMed
    1. J. A. Estes, J. W. Terborgh, J. S. Brashares, M. E. Power, J. Berger, W. J. Bond, S. R. Carpenter, T. E. Essington, R. D. Holt, J. B. C. Jackson, R. J. Marquis, L. Oksanen, T. Oksanen, R. T. Paine, E. K. Pikitch, W. J. Ripple, S. A. Sandin, M. Scheffer, T. W. Schoener, J. B. Shurin, A. R. E. Sinclair, M. E. Soulé, R. Virtanen, D. A. Wardle, Trophic downgrading of planet Earth. Science 333, 301–306 (2011). - PubMed
    1. B. S. Thompson, S. M. Rog, Beyond ecosystem services: Using charismatic megafauna as flagship species for mangrove forest conservation. Environ. Sci. Policy 102, 9–17 (2019).
    1. J. Pittman, D. Armitage, Governance across the land-sea interface: A systematic review. Environ. Sci. Policy 64, 9–17 (2016).
    1. J. T. Carlton, J. Hodder, Maritime mammals: Terrestrial mammals as consumers in marine intertidal communities. Mar. Ecol. Prog. Ser. 256, 271–286 (2003).