. 2023 Aug 9;15(708):eabq1533.
doi: 10.1126/scitranslmed.abq1533. Epub 2023 Aug 9.

Core mitochondrial genes are down-regulated during SARS-CoV-2 infection of rodent and human hosts

Affiliations

Core mitochondrial genes are down-regulated during SARS-CoV-2 infection of rodent and human hosts

Joseph W Guarnieri et al. Sci Transl Med. .

Abstract

Severe acute respiratory syndrome coronavirus 2 (SARS-CoV-2) viral proteins bind to host mitochondrial proteins, likely inhibiting oxidative phosphorylation (OXPHOS) and stimulating glycolysis. We analyzed mitochondrial gene expression in nasopharyngeal and autopsy tissues from patients with coronavirus disease 2019 (COVID-19). In nasopharyngeal samples with declining viral titers, the virus blocked the transcription of a subset of nuclear DNA (nDNA)-encoded mitochondrial OXPHOS genes, induced the expression of microRNA 2392, activated HIF-1α to induce glycolysis, and activated host immune defenses including the integrated stress response. In autopsy tissues from patients with COVID-19, SARS-CoV-2 was no longer present, and mitochondrial gene transcription had recovered in the lungs. However, nDNA mitochondrial gene expression remained suppressed in autopsy tissue from the heart and, to a lesser extent, kidney, and liver, whereas mitochondrial DNA transcription was induced and host-immune defense pathways were activated. During early SARS-CoV-2 infection of hamsters with peak lung viral load, mitochondrial gene expression in the lung was minimally perturbed but was down-regulated in the cerebellum and up-regulated in the striatum even though no SARS-CoV-2 was detected in the brain. During the mid-phase SARS-CoV-2 infection of mice, mitochondrial gene expression was starting to recover in mouse lungs. These data suggest that when the viral titer first peaks, there is a systemic host response followed by viral suppression of mitochondrial gene transcription and induction of glycolysis leading to the deployment of antiviral immune defenses. Even when the virus was cleared and lung mitochondrial function had recovered, mitochondrial function in the heart, kidney, liver, and lymph nodes remained impaired, potentially leading to severe COVID-19 pathology.


Conflict of interest statement

Competing interests: R.E.S. is a paid consultant and on the scientific advisory boards of Miromatrix Inc. and Lime Therapeutics and is a consultant for Alnylam Inc. D.C.W. is a paid consultant and on the scientific advisory boards of Pano Therapeutics Inc. and Medical Excellent Capital. The other authors declare that they have no competing interests.

Figures

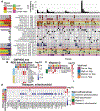
Fig. 1.
Fig. 1.. Mitochondrial OXPHOS complex gene expression in nasopharyngeal samples from patients with COVID-19.
(A) Lollipop plots of custom-curated mitochondria gene sets were determined by fGSEA for nasopharyngeal samples from patients with COVID-19 and were ranked by nominal enrichment score (NES). The size of the symbols represents the FDR. (B) Heatmaps of t-score statistics for specific mitochondrial complex gene expression are shown. (C) Coordinate changes in clusters of OXPHOS structural and assembly genes by QLattice analysis show the directional changes of the specific OXPHOS modules by Pearson’s correlation and the statistical significance by −log10 (P value).
Fig. 2.
Fig. 2.. Mitochondrial OXPHOS complex gene expression in nasopharyngeal samples and autopsy tissues from patients with COVID-19.
(A) Lollipop plots for statistically significant changes in custom mitochondria and MitoPathway gene sets were determined by fGSEA for nasopharyngeal samples and autopsy tissues from patients with COVID-19 and were ranked by NES. The size of the symbols represents the FDR. (B) Heatmaps display the t-score statistics for specific mitochondrial OXPHOS complex genes when comparing autopsy tissue and nasopharyngeal samples from COVID-19–positive and COVID-19–negative patients. (C) Coordinate changes in clusters of OXPHOS structural and assembly genes by QLattice analysis show the directional changes in gene expression by Pearson’s correlation and the statistical significance by −log10 (P value).
Fig. 3.
Fig. 3.. Mitochondrial and cytosolic bioenergetic pathway gene expression in nasopharyngeal and autopsy samples from patients with COVID-19.
(A) Lollipop plots for statistically significant custom mitochondria and MitoPathway bioenergetic gene sets were determined by fGSEA for nasopharyngeal samples and autopsy tissues (lung, heart, kidney, liver, and lymph node) from patients with COVID-19 and were ranked by NES. (B) The circular heatmap displays the t-score statistics for mitochondrial metabolic pathway genes when comparing nasopharyngeal and autopsy samples from patients with and without COVID-19. (C) Lollipop plots for statistically significant changes in cellular metabolic gene sets were determined by fGSEA for nasopharyngeal and autopsy tissues from patients with COVID-19 and were ranked by NES. (D) The circular heatmap displays the t-score statistics for cytosolic metabolic genes when comparing nasopharyngeal and autopsy samples from patients with and without COVID-19.
Fig. 4.
Fig. 4.. HIF-1α, mTOR, and ISR pathway gene expression in nasopharyngeal and autopsy samples from patients with COVID-19.
(A) Lollipop plots for statistically significant HIF-1α, mTOR, and integrated stress response (ISR) pathway gene sets determined by fGSEA for nasopharyngeal and autopsy (lung, heart, kidney, liver, and lymph node) samples from patients with COVID-19 were ranked by NES. (B) The circular heatmap displays the t-score statistics for HIF-1α and HIF-1α target genes in nasopharyngeal and autopsy samples that did or did not contain SARS-CoV-2 viral loads. (C) Heatmap displays the t-score statistics for mTOR genes in nasopharyngeal and autopsy samples that did or did not contain SARS-CoV-2 viral loads. (D) Heatmap displays the t-score statistics for ISR pathway genes in nasopharyngeal and autopsy samples that did or did not contain SARS-CoV-2 viral loads.
Fig. 5.
Fig. 5.. SARS-CoV-2 induction of miR-2392 modulates mitochondrial transcription of mtDNA- and nDNA-encoded bioenergetic genes.
(A) Left: Gene map of human mtDNA showing the opposing H-strand and L-strand promoters and the putative miR-2392 binding site in the MT-TQ tRNAGln gene. (A) Right: Comparison of mtDNA transcripts (i.e., t scores) in nasopharyngeal and autopsy samples from patients who were COVID-19–positive or COVID-19–negative, and the effects of miR-2392 mimic treatment in 3D HUVEC-MT cells and SH-SY5Y cells compared with untreated cells. (B) Statistical significance or the presence of miR-2392 seed sequences in nDNA-encoded mitochondrial pathway genes is indicated by −log10 (adj. P value). (C) Lollipop plots for statistically significant changes in bioenergetic and metabolic pathway gene sets were determined by fGSEA for 3D HUVEC-MT tissue and SH-SY5Y cells treated with a miR-2392 mimic and were ranked by NES. (D) Heatmap of bioenergetic gene transcripts displays the t-score statistics for miR-2392 mimic–treated 3D HUVEC-MT tissue and SH-SY5Y cells. (E) Correlation plot of OXPHOS complex gene expression shows a close association between OXPHOS gene expression in miR-2392 mimic–treated 3D HUVEC-MT tissue and SH-SY5Y cells and that in nasopharyngeal samples from patients with COVID-19. (F to J) Heatmaps display t-score statistics for miR-2392 mimic–treated 3D HUVEC-MT tissue and SH-SY5Y cells for HIF-1α pathway genes (F), mitochondrial metabolic pathway genes (G), cytosolic metabolic genes (H), ISR pathway genes (I), and mTOR pathway genes (J).
Fig. 6.
Fig. 6.. Metabolic flux in nasopharyngeal and autopsy samples from patients with COVID-19.
RNA-seq analysis revealed metabolic flux in nasopharyngeal and autopsy samples from patients with COVID-19. (A) Shown is an upset plot of the overlapping up-regulated and down-regulated metabolic fluxes from RNA-seq of nasopharyngeal and autopsy samples from patients with COVID-19. Dark red dots represent the up-regulated metabolic fluxes and dark blue dots represent the down-regulated metabolic fluxes. The bar chart at the top shows the number of overlapping metabolic fluxes for each intersection or overlap. The set size bar plot represents the total number of metabolic fluxes contained in each row. (B to D) Heatmaps show the log2 fold change in metabolic fluxes in the OXPHOS/ROS detoxification pathway (B), the vitamin D pathway (C), and mitochondrial transport pathways (D). The color bars represent the log2 fold change values, with red indicating up-regulation and blue indicating down-regulation (low but significant values may not be apparent).
Fig. 7.
Fig. 7.. Mitochondrial transcripts in SARS-CoV-2–infected hamster tissues.
Shown is mitochondrial transcript analysis in SARS-CoV-2–infected hamster tissues including the hearts, lungs, kidneys, olfactory bulbs, cerebella, and striata. (A) Lollipop plots for statistically significant custom mitochondria and MitoPathway gene sets were determined by fGSEA and were ranked by NES. (B) Heatmaps display the t-score statistics for mitochondrial-specific genes in SARS-CoV-2–infected hamster tissues including the hearts, lungs, kidneys, olfactory bulbs, cerebella, and striata.
Fig. 8.
Fig. 8.. Mitochondrial transcripts in SARS-CoV-2–infected mouse lung tissues.
(A) Shown is an upset plot of the overlapping MitoCarta genes when comparing lungs from SARS-CoV-2–infected wild-type BALB/c mice and C57BL/6 mice. (B) Heatmaps display the t-score statistics for mitochondrial-specific genes in SARS-CoV-2–infected BALB/c and C57BL/6 mouse lungs.

References

    1. Saleh J, Peyssonnaux C, Singh KK, Edeas M, Mitochondria and microbiota dysfunction in COVID-19 pathogenesis. Mitochondrion 54, 1–7 (2020). - PMC - PubMed
    1. Singh KK, Chaubey G, Chen JY, Suravajhala P, Decoding SARS-CoV-2 hijacking of host mitochondria in COVID-19 pathogenesis. Am. J. Physiol. Cell Physiol. 319, C258–C267 (2020). - PMC - PubMed
    1. Jamison DA Jr., Narayanan SA, Trovão NS, Guarnieri JW, Topper MJ, Moraes-Vieira PM, Zaksas V, Singh KK, Wurtele ES, Beheshti A, A comprehensive SARS-CoV-2 and COVID-19 review, Part 1: Intracellular overdrive for SARS-CoV-2 infection. Eur. J. Hum. Genet. 30, 889–898 (2022). - PMC - PubMed
    1. Ramachandran K, Maity S, Muthukumar AR, Kandala S, Tomar D, Abd el-Aziz TM, Allen C, Sun Y, Venkatesan M, Madaris TR, Chiem K, Truitt R, Vishnu N, Aune G, Anderson A, Martinez-Sobrido L, Yang W, Stockand JD, Singh BB, Srikantan S, Reeves WB, Madesh M, SARS-CoV-2 infection enhances mitochondrial PTP complex activity to perturb cardiac energetics. iScience 25, 103722 (2022). - PMC - PubMed
    1. West AP, Shadel GS, Mitochondrial DNA in innate immune responses and inflammatory pathology. Nat. Rev. Immunol. 17, 363–375 (2017). - PMC - PubMed

Publication types