. 2023 Sep 15:382:578168.
doi: 10.1016/j.jneuroim.2023.578168. Epub 2023 Aug 2.

Prolonged STAT1 activation in neurons drives a pathological transcriptional response

Affiliations

Prolonged STAT1 activation in neurons drives a pathological transcriptional response

Danielle N Clark et al. J Neuroimmunol. .

Abstract

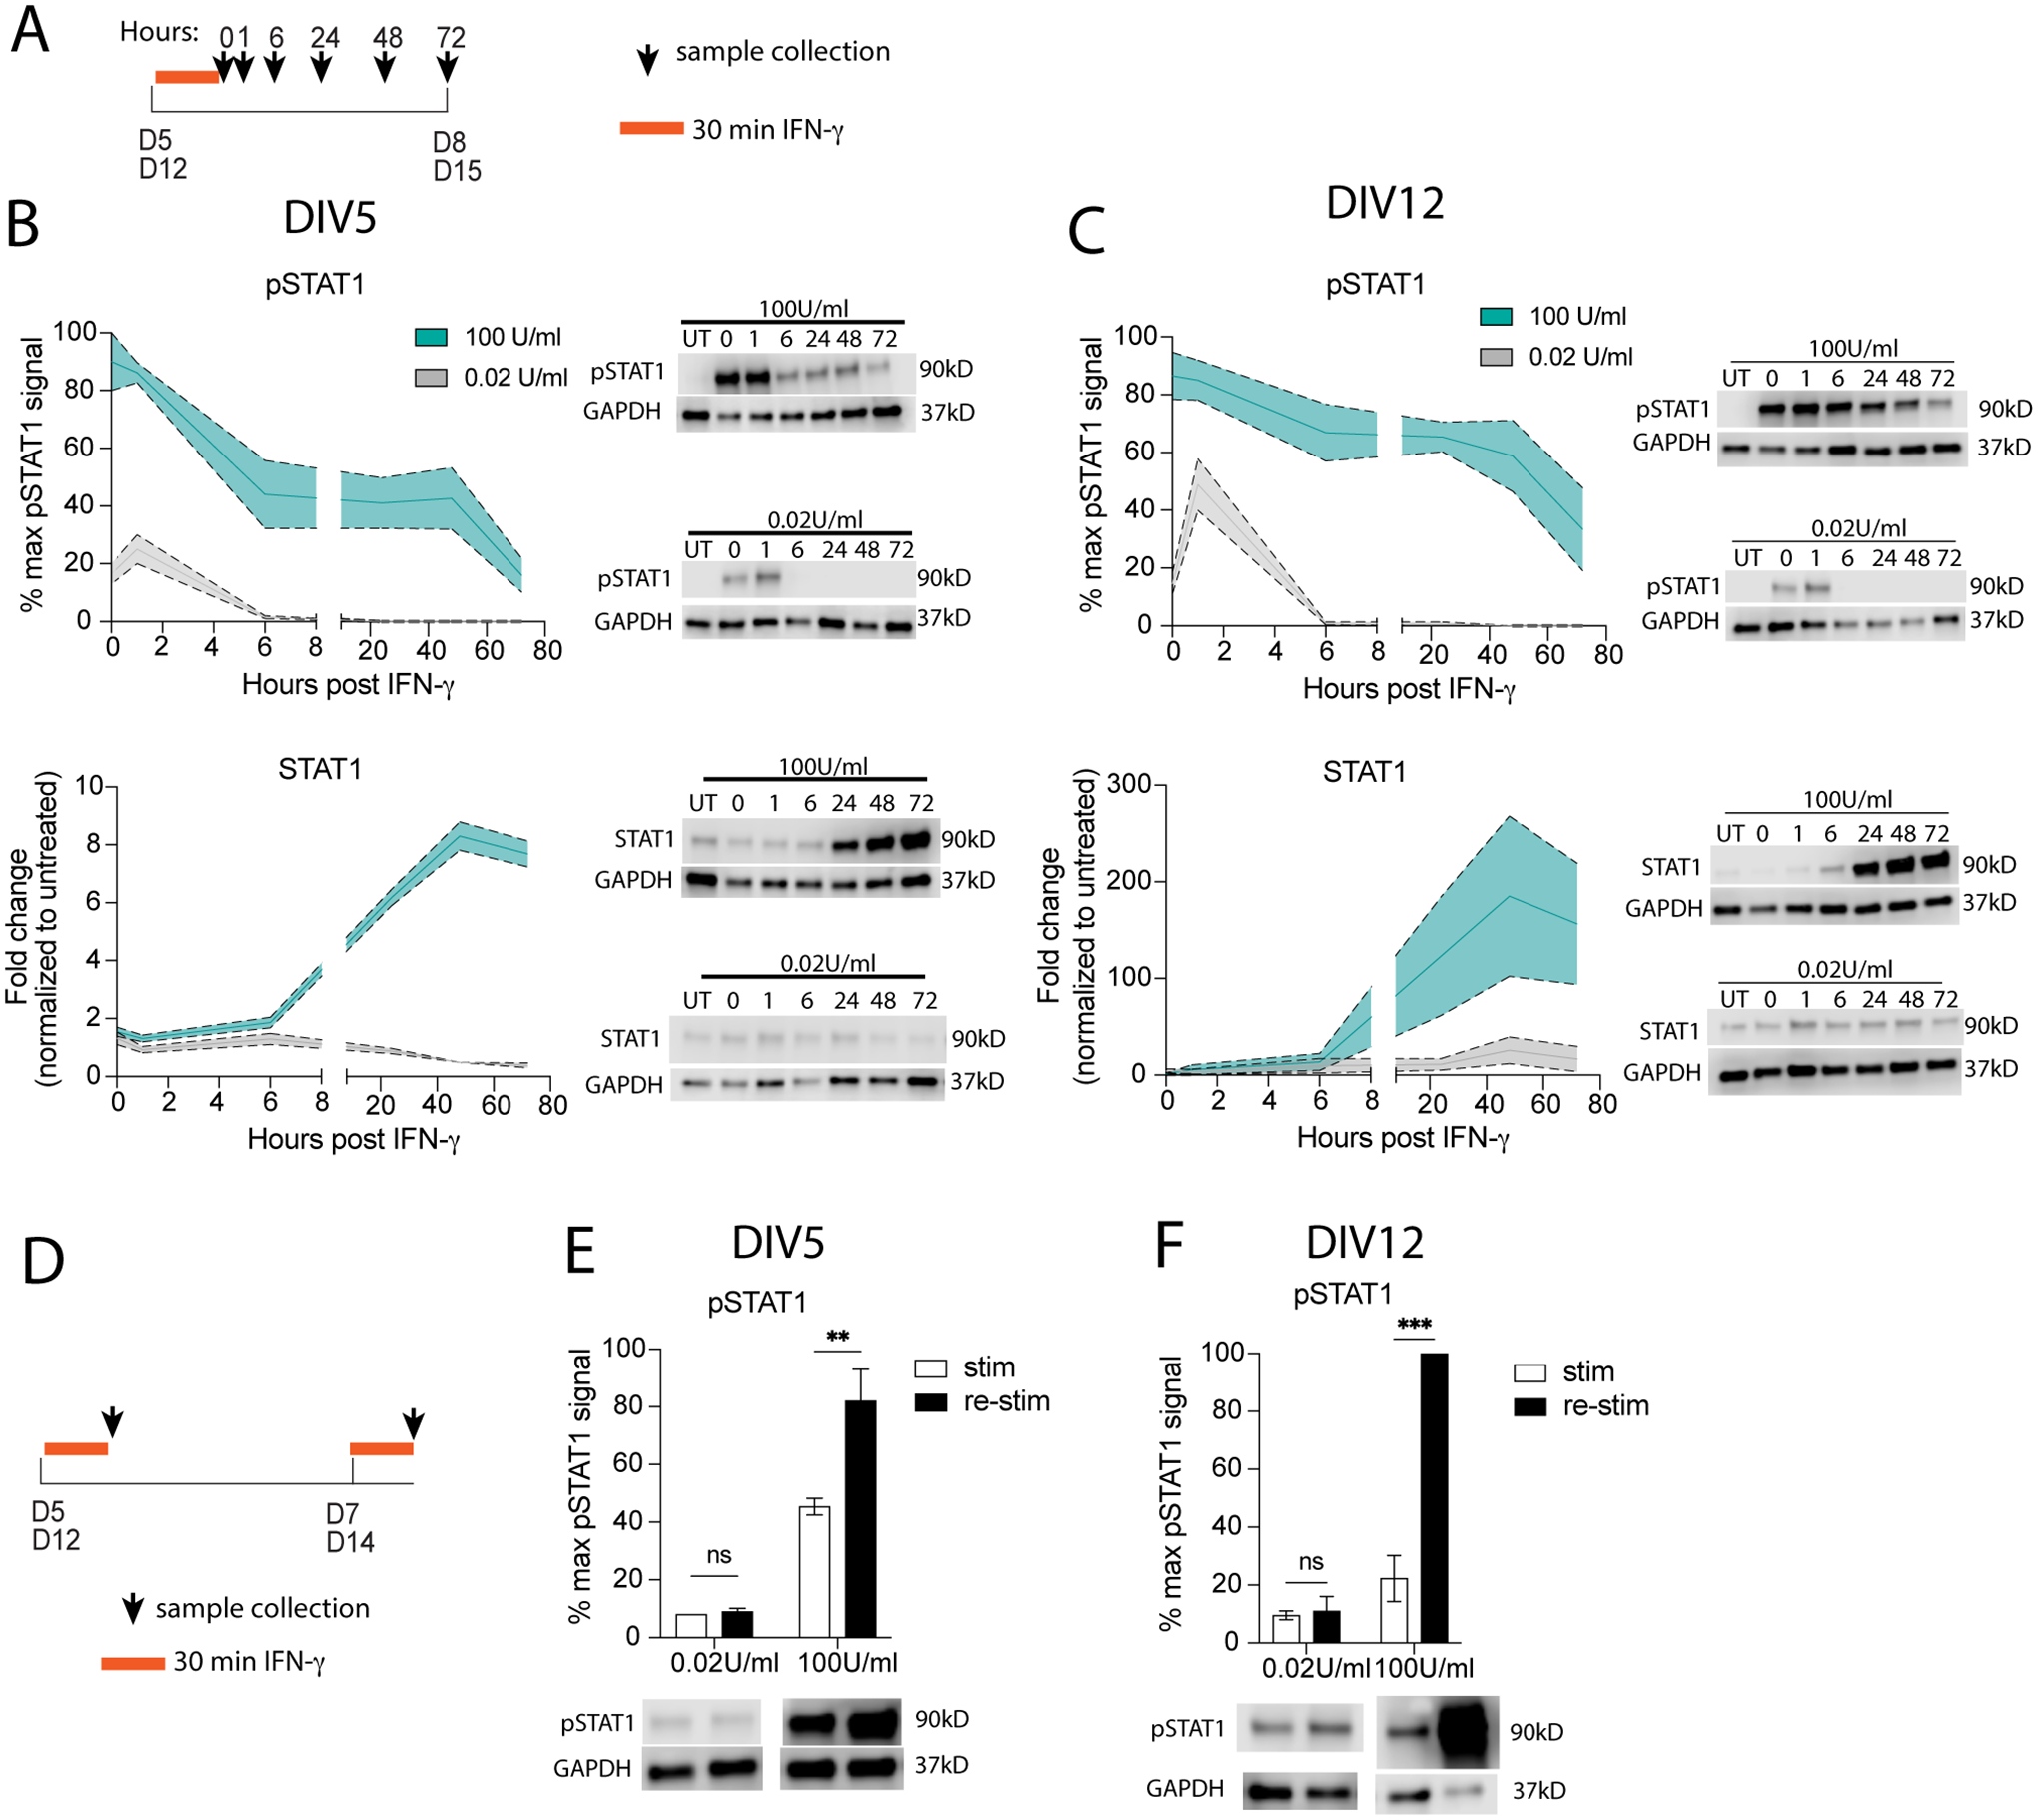
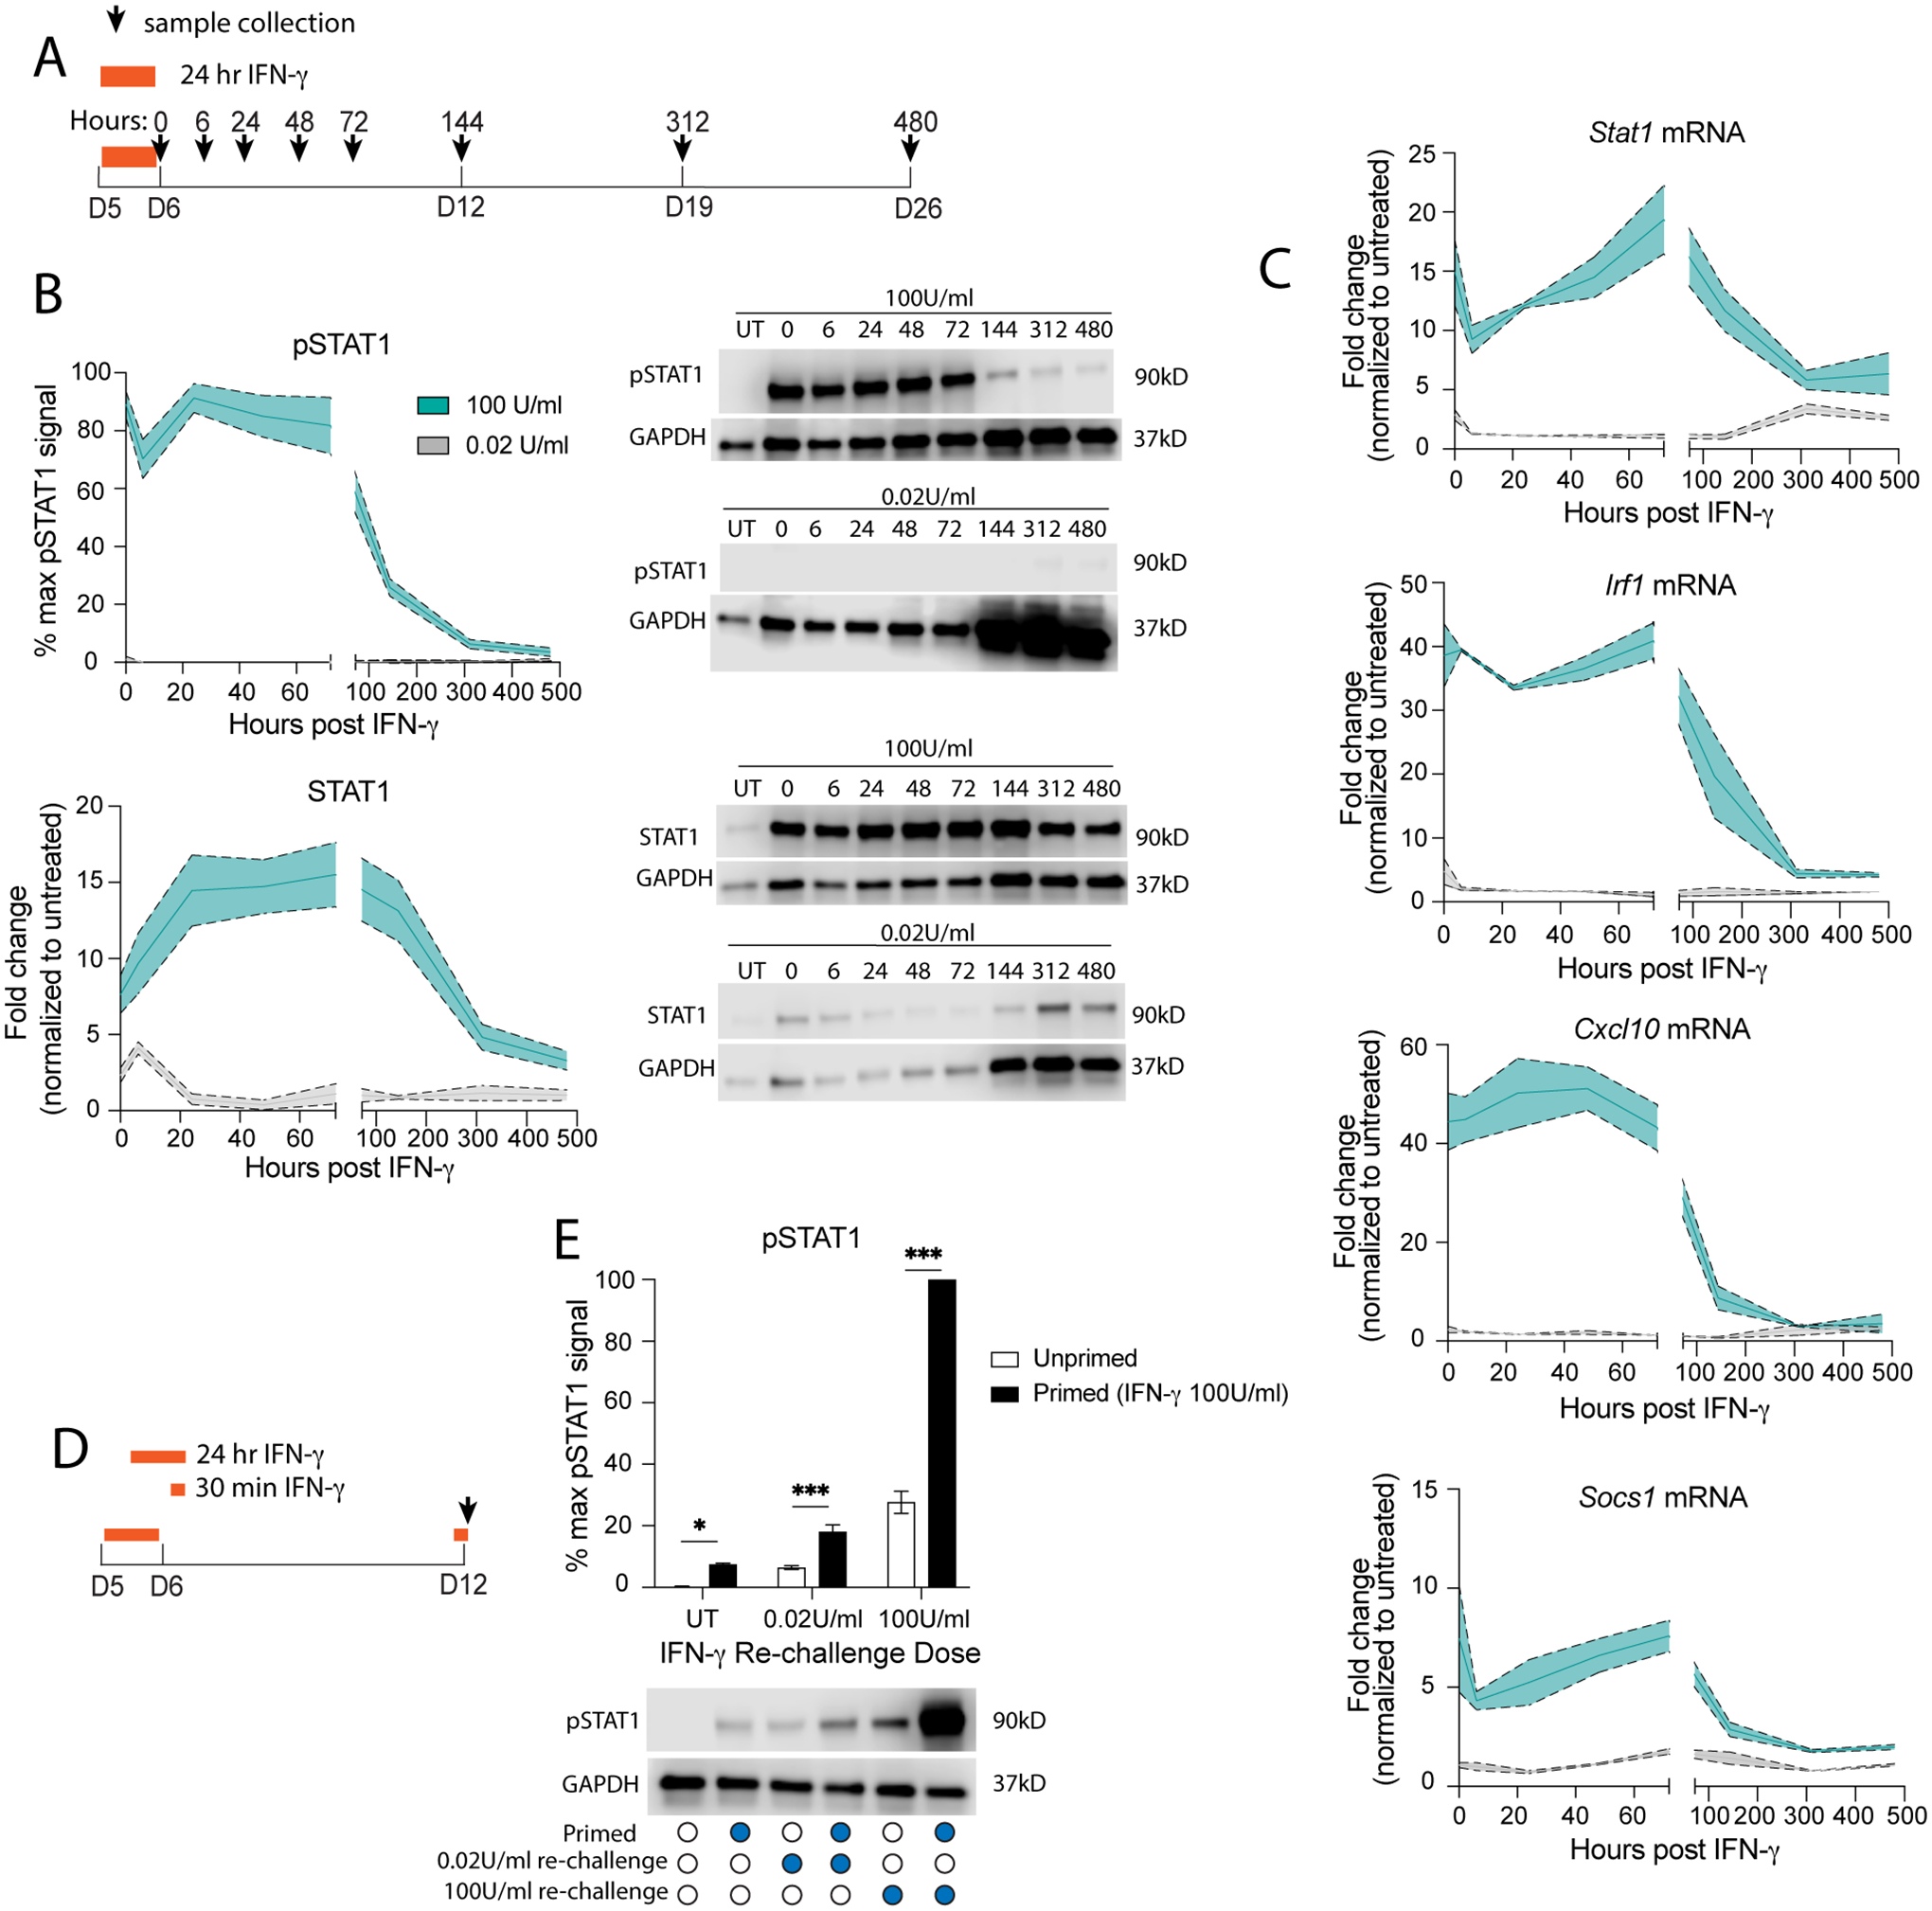
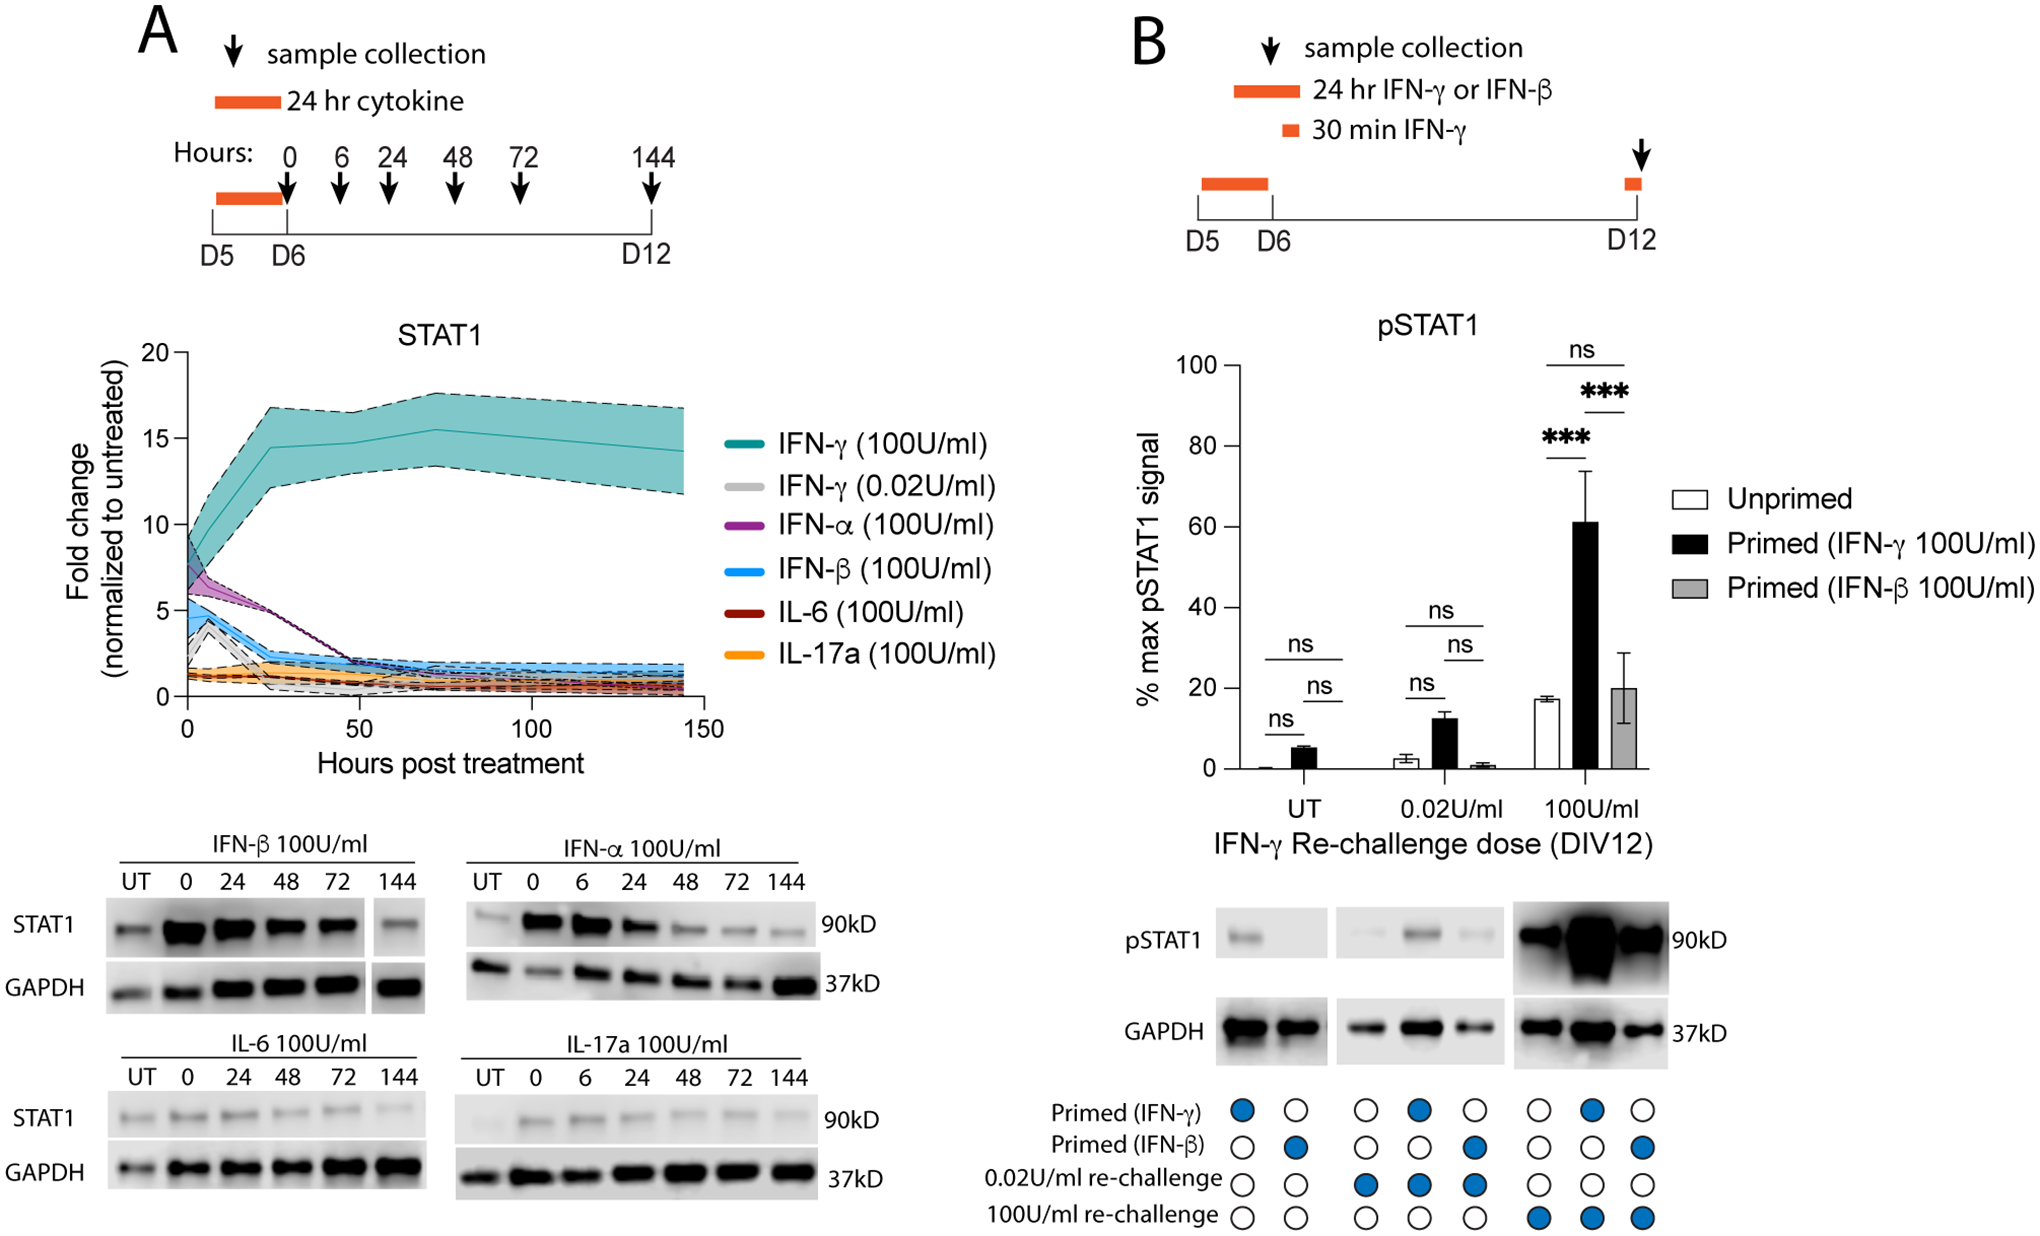
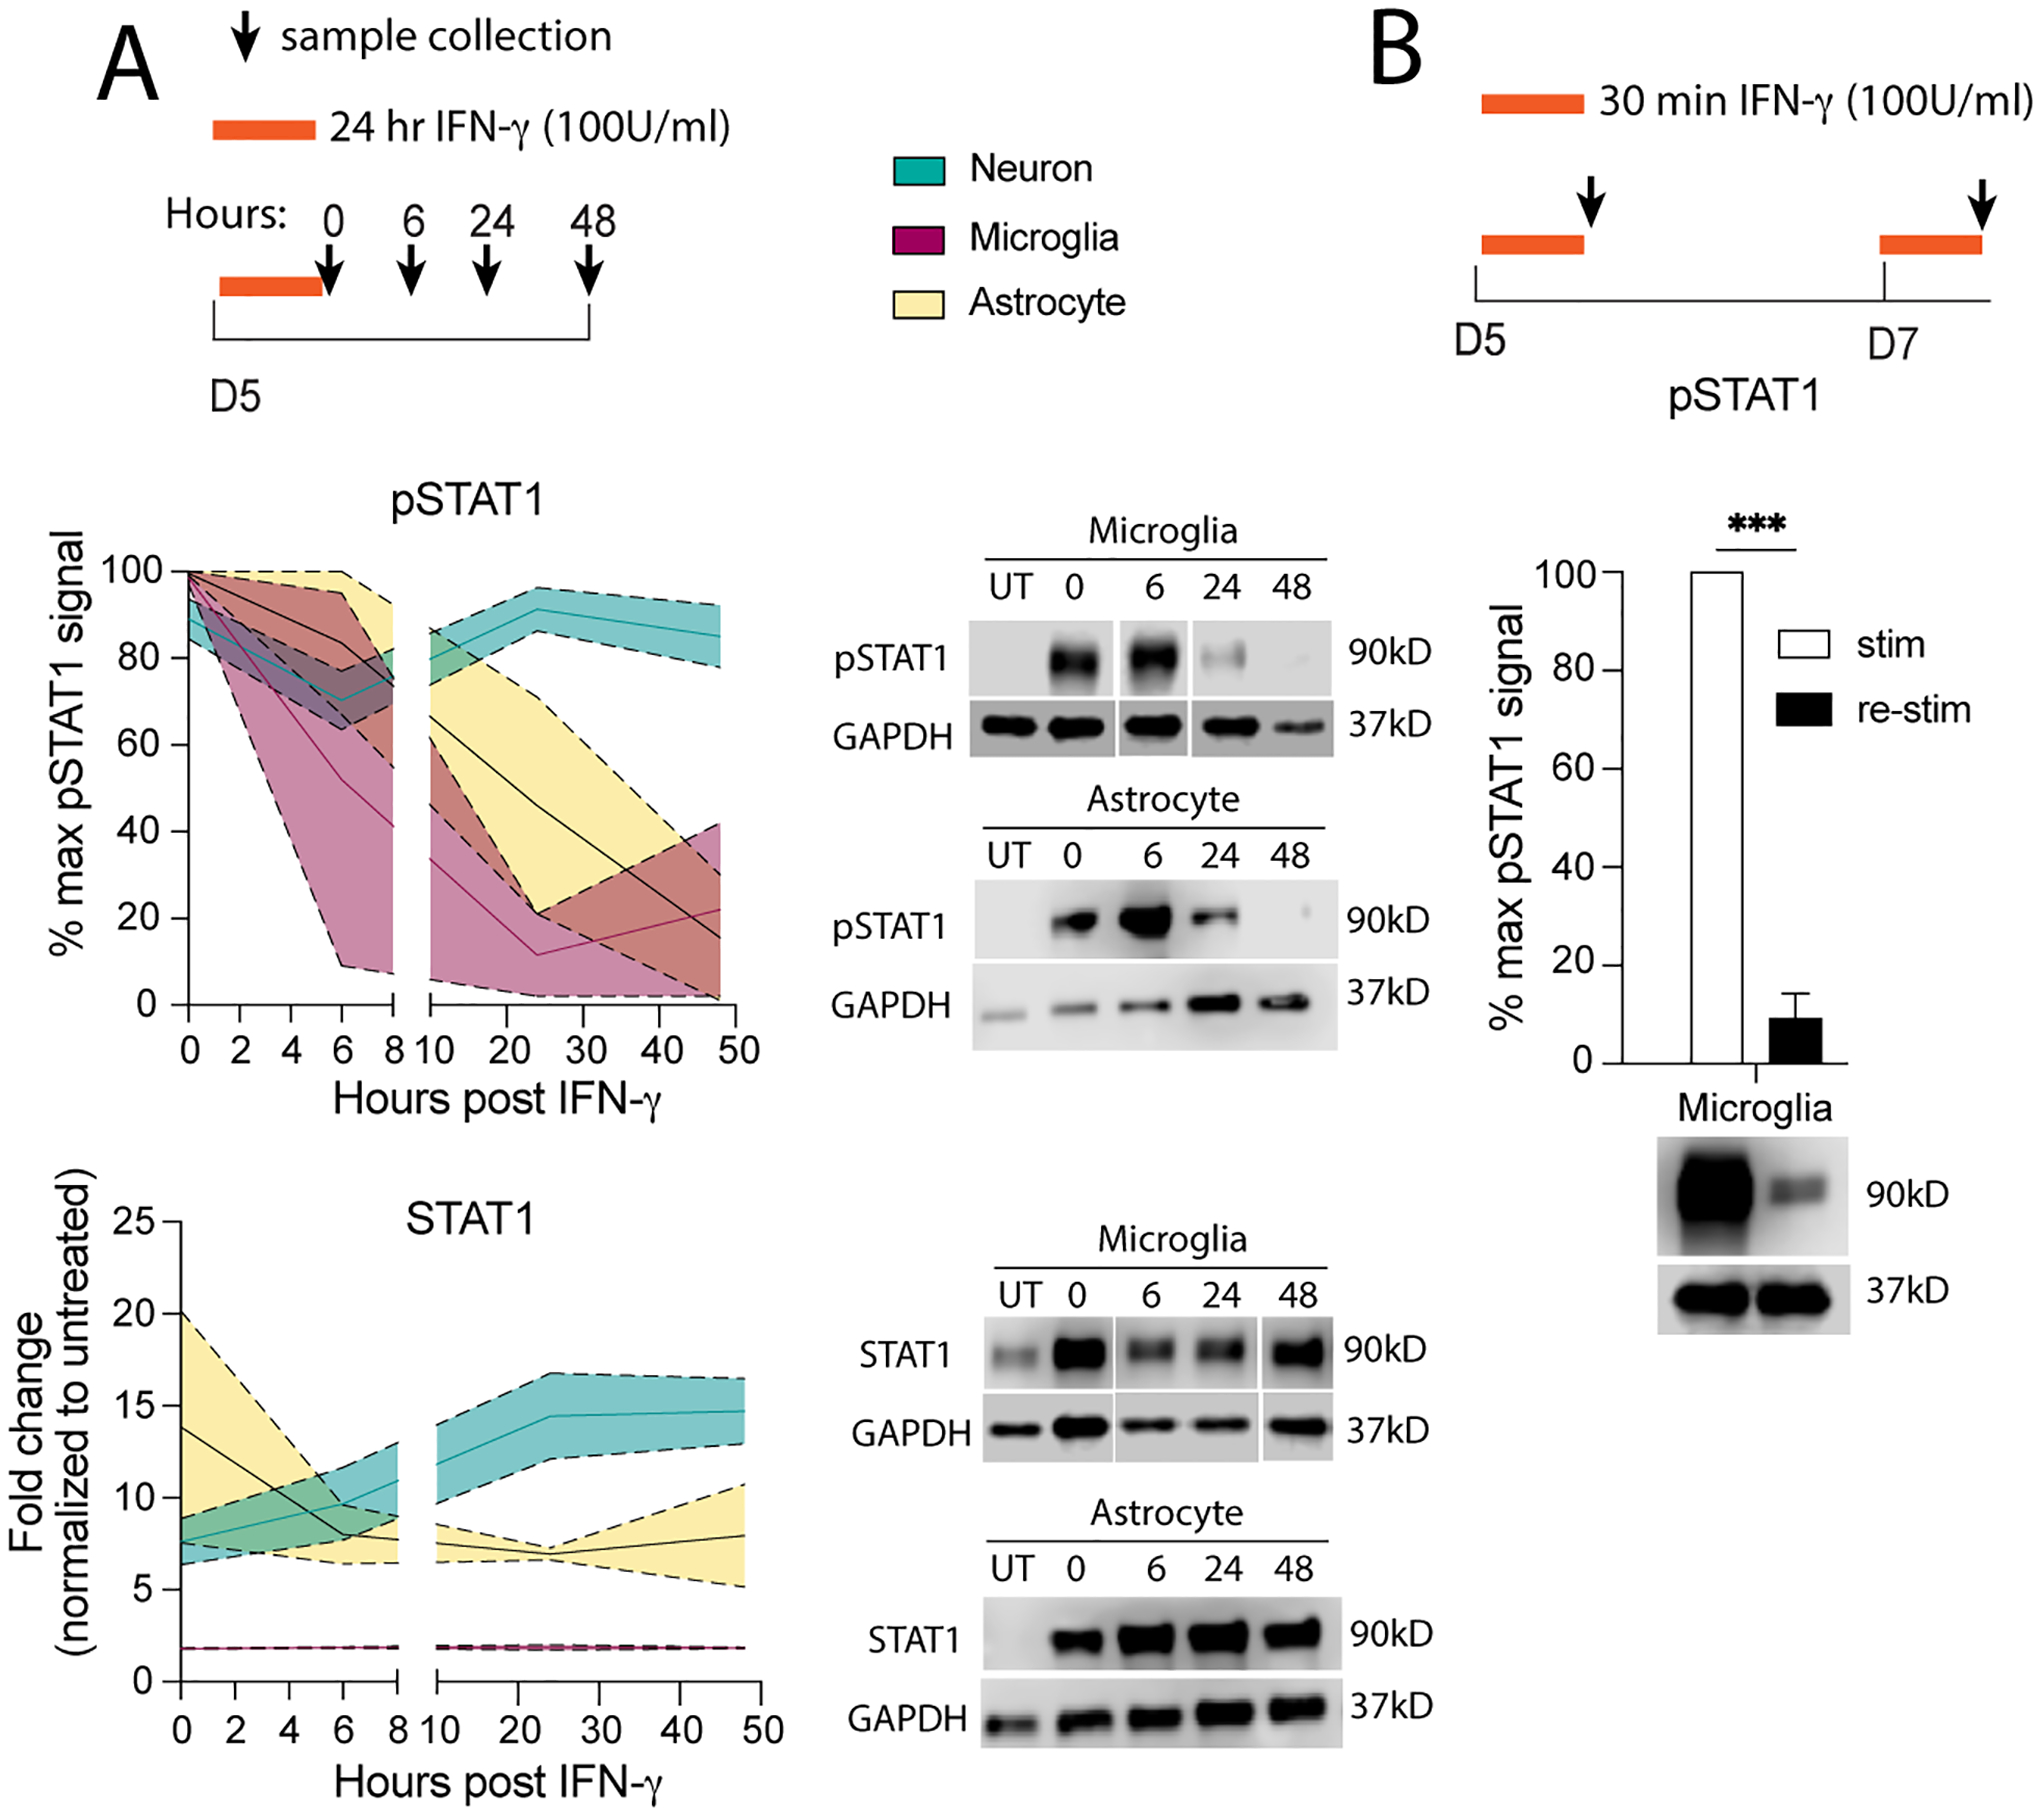
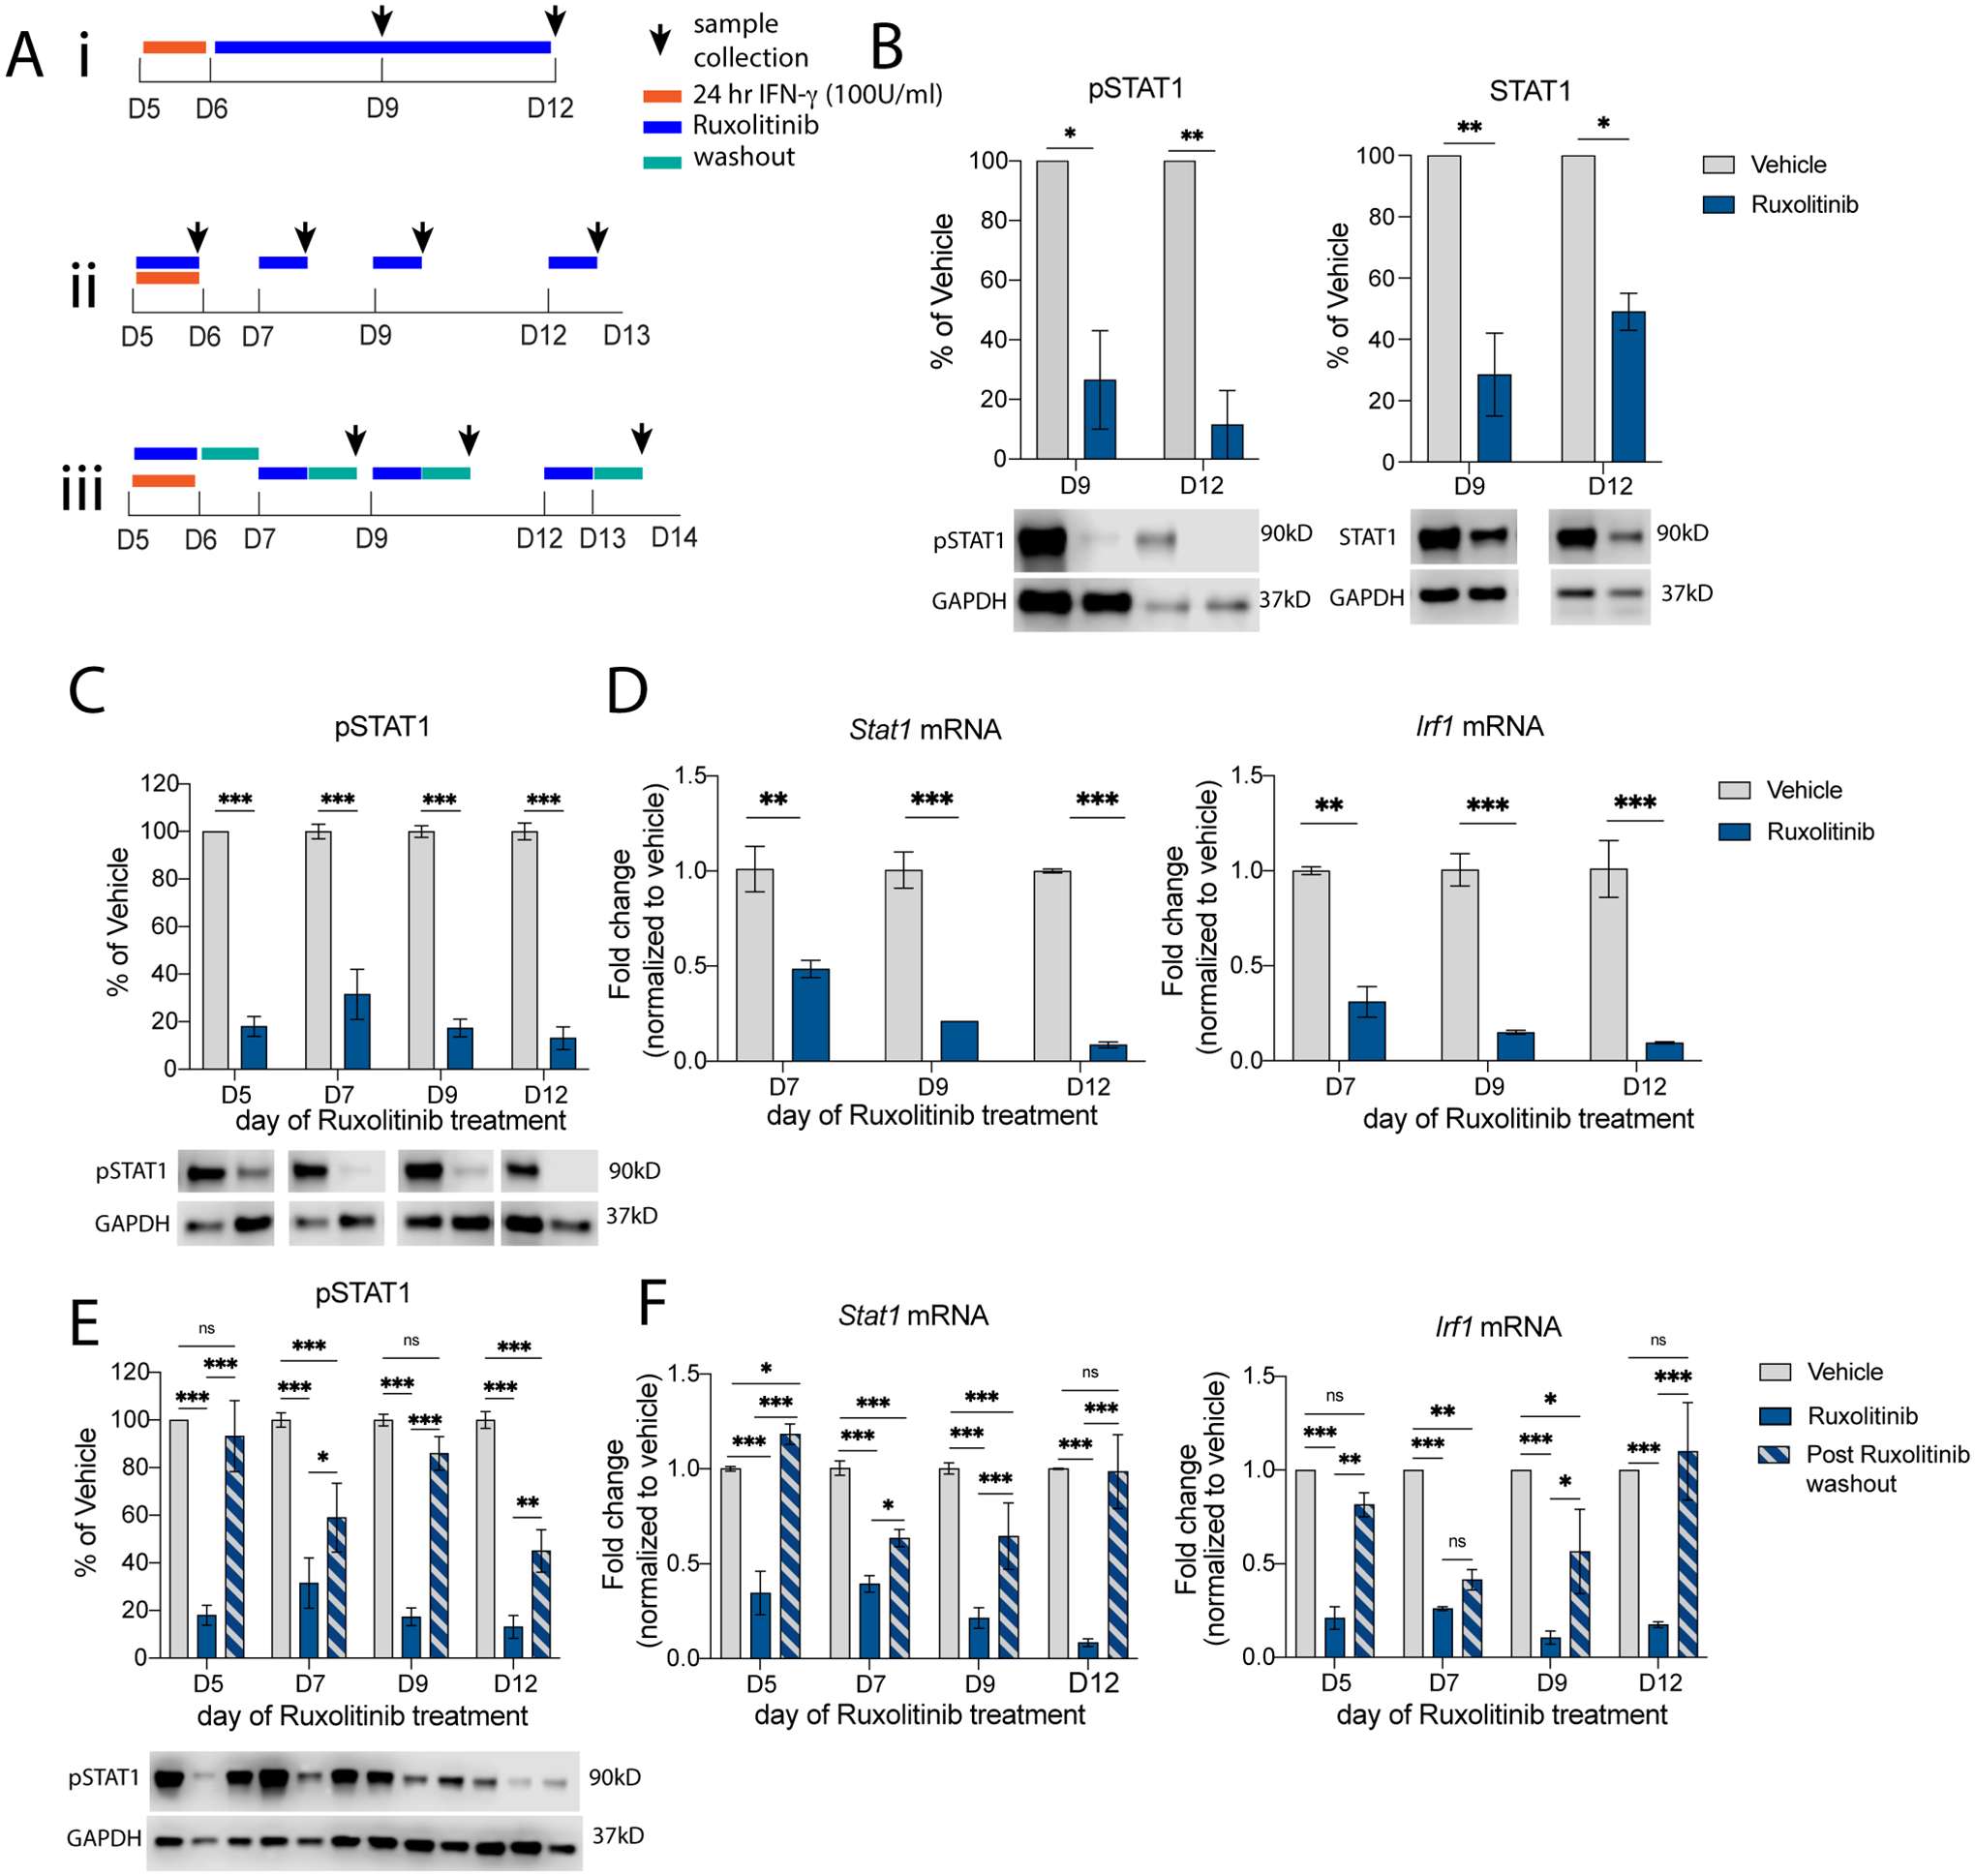
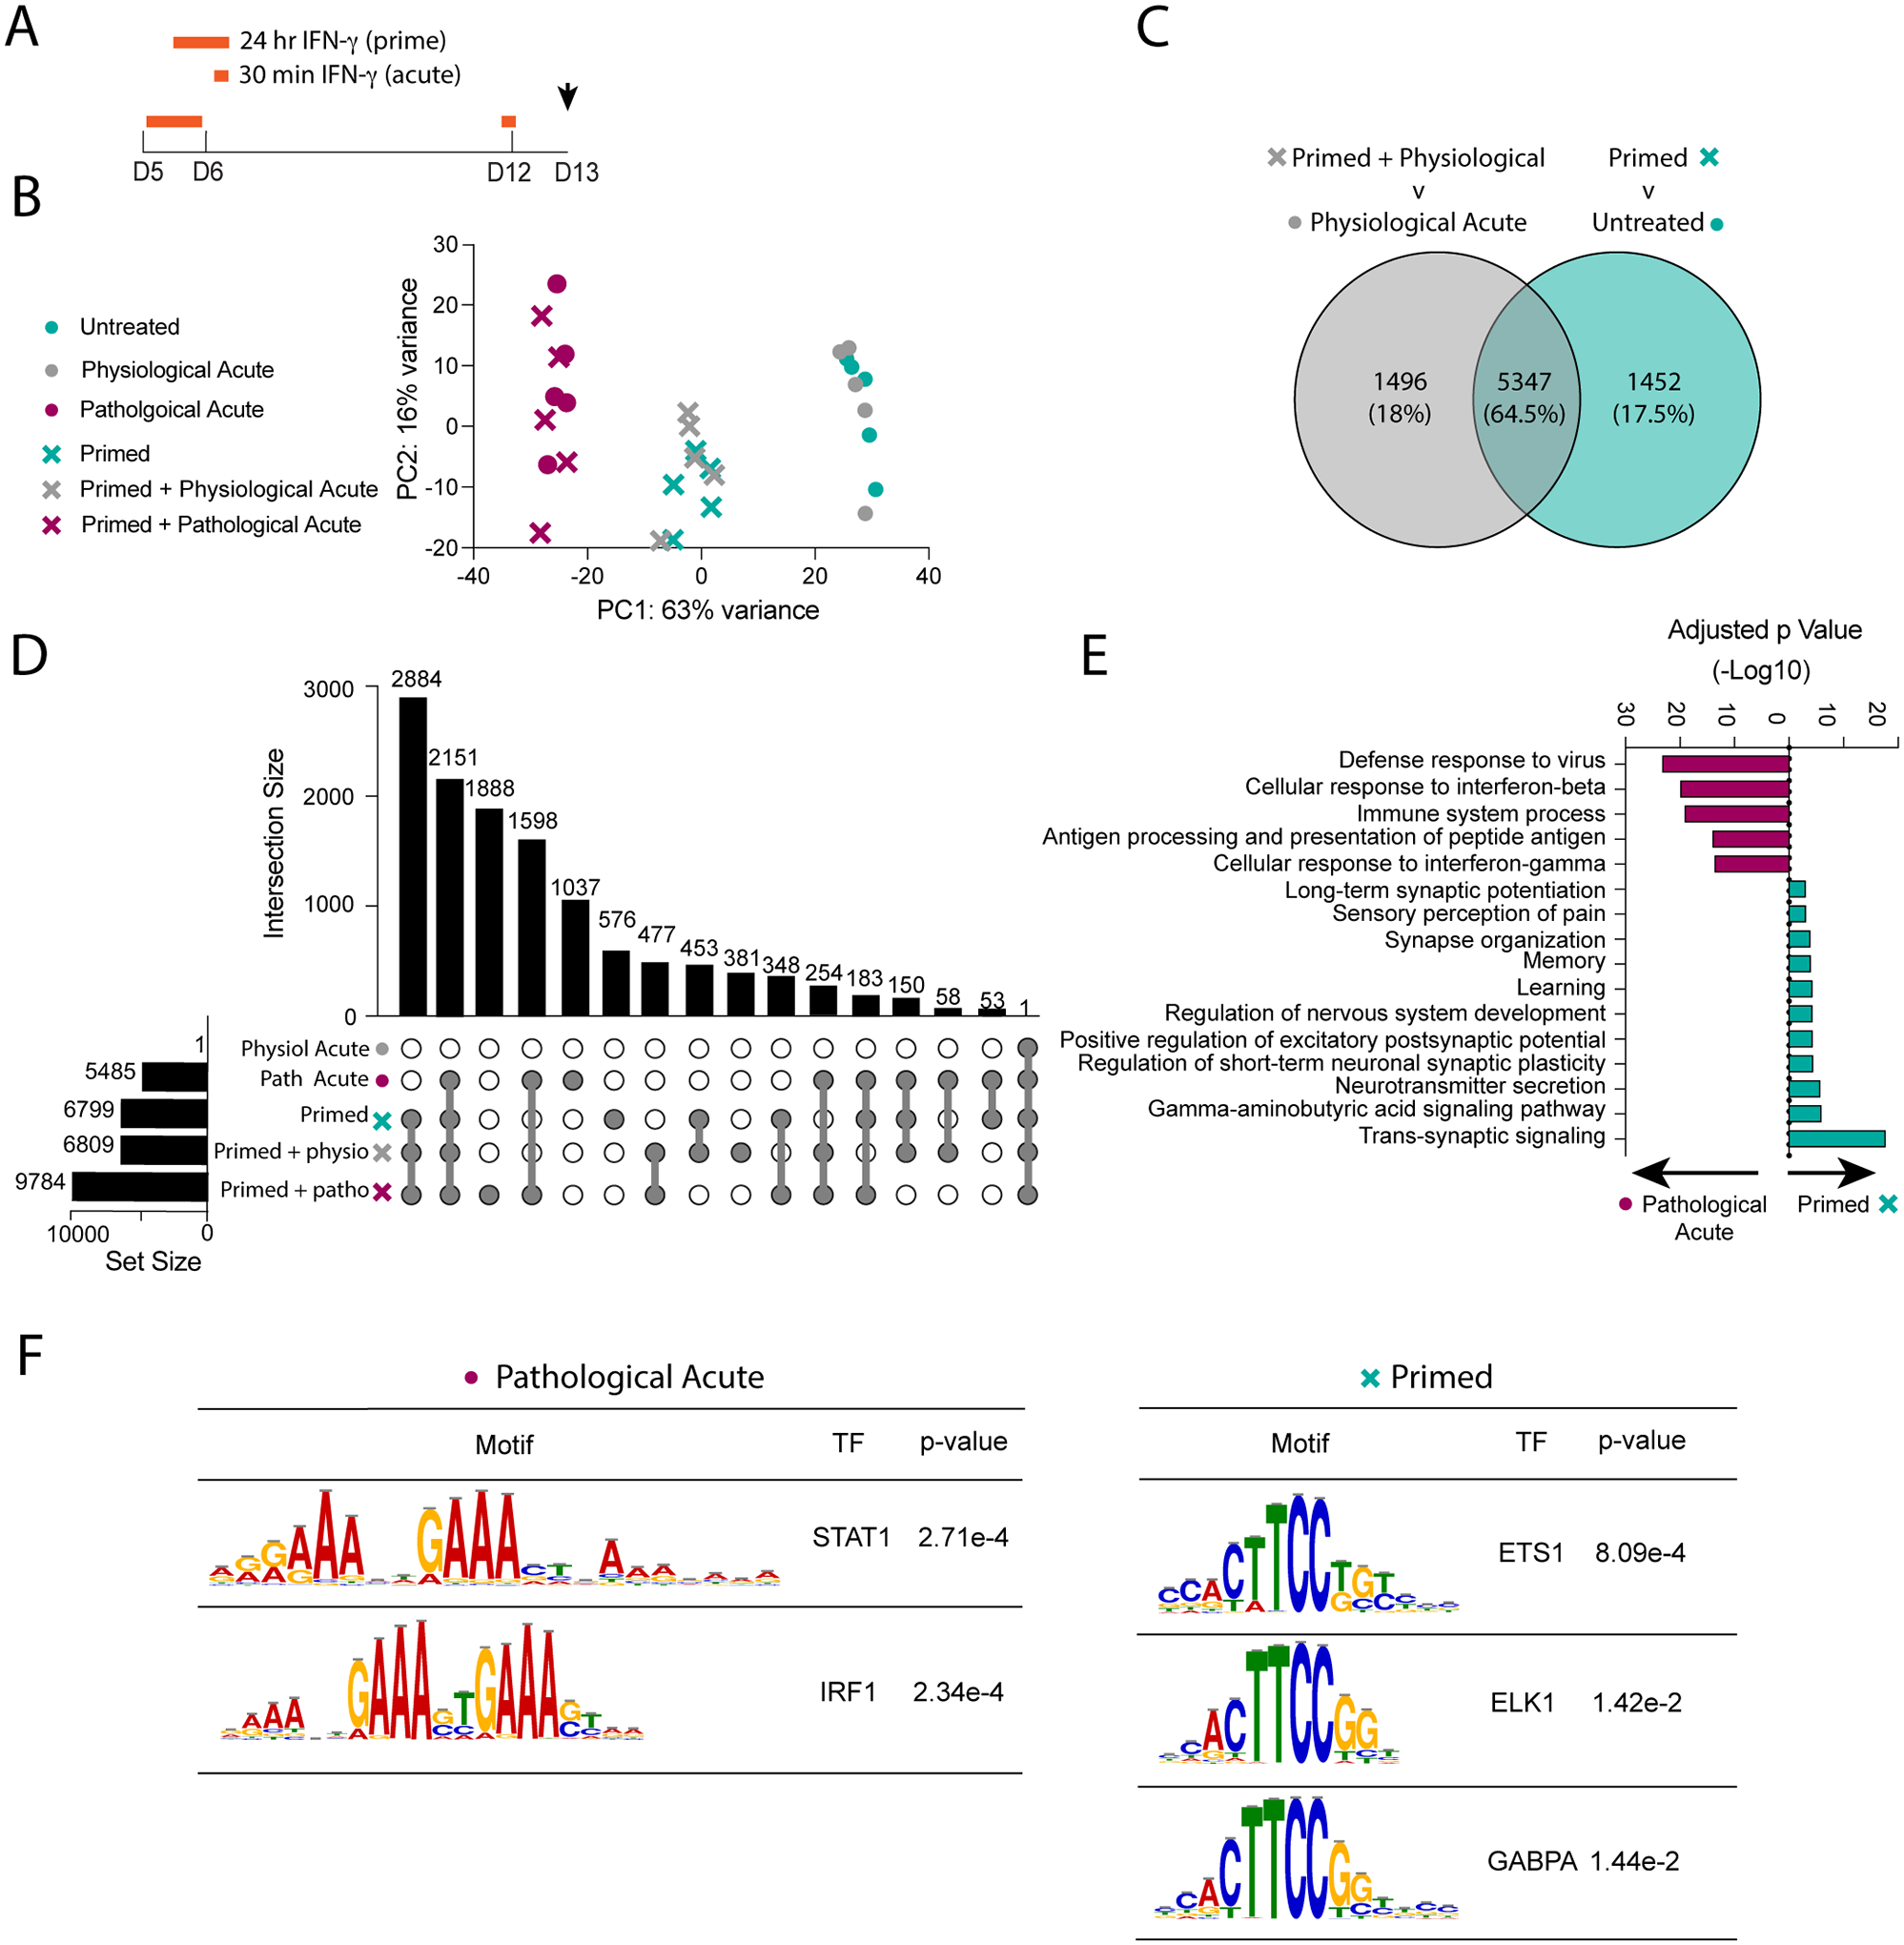
Neurons require physiological IFN-γ signaling to maintain central nervous system (CNS) homeostasis, however, pathological IFN-γ signaling can cause CNS pathologies. The downstream signaling mechanisms that cause these drastically different outcomes in neurons has not been well studied. We hypothesized that different levels of IFN-γ signaling in neurons results in differential activation of its downstream transcription factor, signal transducer and activator of transduction 1 (STAT1), causing varying outcomes. Using primary cortical neurons, we showed that physiological IFN-γ elicited brief and transient STAT1 activation, whereas pathological IFN-γ induced prolonged STAT1 activation, which primed the pathway to be more responsive to a subsequent IFN-γ challenge. This is an IFN-γ specific response, as other IFNs and cytokines did not elicit such STAT1 activation nor priming in neurons. Additionally, we did not see the same effect in microglia or astrocytes, suggesting this non-canonical IFN-γ/STAT1 signaling is unique to neurons. Prolonged STAT1 activation was facilitated by continuous janus kinase (JAK) activity, even in the absence of IFN-γ. Finally, although IFN-γ initially induced a canonical IFN-γ transcriptional response in neurons, pathological levels of IFN-γ caused long-term changes in synaptic pathway transcripts. Overall, these findings suggest that IFN-γ signaling occurs via non-canonical mechanisms in neurons, and differential STAT1 activation may explain how neurons have both homeostatic and pathological responses to IFN-γ signaling.

Keywords: Cytokine; Interferon-gamma; Neuroimmunology; Neuron; STAT1.


Conflict of interest statement

Declaration of Competing Interest AJF has intellectual property that has been licensed to Cryocell.

Figures

Fig 1.
Fig 1.. Neurons have prolonged STAT1 response to pathological IFN-γ compared to physiological IFN-γ.
(A) Primary mature neurons were treated on (B) DIV5 or (C) DIV12 with physiological (gray; 0.02 U/mL) or pathological levels (cyan; 100 U/mL) of IFN-γ for 30 minutes then washed out; pSTAT1 and STAT1 were measured by western blot. (D) Primary mature neurons were treated with physiological (gray; 0.02 U/mL) or pathological levels (cyan; 100 U/mL) of IFN-γ for 30 minutes on (E) DIV5 or (F) DIV12, then re-stimulated 48 hours later with physiological or pathological IFN-γ. pSTAT1 levels were measured by western blot. Male and female mice included. Dotted lines represent SEM. (B) Two-Way ANOVA, repeated measures: pSTAT1: main effect of time *p<0.05 and dose **p<0.005, N=2–5; STAT1: main effect of time ***p<0.0005 and dose ***p<0.0005, interaction ***p<0.0005; N=2–5). (C) Mixed Effects Analysis, repeated measures: pSTAT1: main effect of time ***p<0.0005 and dose ***p<0.0005, interaction *p<0.05, N=6; STAT1: main effect of time *p<0.05, dose p=0.06, interaction **p<0.005; N=6). (E) Two Way ANOVA: main effect of dose ***p<0.0005 and restim *p<0.05, interaction *p<0.05; post-hoc Sidak’s multiple comparison: 100U/ml **p<0.005; N=3–5. (F) Two Way ANOVA: main effect of dose ***p<0.0005 and restim ***p<0.0005, interaction ***p<0.0005; post-hoc Sidak’s multiple comparison: 100U/ml ***p<0.0005; N=2–4.
Fig 2.
Fig 2.. Pathological IFN-γ primes immature neurons to have a heightened STAT1 response in mature neurons.
(A) Primary neurons (DIV5) were treated with physiological (gray; 0.02 U/mL) or pathological levels (cyan; 100 U/mL) of IFN-γ for 24 hours then washed out; (B) pSTAT1 and STAT1 were measured by western blot. (C) mRNA was collected and Stat1, Irf1, Cxcl10, and Socs1 mRNA levels were measured by qRT-PCR. (D) Primary neurons were treated with pathological IFN-γ for 24 hours on DIV5, then rechallenged with physiological or pathological IFN-γ for 30 minutes on DIV12. (E) pSTAT1 levels were measured by western blot. Male and female mice included. Dotted lines represent SEM. (B) Mixed Effects Model, repeated measures: pSTAT1: main effect of time ***p<0.0005 and dose ***p<0.0005, interaction ***p<0.0005, N=2–8; STAT1: main effect of time *p<0.05 and dose ***p<0.0005, interaction ***p<0.0005; N=2–12. (C) Mixed Effects Model, repeated measures: Stat1: main effect of time ***p<0.0005 and dose **p<0.005, interaction ***p<0.0005, N=2–5; Irf1: main effect of time ***p<0.0005 and dose ***p<0.0005, interaction ***p<0.0005, N=2–4; Cxcl10: main effect of time ***p<0.0005 and dose ***p<0.0005, interaction ***p<0.0005, N=2–4; Socs1: main effect of time **p<0.005 and dose ***p<0.0005, interaction **p<0.005, N=2–4. (E) Two Way ANOVA: main effect of priming ***p<0.0005 and restim dose ***p<0.0005, interaction ***p<0.0005; post-hoc Sidak’s multiple comparison: *p<0.05, ***p<0.0005; N=5.
Fig 3.
Fig 3.. Other cytokines do not elicit a prolonged STAT1 response in neurons.
(A) Primary neurons were treated with IFN-α, IFN-β, IL-6, or IL-17a for 24 hours then washed out. Total STAT1 protein expression was quantified by western blot. We then compared these data with data from Fig 2B where neurons were treated with IFN-γ. (B) Primary neurons were treated with IFN-γ or IFN-β for 24 hours (primed) or not (unprimed) on DIV5, then re-challenged with IFN-γ for 30 minutes on DIV12. Male and female mice included. Dotted lines represent SEM. (A) Mixed Effects Model, repeated measures: main effect of cytokine ***p<0.0005, interaction (cytokine × time) ***p<0.0005, N=2–8. (B) Two Way ANOVA: main effect of priming ***p<0.0005 and restim dose ***p<0.0005, interaction ***p<0.0005; post-hoc Tukey’s multiple comparison: ***p<0.0005; N=3–10.
Fig 4.
Fig 4.. Prolonged STAT1 response is unique to neurons.
(A) Primary microglia or astrocytes were treated for 24 hours with 100 U/mL IFN-γ then washed out; pSTAT1 and STAT1 protein was measured by western blot. pSTAT1 and STAT1 protein levels from neurons treated in Fig 2B, were used to compare to pSTAT1 and STAT1 levels in microglia and astrocytes. (B) Microglia were treated with 100 U/mL IFN-γ for 30 minutes, then washed and 48 hours later restimulated with 100 U/mL IFN-γ for 30 minutes; pSTAT1 was measured by western blot and compared to pSTAT1 levels from neurons in Fig 1E. Male and female mice included. Dotted lines represent SEM. (A) Mixed Effects Model, repeated measures: pSTAT1: main effect of time **p<0.005, cell type ***p<0.0005, and interaction **p<0.005, N=2–12; STAT1: cell type p=0.06, interaction (time × cell type) *p<0.05, N=2–12. (B) Two Way ANOVA: main effect of restim **p<0.005, interaction (restim × cell type) ***p<0.0005; post-hoc Sidak’s multiple comparison: **p<0.005, ***p<0.0005 N=2–5.
Fig 5.
Fig 5.. Continuous JAK activity perpetuates prolonged STAT1 response in neurons.
(Ai) Primary neurons (DIV5) were treated for 24 hours with 100 U/mL IFN-γ, Ruxolitinib (1μM) was added on DIV6 and left in cultures until DIV12, with samples collected at DIV9 and DIV12. (B) pSTAT1 and STAT1 were measured by western blot. (Aii) Primary neurons (DIV5) were treated for 24 hours with 100 U/mL IFN-γ, Ruxolitinib (1μM) was added for 24 hours on DIV5, DIV7, DIV9, or DIV12, with samples collected after 24 hours of Ruxolitinib treatment. (C) pSTAT1 was measured by western blot; (D) Stat1 and Irf1 mRNA expression were measured by qRT-PCR. (Aiii) Primary neurons (DIV5) were treated for 24 hours with 100 U/mL IFN-γ, Ruxolitinib (1μM) was added for 24 hours on DIV5, DIV7, DIV9, or DIV12, then washed out and samples were collected 24 hours after Ruxolitinib washout. (E) pSTAT1 was measured by western blot; (F) Stat1 and Irf1 mRNA expression were measured by qRT-PCR. Male and female mice included. (B) Two Way ANOVA: pSTAT1: main effect of ruxo treatment **p<0.005; post-hoc Sidak’s *p<0.05, **p<0.005, N=2; STAT1: main effect of ruxo treatment **p<0.005; post-hoc Sidak’s *p<0.05, **p<0.005, N=2. (C) Two Way ANOVA: pSTAT1: main effect of ruxo treatment ***p<0.0005, post-hoc Sidak’s ***p<0.0005, N=7–8; (D) Two Way ANOVA: Stat1 mRNA: main effect of ruxo treatment ***p<0.0005, interaction p=0.06; post-hoc Sidak’s **p<0.005, ***p<0.0005, N=2; Irf1 mRNA: main effect of ruxo treatment ***p<0.0005; post-hoc Sidak’s **p<0.005, ***p<0.0005; N=2. (E) Two Way ANOVA: pSTAT1: main effect of ruxo treatment ***p<0.0005, day of treatment *p<0.05, interaction **p<0.005; post-hoc Sidak’s *p<0.05, **p<0.005, ***p<0.0005; N=4–8 (F) Two Way ANOVA: Stat1 mRNA: main effect of ruxo treatment ***p<0.0005, day of treatment ***p<0.0005, and interaction ***p=0.0005; post-hoc Tukey’s *p<0.05, ***p<0.0005, N=2–5; Irf1 mRNA: main effect of ruxo treatment ***p<0.0005, interaction *p<0.05; post-hoc Tukey’s *p<0.05, **p<0.005, ***p<0.0005; N=2.
Fig 6.
Fig 6.. Pathological priming with IFN-γ results in a distinct and lasting transcriptional response.
(A) Primary neurons were primed with pathological IFN-γ for 24 hours on DIV5 and then re-stimulated acutely with physiological or pathological IFN-γ for 30 minutes on DIV12. mRNA was collected on DIV13 for RNA-sequencing. (B) Principal Component Analysis of top two principal components comprising 79% of total variance. (C) Venn Diagram comparing the significant differentially expressed gene (DEG) sets (p<0.05) from the “primed + physio” versus “physiological acute” comparison and the “primed” v untreated comparison. (D) UpSet plot comparing the significant DEGs (p<0.05) identified from comparing each condition to untreated neurons. (E) Gene Ontology Analysis comparing significant differentially expressed genes (p<0.05) from the pathological acute versus primed conditions. (F) Motif analysis of the regions upstream of significant DEGs (p<0.05) from the pathological acute versus primed conditions.

References

    1. Alves de Lima K, Rustenhoven J, Da Mesquita S, Wall M, Salvador AF, Smirnov I, et al. Meningeal γδ T cells regulate anxiety-like behavior via IL-17a signaling in neurons. Nature Immunology. 2020;21:1421–9. - PMC - PubMed
    1. Bailey TL, Johnson J, Grant CE, Noble WS. The MEME Suite. Nucleic Acids Research. 2015;43:W39–W49. - PMC - PubMed
    1. Baruch K, Deczkowska A, David E, Castellano JM, Miller O, Kertser A, et al. Aging-induced type I interferon response at the choroid plexus negatively affects brain function. Science. 2014;346:89–93. - PMC - PubMed
    1. Ben-Yehuda H, Matcovitch-Natan O, Kertser A, Spinrad A, Prinz M, Amit I, et al. Maternal Type-I interferon signaling adversely affects the microglia and the behavior of the offspring accompanied by increased sensitivity to stress. Molecular Psychiatry. 2020;25:1050–67. - PMC - PubMed
    1. Benjamini Y, Hochberg Y. Controlling the False Discovery Rate: A Practical and Powerful Approach to Multiple Testing. Journal of the Royal Statistical Society: Series B (Methodological). 1995;57:289–300.

Publication types