. 2023 Aug 31;186(18):3903-3920.e21.
doi: 10.1016/j.cell.2023.07.016. Epub 2023 Aug 8.

A membrane-associated MHC-I inhibitory axis for cancer immune evasion

Affiliations

A membrane-associated MHC-I inhibitory axis for cancer immune evasion

Xufeng Chen et al. Cell. .

Abstract

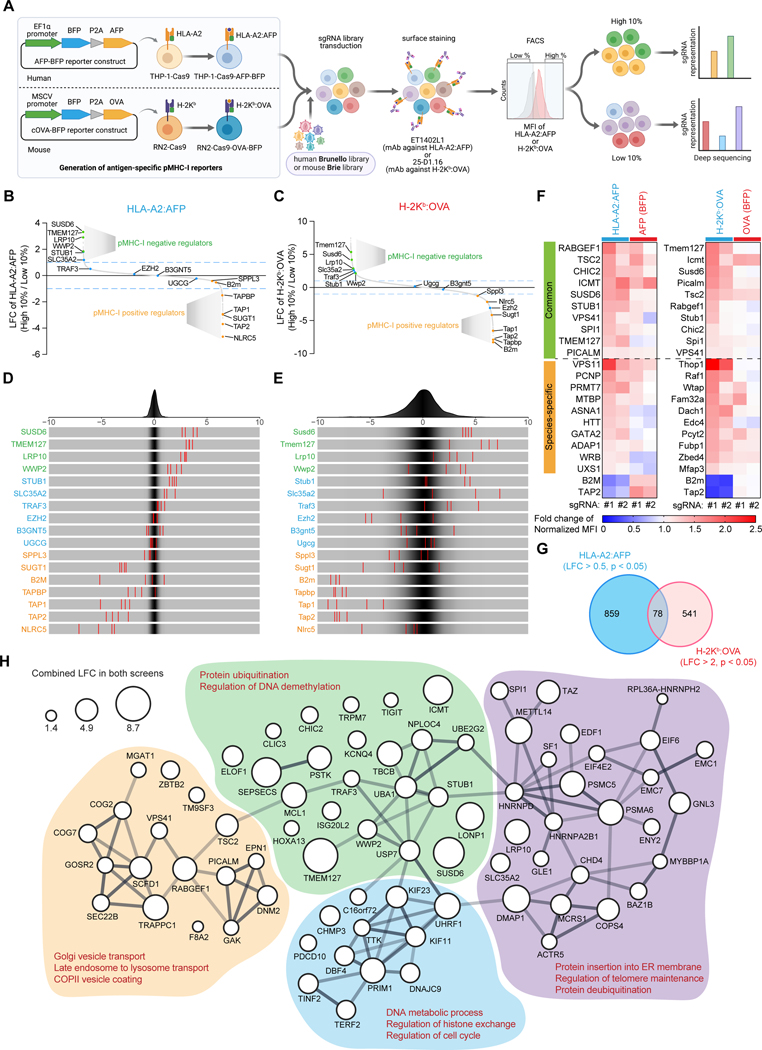
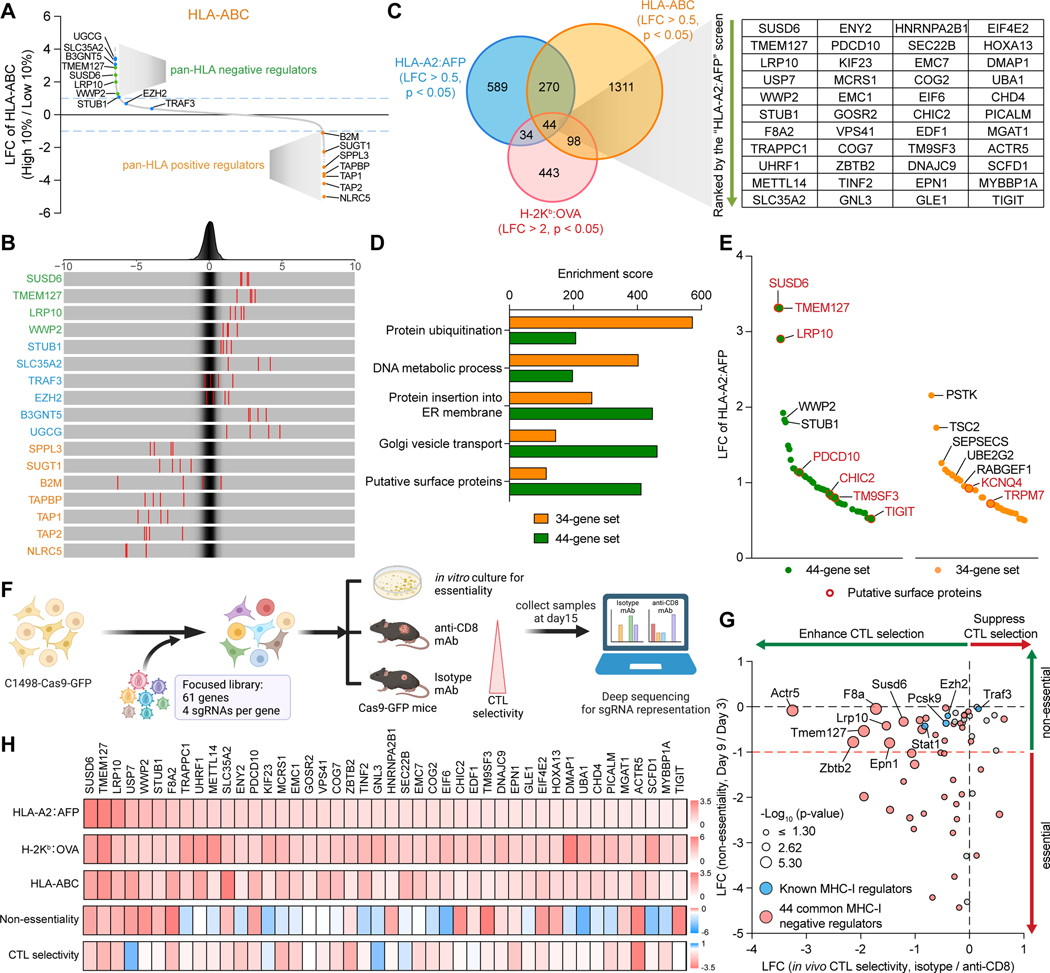
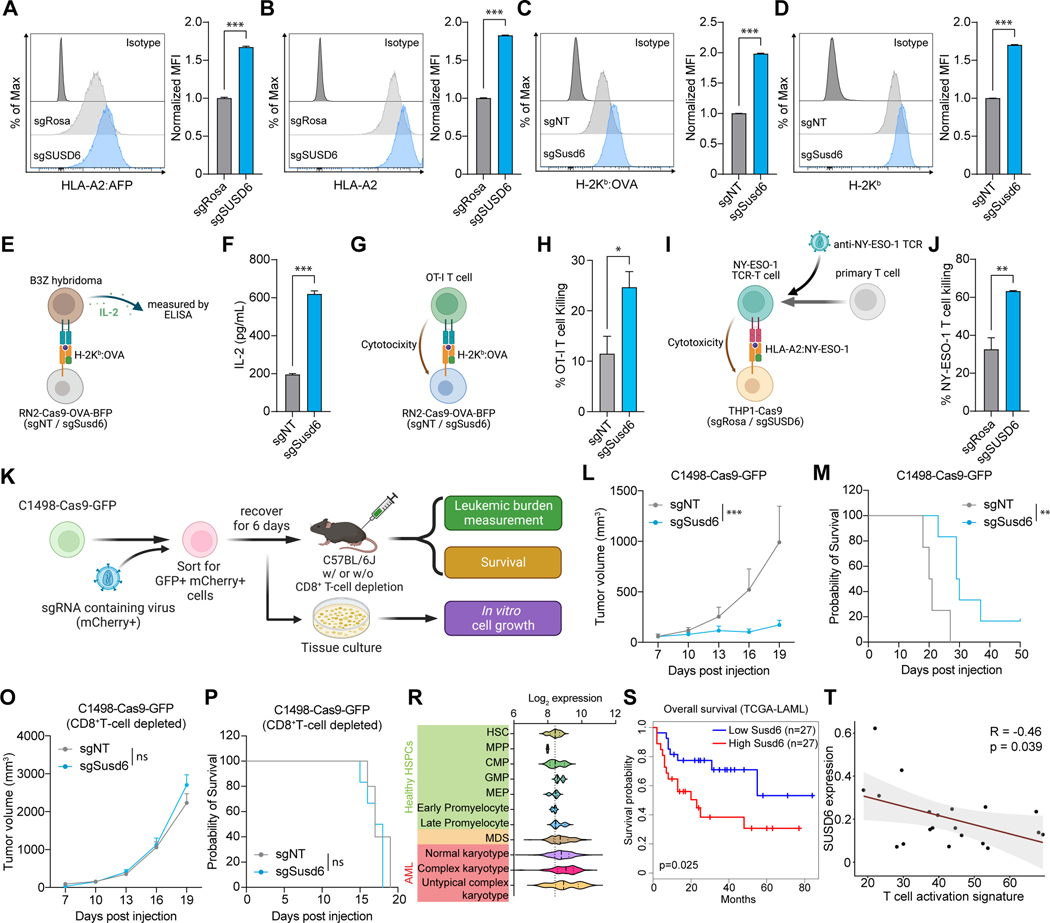
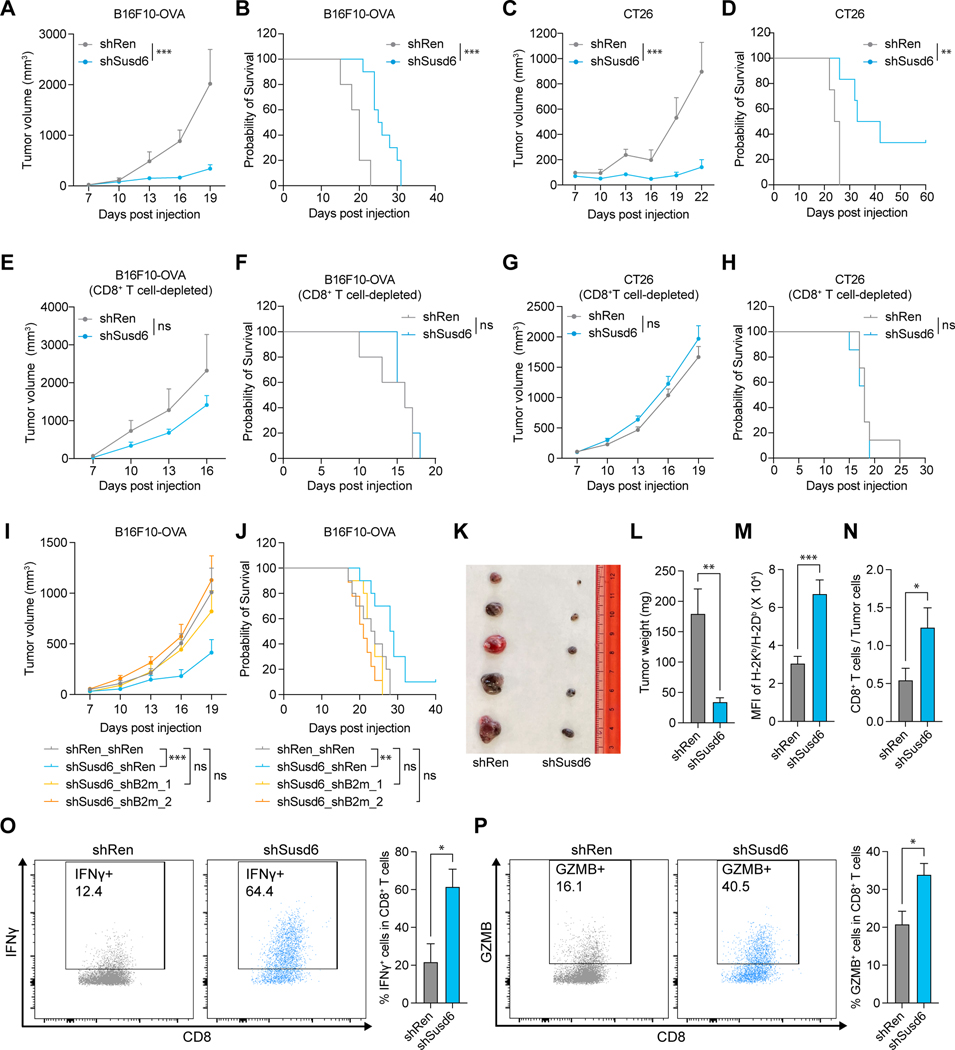
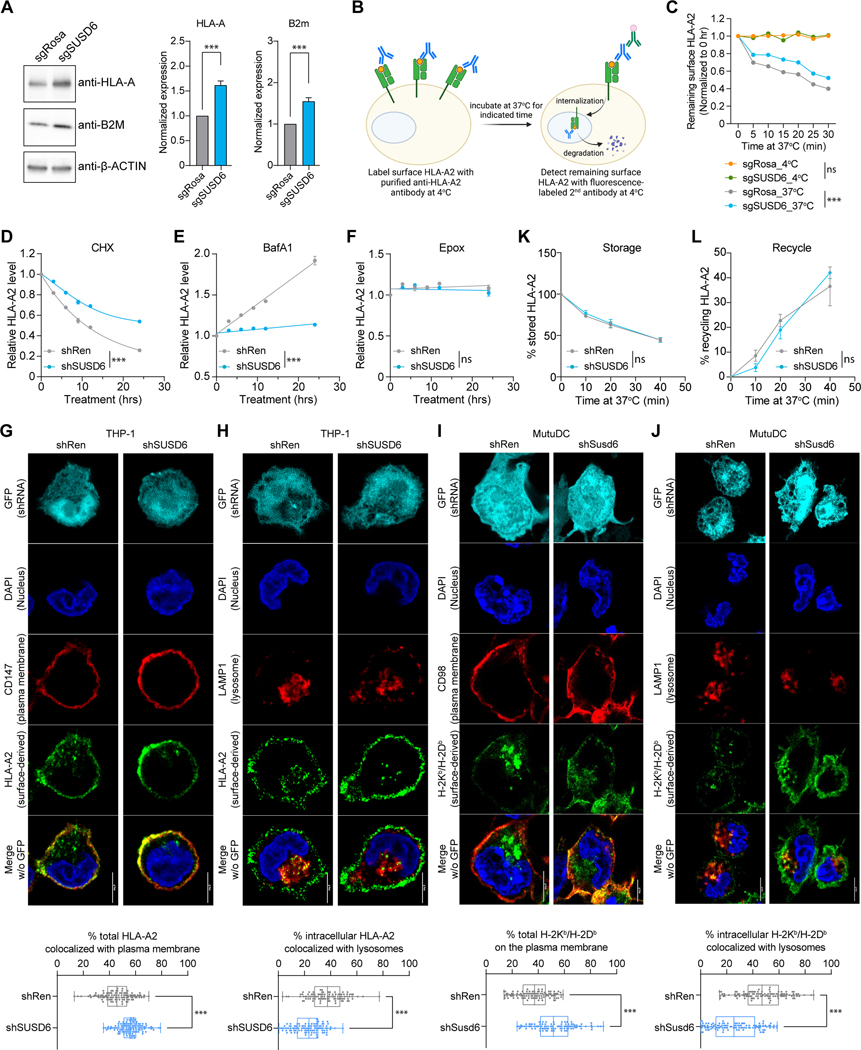
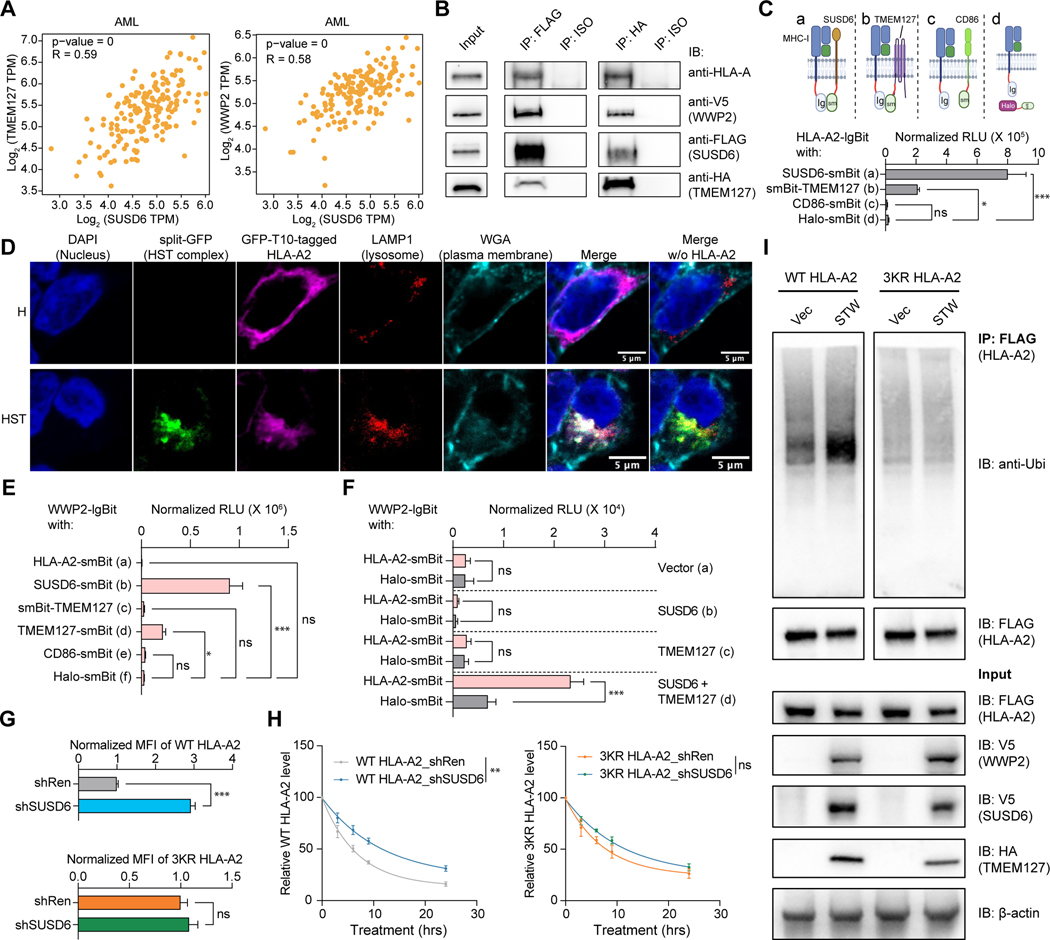
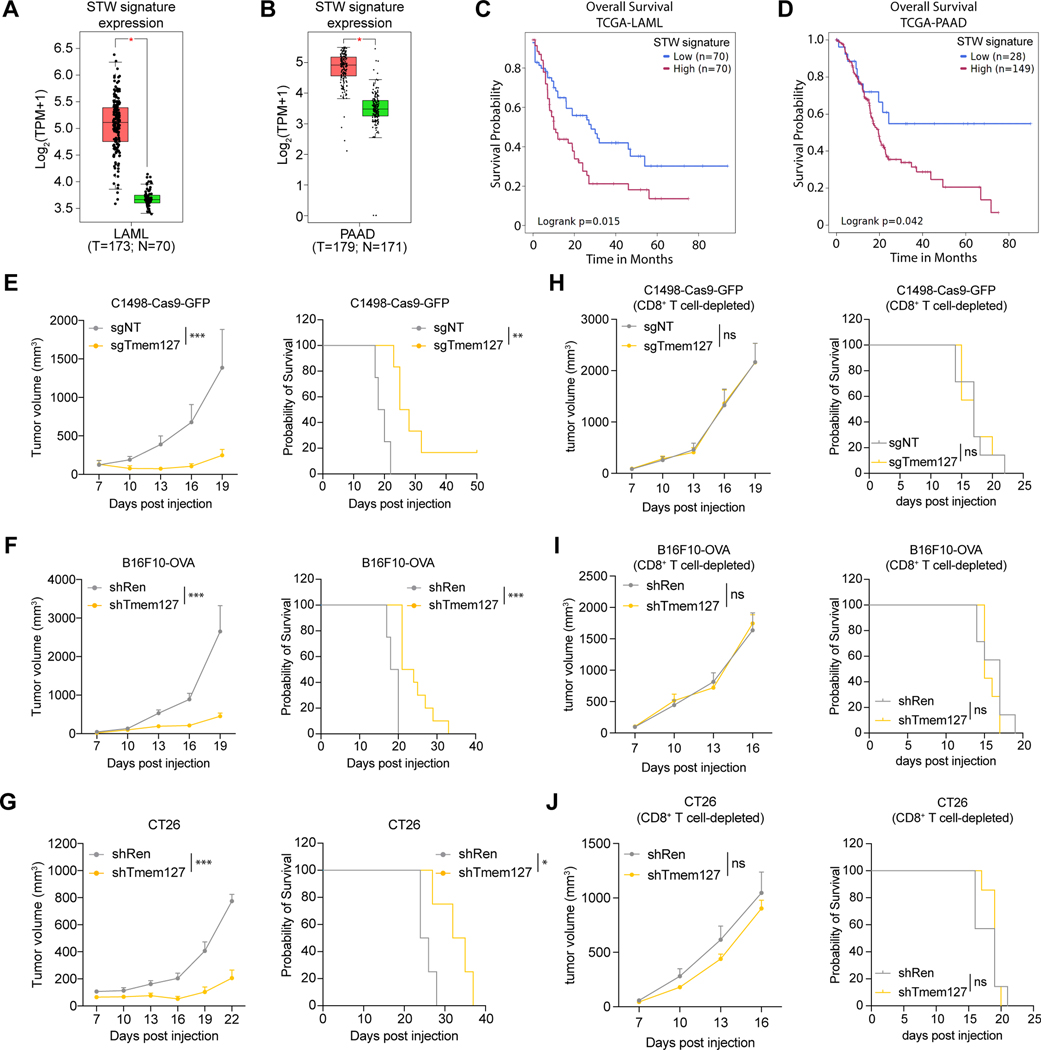
Immune-checkpoint blockade has revolutionized cancer treatment, but some cancers, such as acute myeloid leukemia (AML), do not respond or develop resistance. A potential mode of resistance is immune evasion of T cell immunity involving aberrant major histocompatibility complex class I (MHC-I) antigen presentation (AP). To map such mechanisms of resistance, we identified key MHC-I regulators using specific peptide-MHC-I-guided CRISPR-Cas9 screens in AML. The top-ranked negative regulators were surface protein sushi domain containing 6 (SUSD6), transmembrane protein 127 (TMEM127), and the E3 ubiquitin ligase WWP2. SUSD6 is abundantly expressed in AML and multiple solid cancers, and its ablation enhanced MHC-I AP and reduced tumor growth in a CD8+ T cell-dependent manner. Mechanistically, SUSD6 forms a trimolecular complex with TMEM127 and MHC-I, which recruits WWP2 for MHC-I ubiquitination and lysosomal degradation. Together with the SUSD6/TMEM127/WWP2 gene signature, which negatively correlates with cancer survival, our findings define a membrane-associated MHC-I inhibitory axis as a potential therapeutic target for both leukemia and solid cancers.

Keywords: MHC-I; SUSD6; T cell; TMEM127; WWP2; antigen presentation; cancer; immune evasion; lysosomal degradation; ubiquitination.


Conflict of interest statement

Declaration of interests J.W., I.A., X.C., and Q.L. are named inventors on a patent application related to this study. J.W. is on the Scientific Advisory Board of RootPath Inc. and is a consultant for Bristol Myers Squibb (Relatlimab Advisory Council). D.S. is currently an employee at Rubius Therapeutics.

Figures

Figure 1.
Figure 1.. Systematic identification of antigen-specific pMHC-I inhibitors in AML. See also Figure S1.
(A) Schematic of the antigen-specific pMHC-I CRISPR screens. (B-E) Waterfall plots (B and C) and frequency histograms (D and E) depicting the log2-fold changes (LFCs) of the selected regulators in the human (HLA-A2:AFP, B and D) and the mouse (H-2Kb:OVA, C and E) antigen-specific pMHC-I screens. Green: novel pMHC-I negative regulators, blue: published MHC-I negative regulators, orange: known pMHC-I positive regulators. (F) Heatmap showing the surface levels of HLA-A2:AFP or H-2Kb:OVA and the expression levels of AFP or OVA antigen (denoted by the BFP level) in human or mouse reporter cells transduced with sgRNAs targeting the selected candidates. The mean values from three biological replicates were used to plot the heatmap. (G) Venn diagram of the common negative AP regulators in the human HLA-A2:AFP screen and the mouse H-2Kb:OVA screen. (H) STRING protein-protein interaction (PPI) network of the 78 common pMHC-I negative regulators as defined in (G). The minimum required interaction score was set to 0.4. k-means clustering was applied. Bubble size denoted the combined LFCs in both screens and line thickness denoted the STRING PPI score/confidence.
Figure 2.
Figure 2.. Integration of pan-HLA and in vivo CRISPR screen identifies functional MHC-I inhibitors. See also Figure S2.
(A and B) Waterfall plot (A) and frequency histograms (B) depicting the LFCs of the selected regulators in the human pan-HLA (HLA-ABC) screen. Green: novel pan-HLA negative regulators, blue: published MHC-I negative regulators, orange: known pan-HLA positive regulators. (C) Venn diagram of the negative regulators in all three screens. (D) Enrichment analyses comparing the 44-gene set and the 34-gene set in different categories of biological functions defined in Figure 1H and putative surface expression. (E) Waterfall plot depicting the LFCs of the negative regulators from the 44-gene set and the 34-gene set in the HLA-A2:AFP screen. Putative surface proteins were highlighted in red. (F) Schematic of the in vivo focused screens in the C1498 murine AML cell line. (G) Scatter plots showing the non-essentiality of each candidate identified by in vitro cell growth (Y-axis) and the in vivo CTL selectivity of each targeted gene identified by comparison of tumors from Isotype versus anti-CD8 mAb-treated mice (X-axis). (H) Heatmaps showing the LFCs of the 44 common negative AP regulators in the indicated screens.
Figure 3.
Figure 3.. SUSD6 suppresses MHC-I expression and CD8+ T cell immunity in AML. See also Figure S3.
(A-D) Representative histograms (left) and bar plots (right) showing the surface levels of HLA-A2:AFP (A) or HLA-A2 (B) in human THP-1-Cas9-AFP-BFP cells, and the surface levels of H-2Kb:OVA (C) or H-2Kb (D) in mouse RN2-Cas9-OVA-BFP cells transduced with the indicated sgRNAs. (n=3) (E and F) Schematic of the T cell activation assay (E) and bar plot showing the IL-2 secreted by the B3Z T cell hybridoma incubated with sgRNA-transduced RN2-Cas9-OVA-BFP cells (F). (n=3) (G and H) Schematic of the mouse T cell killing assay (G) and bar plot showing the percentages of sgRNA-transduced RN2-Cas9-OVA-BFP cells killed by the OT-I T cells (H). (n=3) (I and J) Schematic of the human T cell killing assay (I) and bar plot showing the percentages of sgRNA-transduced NY-ESO-1-expressing THP-1-Cas9 cells killed by the NY-ESO-1 TCR-T cells (J). (n=3) (K) Schematic of the in vivo validations of SUSD6 functions in a mouse syngeneic AML model. (L-P) Quantification of the tumor volumes (L and O) and Kaplan-Meier survival curves (M and P) of immunocompetent (L and M) or CD8+ T cell-depleted (O and P) mice transplanted with sgRNA-transduced C1498-Cas9-GFP cells as described in (K). (for L and M: n=4 for sgNT and n=6 for sgSusd6; for O and P: n=5 for sgNT and n=6 for sgSusd6) (R) Violin plot of SUSD6 mRNA levels in normal HSPCs, MDS cells, and AML cells with different karyotypes from patient samples. HSPCs, hematopoietic stem and progenitor cells; HSC, hematopoietic stem cell; MPP, multipotent progenitor; CMP, common myeloid progenitor; GMP, granulocyte-monocyte progenitor; MEP, megakaryocyte-erythrocyte progenitor; MDS, myelodysplastic syndromes. Data were obtained from BloodSpot. (S) Survival of AML patients with high or low expression of SUSD6 in the TCGA-LAML cohort. (T) Pearson correlation of SUSD6 expression levels in AML cells and T cell activation signature in CD8+ T cells from the bone marrow immuno-microenvironments from AML patients. Data were generated by single-cell RNA-seq. Data are presented as the mean ± SEM. ns, not significant; *, p< 0.05; **, p< 0.01; and ***, p< 0.001 by two-tailed unpaired Student’s t-test (A-D, F, H, and J), two-way ANOVA for the last time point (L and O), or Log-rank Mantel-Cox test (M and P). Rosa26-targeting sgRNA (sgRosa, for human) and non-targeting sgRNA (sgNT, for mouse) were used as controls.
Figure 4.
Figure 4.. SUSD6 suppresses MHC-I expression and T cell evasion in solid tumor models. See also Figure S4.
(A-J) Quantification of the tumor volumes (A, C, E, G, I) and Kaplan-Meier survival curves (B, D, F, H, J) of immunocompetent (A-D, I and J) or CD8+ T cell-depleted (E-H) mice transplanted with B16F10-OVA (A, B, E, F, I, J) or CT26 (C, D, G, H) cells transduced with the indicated shRNAs as described in Figure S4D. (for A and B: n=5 for shRen, n=10 for shSusd6; for C and D: n=4 for shRen, n=6 for shSusd6; for E and F: n=5; for G and H: n=7; for I and J: n=10 for shRen_shRen, shSusd6_shRen and shSusd6_shB2m_1, n=9 for shSusd6_shB2m_2) (K-P) shRNA-transduced B16F10-OVA tumors were transplanted and harvested for analyses on day 15. (K) Representative image of the B16F10-OVA tumors. (L) Weights of the B16F10-OVA tumors. (n=9) (M) Surface expression of H-2Kb/H-2Db in B16F10-OVA tumors. (n=9) (N) Quantification of tumor-infiltrating CD8+ T cells. (n=9) (O and P) Representative dot plots (left) and quantifications (right) of the proportions of IFN-γ (O) and Granzyme B (P) expressing tumor-infiltrating CD8+ T cells. (n=8) Data are presented as the mean ± SEM. ns, not significant; *, p< 0.05; **, p< 0.01; and ***, p< 0.001 by two-way ANOVA for the last time point (A, C, E, G and I), Log-rank Mantel-Cox test (B, D, F, H and J), or two-tailed unpaired Student’s t-test (L-P). Renilla-targeting shRNA (shRen) was used as a control.
Figure 5.
Figure 5.. SUSD6 targets MHC-I for lysosomal degradation. See also Figure S5.
(A) Representative western blots (left) and normalized band intensities (right) of HLA-A and B2m in sgRNA-transduced THP-1 cells. (n=5). (B) Schematic of the surface HLA-A2 internalization assay in sgRNA-transduced THP-1 cells. (C) Quantifications of the surface-remaining HLA-A2. (n=3) (D-F) Time course studies of the surface HLA-A2 expression on shRNA-transduced THP-1 cells treated with Cycloheximide (CHX, D), Bafilomycin A1 (BafA1, E), or Epoxomicin (Epox, F) (n=4). (G-J) Representative confocal images (top) and quantifications (bottom) of the surface-derived MHC-I colocalized with the plasma membrane markers (G and I) or the lysosomal marker (H and J) in THP-1 cells (G and H) or MutuDC cells (I and J) transduced with indicated shRNAs. At least 100 cells were quantified in each group. All scale bars: 5 μm. (K and L) Flow cytometric analyses of intracellular MHC-I storage (K) and recycle (L) in shRNA-transduced THP-1 cells as described in Figures S5H and S5I, respectively. (for K: n=6; for L: n=4) Data are presented as the mean ± SEM (A-F, K, and L) or box and whiskers with all data points (G-J). ns, not significant; ***, p<0.001 by two-tailed unpaired Student’s t-test (A), two-way ANOVA for the last time point (C-F, K, and L), or Mann-Whitney test (G-J). sgRosa and shRen were used as controls.
Figure 6.
Figure 6.. The SUSD6/TMEM127/WWP2 complex mediates MHC-I ubiquitination and degradation. See also Figure S6.
(A) mRNA co-expression analysis of TMEM127 (left) and WWP2 (right) with SUSD6 in AML. Data were obtained from the TCGA database and analyzed by GEPIA2. (B) Immunoprecipitation using anti-FLAG antibody or anti-HA antibody in 293T cells transduced with SUSD6-FLAG, TMEM127-HA, and WWP2-V5. IP, immunoprecipitation; IB, immunoblotting; ISO, isotype. (C) Schematics (top) of the split-luciferase experiments and the bar plot showing the normalized relative luminescence units (RLU) (bottom) in 293T cells co-transfected with the indicated tagged proteins. (n=6) (D) Representative confocal images showing colocalization of the HLA-A2/SUSD6/TMEM127 complex with LAMP1+ lysosomes in 293T cells co-transduced with GFP-T10-tagged HLA-A2 alone (H) or together with GFP1–9-tagged SUSD6, and GFP-T11-tagged TMEM127 (HST). All scale bars: 5μm. (E) Bar plot showing the RLU in 293T cells co-transfected with WWP2-lgBit and the indicated smBit-tagged proteins as described in Figure S6L. (n=6) (F) Bar plot showing the RLU in 293T cells co-transfected with WWP2-lgBit and HLA-A2-smBit or Halo-smBit in the presence or absence of SUSD6 and/or TMEM127 overexpression as described in Figure S6M. (n=5) (G and H) THP-1 cells were transduced with FLAG-tagged WT HLA-A2 or 3KR HLA-A2 mutant and with the indicated shRNAs, followed by the indicated analyses. (G) Surface expression of FLAG-tagged HLA-A2. (n=3) (H) Time course studies of surface HLA-A2 expression (by FLAG staining) upon CHX treatment. (n=3) (I) FLAG-tagged WT HLA-A2- or 3KR HLA-A2-expressing THP-1 cells were transduced with the STW complex (SUSD6-V5, TMEM127-HA, and WWP2-V5) or control vectors (Vec), followed by immunoprecipitation using anti-FLAG beads. Data are presented as the mean ± SEM. ns, not significant; *, p< 0.05; **, p< 0.01; and ***, p< 0.001 by one-way ANOVA (C and E), two-tailed unpaired Student’s t-test (F and G), or two-way ANOVA for the last time point (H). shRen was used as a control.
Figure 7.
Figure 7.. Targeting the SUSD6/TMEM127/WWP2 complex enhances MHC-I expression and cancer immunity. See also Figure S7.
(A-B) Expression of the STW gene signature in AML (A) and PAAD (B). Red, cancer cells; Green, normal tissue. Data were obtained from the TCGA database and analyzed by GEPIA2. (C-D) Association of high or low STW gene signature with the overall survival of AML (C) or PAAD (D) patients in the TCGA database by SurvivalGenie. (E-J) Quantifications of the tumor volumes (left) and Kaplan-Meier survival curves (right) of immunocompetent (E-G) or CD8+ T cell-depleted (H-J) mice transplanted with C1498-Cas9-GFP (E and H), B16F10-OVA (F and I), or CT26 (G and J) cells transduced with the indicated sgRNAs or shRNAs. (for E: n=4 for sgNT and n=6 for sgTmem127; for F: n=4 for shRen and n=10 for shTmem127; for G: n=4 for shRen and n=5 for shTmem127; for H-J: n=7) Data are presented as box and whiskers with all data points (A-B) or the mean ± SEM (E-J left). ns, not significant; *, p< 0.05; **, p< 0.01; and ***, p< 0.001 by two-way ANOVA for the last time point (E-J left), or Log-rank Mantel-Cox test (E-J right). shRen and sgNT were used as controls.

Comment in

References

    1. Sharpe AH, and Pauken KE (2018). The diverse functions of the PD1 inhibitory pathway. Nature Reviews Immunology 18, 153–167. 10.1038/nri.2017.108. - DOI - PubMed
    1. Sanmamed MF, and Chen L. (2018). A Paradigm Shift in Cancer Immunotherapy: From Enhancement to Normalization. Cell 175, 313–326. 10.1016/j.cell.2018.09.035. - DOI - PMC - PubMed
    1. Wang J, Yuan R, Song W, Sun J, Liu D, and Li Z. (2017). PD-1, PD-L1 (B7-H1) and Tumor-Site Immune Modulation Therapy: The Historical Perspective. Journal of Hematology & Oncology 10, 34. 10.1186/s13045-017-0403-5. - DOI - PMC - PubMed
    1. Jhunjhunwala S, Hammer C, and Delamarre L. (2021). Antigen presentation in cancer: insights into tumour immunogenicity and immune evasion. Nat Rev Cancer 21, 298–312. 10.1038/s41568-021-00339-z. - DOI - PubMed
    1. Dhatchinamoorthy K, Colbert JD, and Rock KL (2021). Cancer Immune Evasion Through Loss of MHC Class I Antigen Presentation. Front Immunol 12, 636568. 10.3389/fimmu.2021.636568. - DOI - PMC - PubMed

Publication types