. 2023 Oct 9;58(19):1898-1916.e9.
doi: 10.1016/j.devcel.2023.07.007. Epub 2023 Aug 8.

Chromatin accessibility in the Drosophila embryo is determined by transcription factor pioneering and enhancer activation

Affiliations

Chromatin accessibility in the Drosophila embryo is determined by transcription factor pioneering and enhancer activation

Kaelan J Brennan et al. Dev Cell. .

Abstract

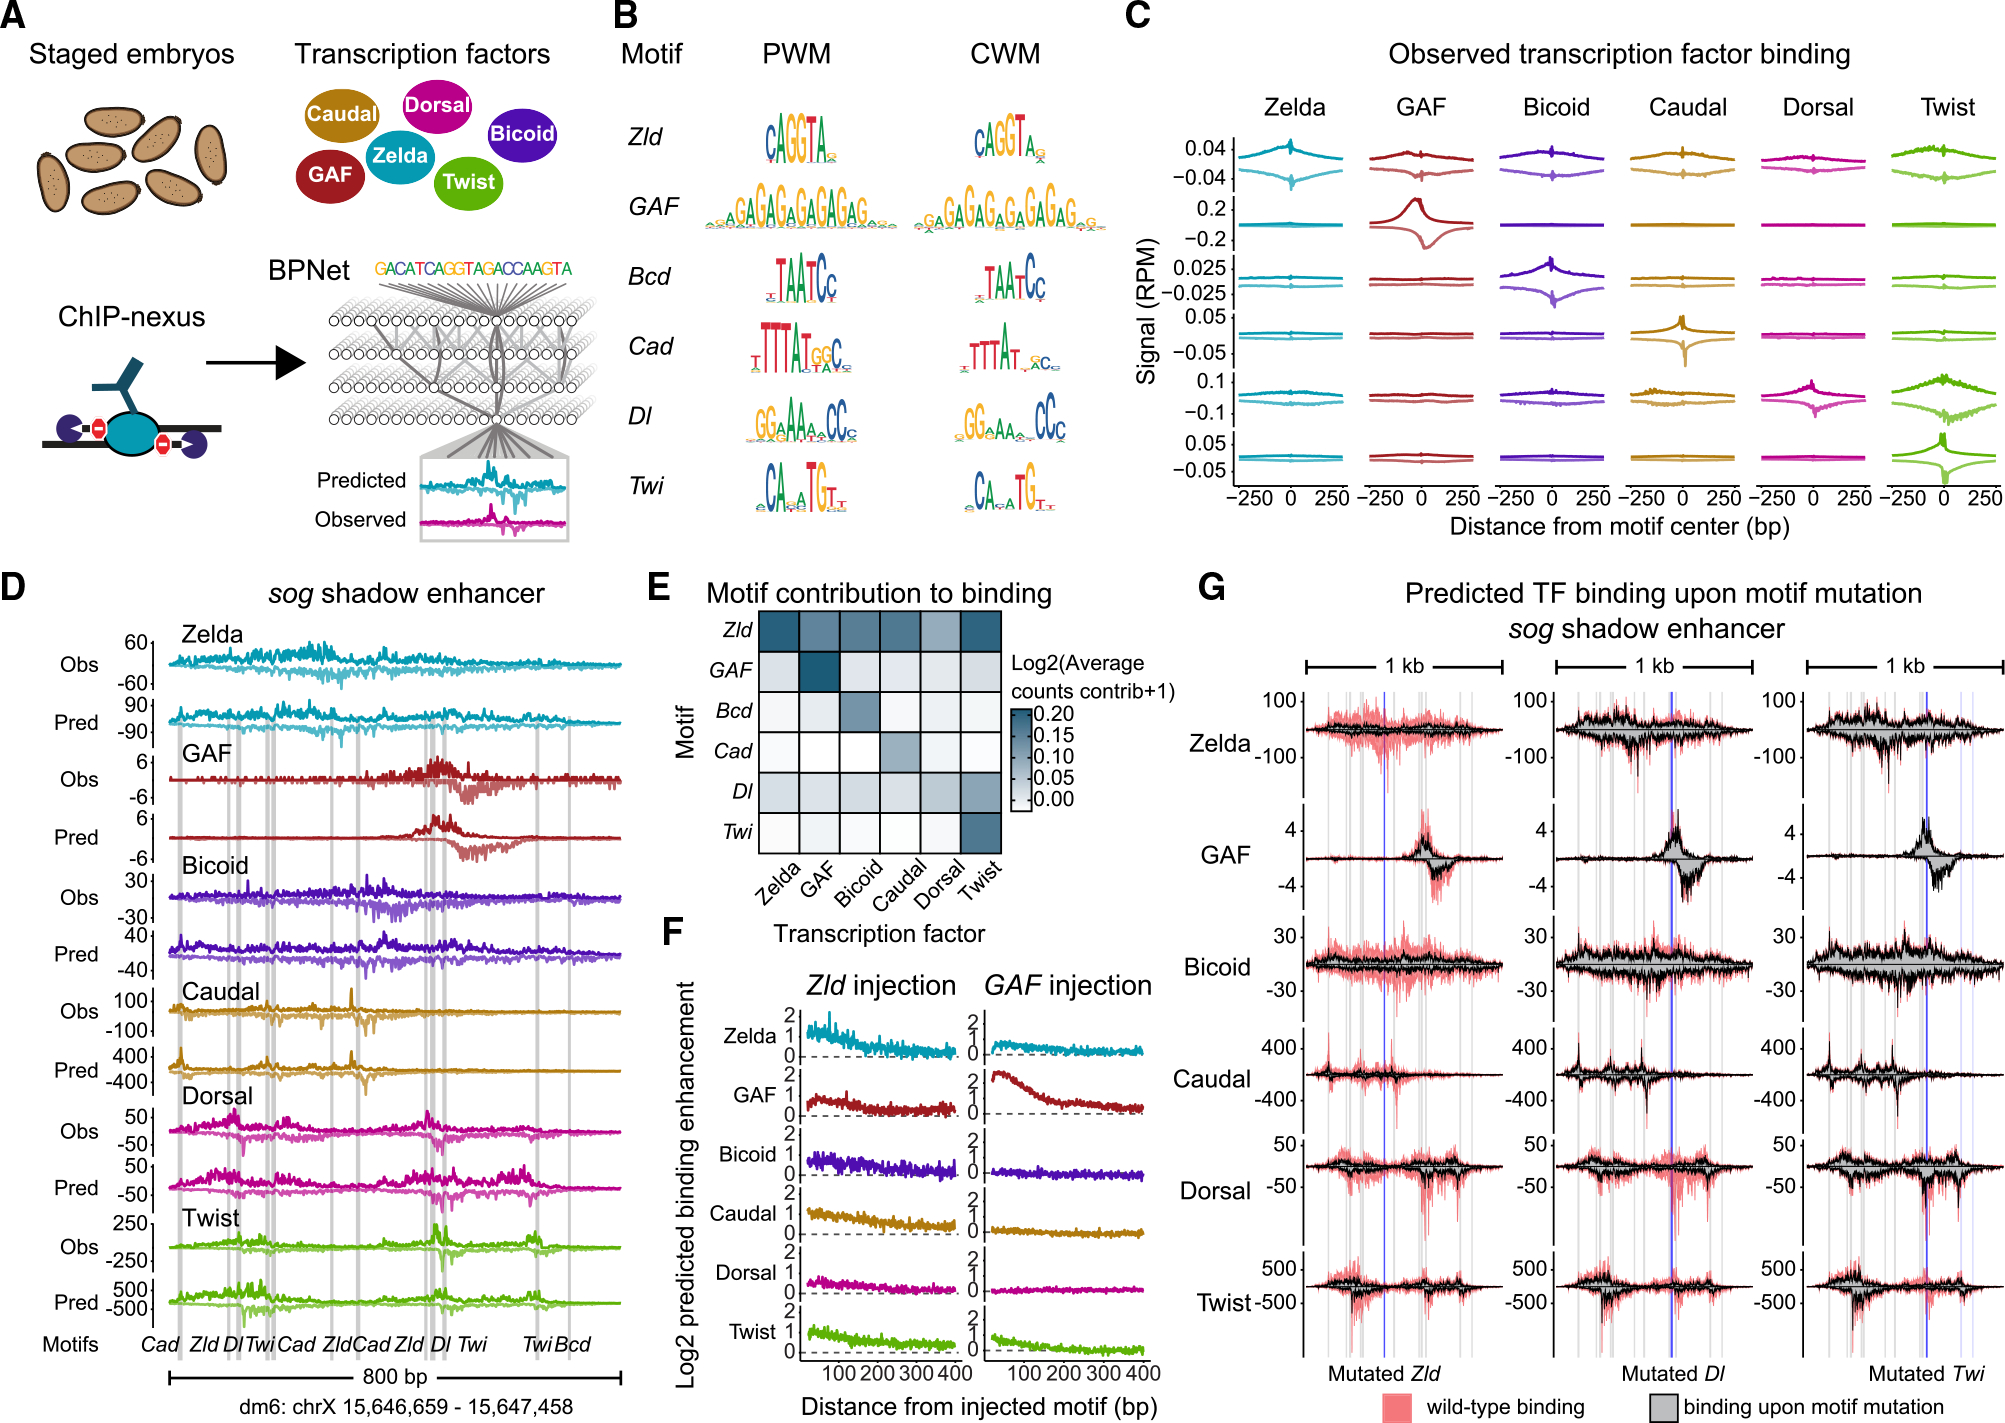
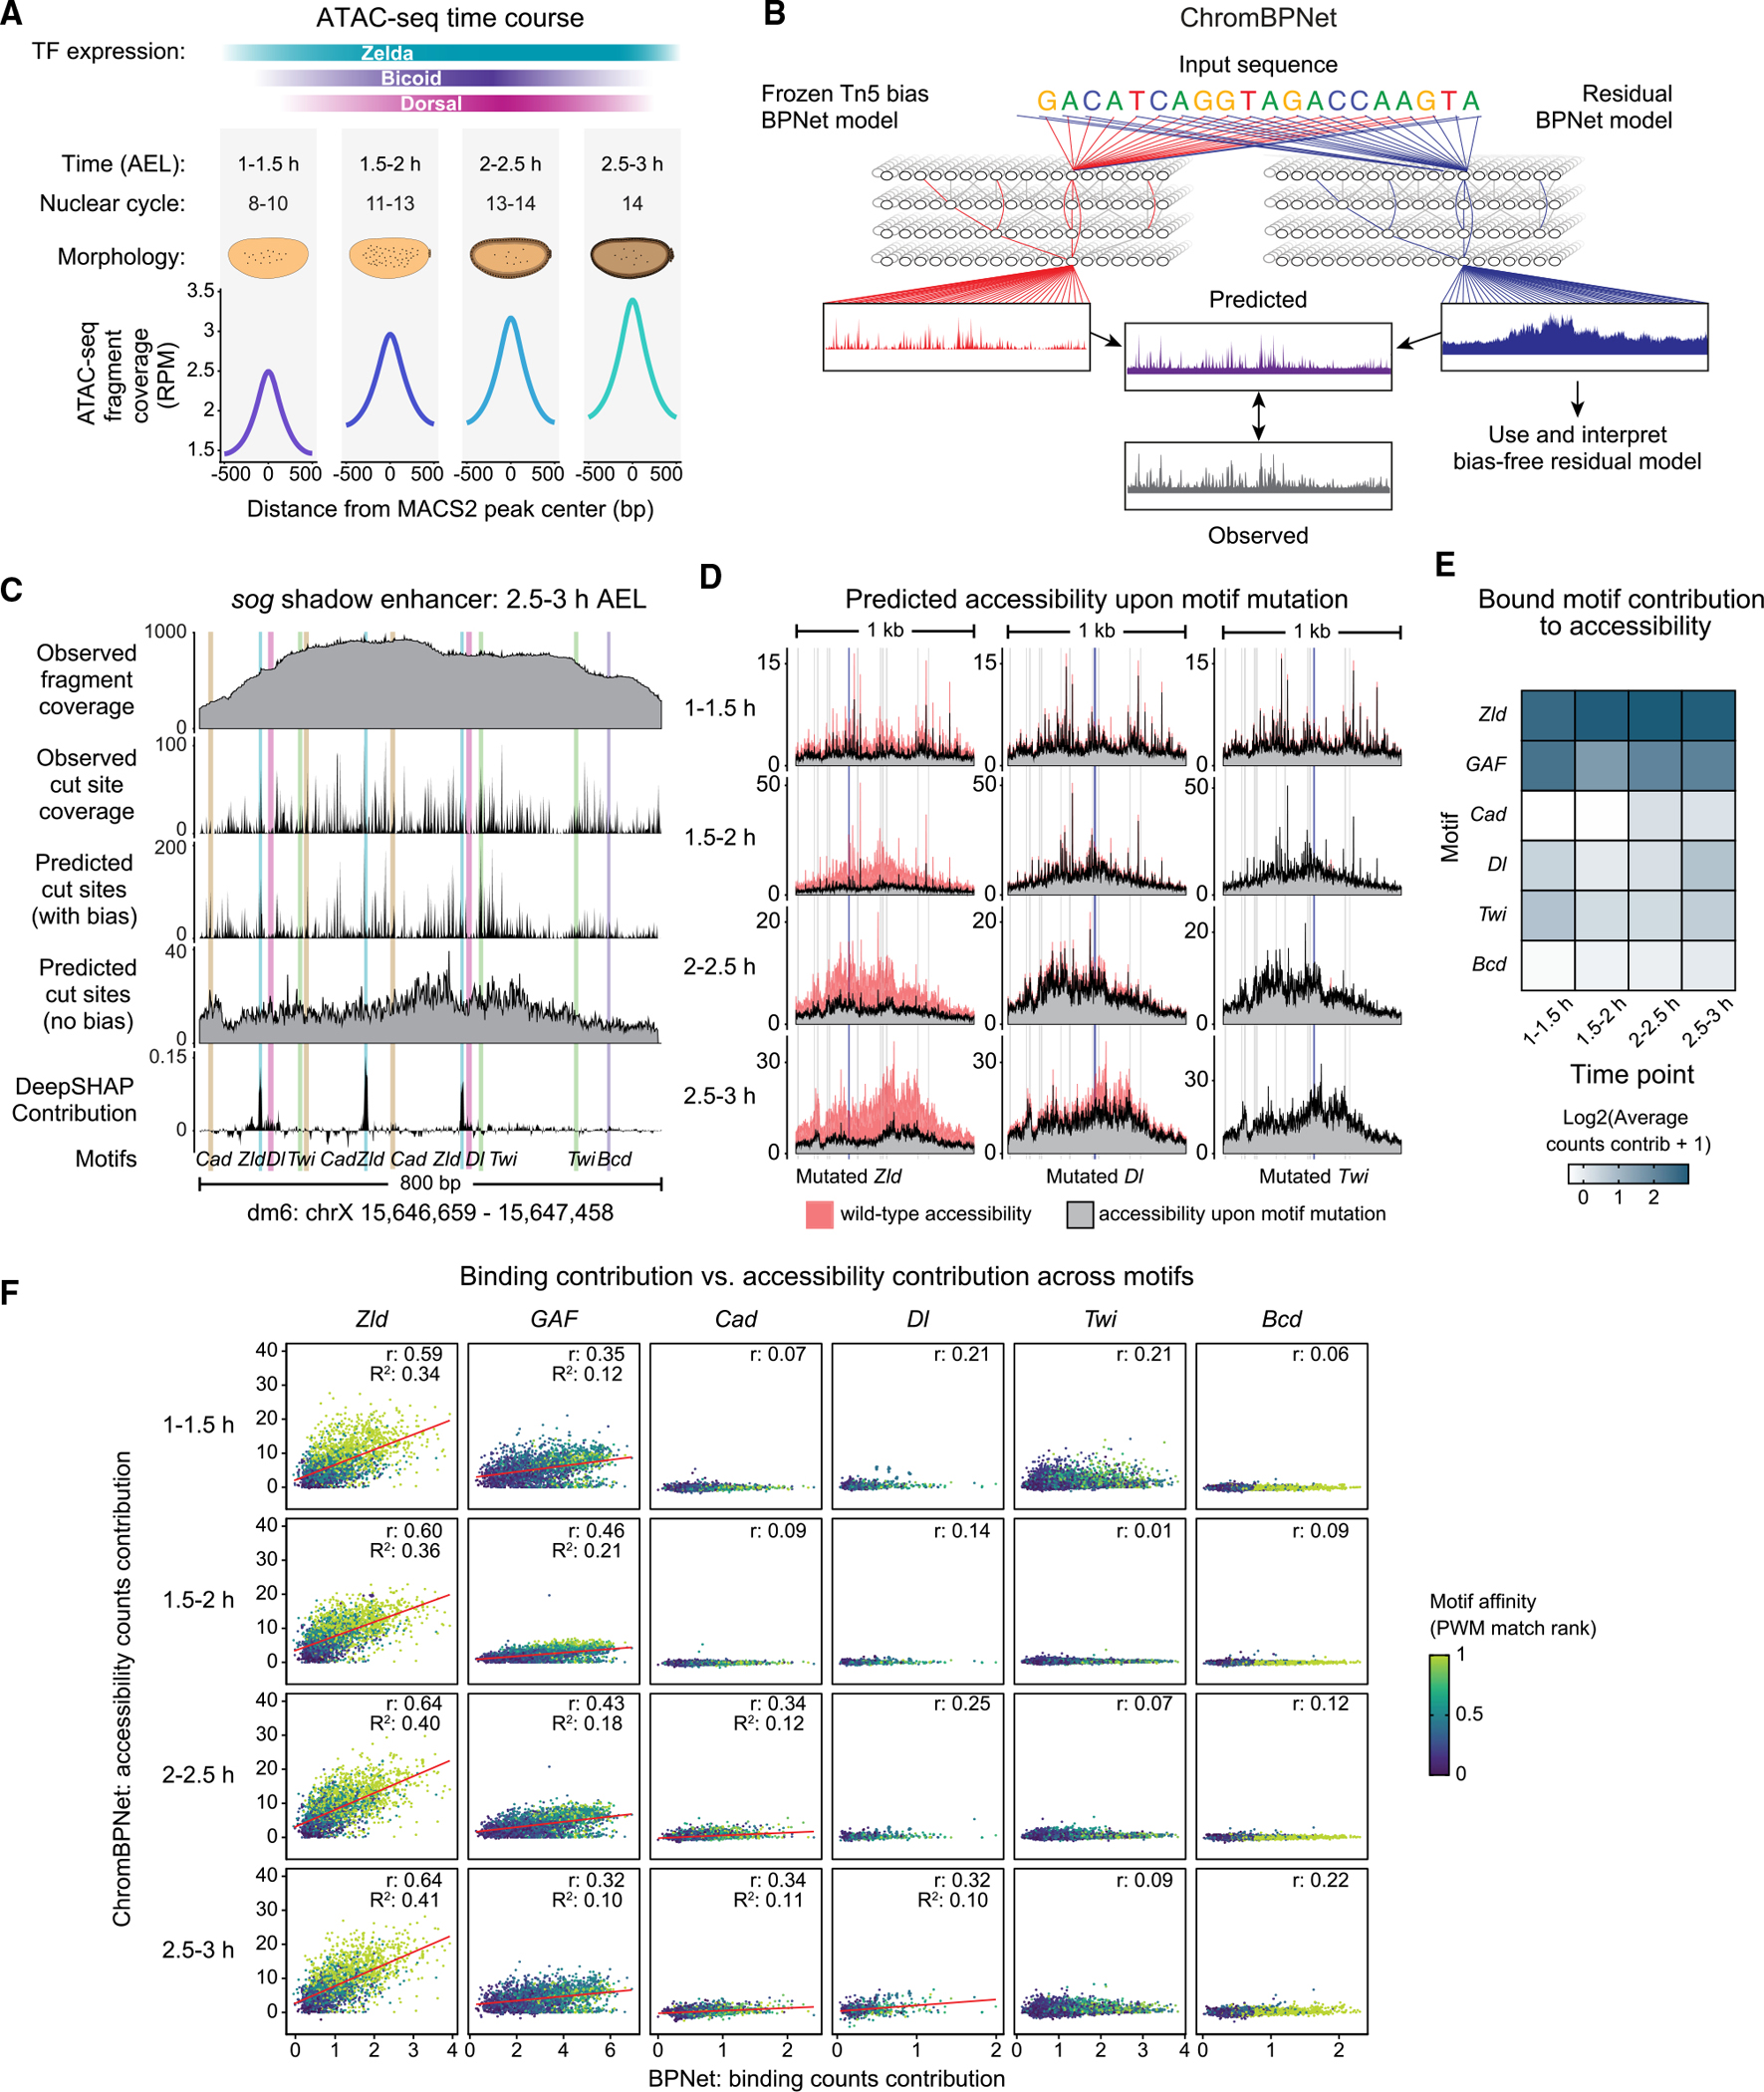
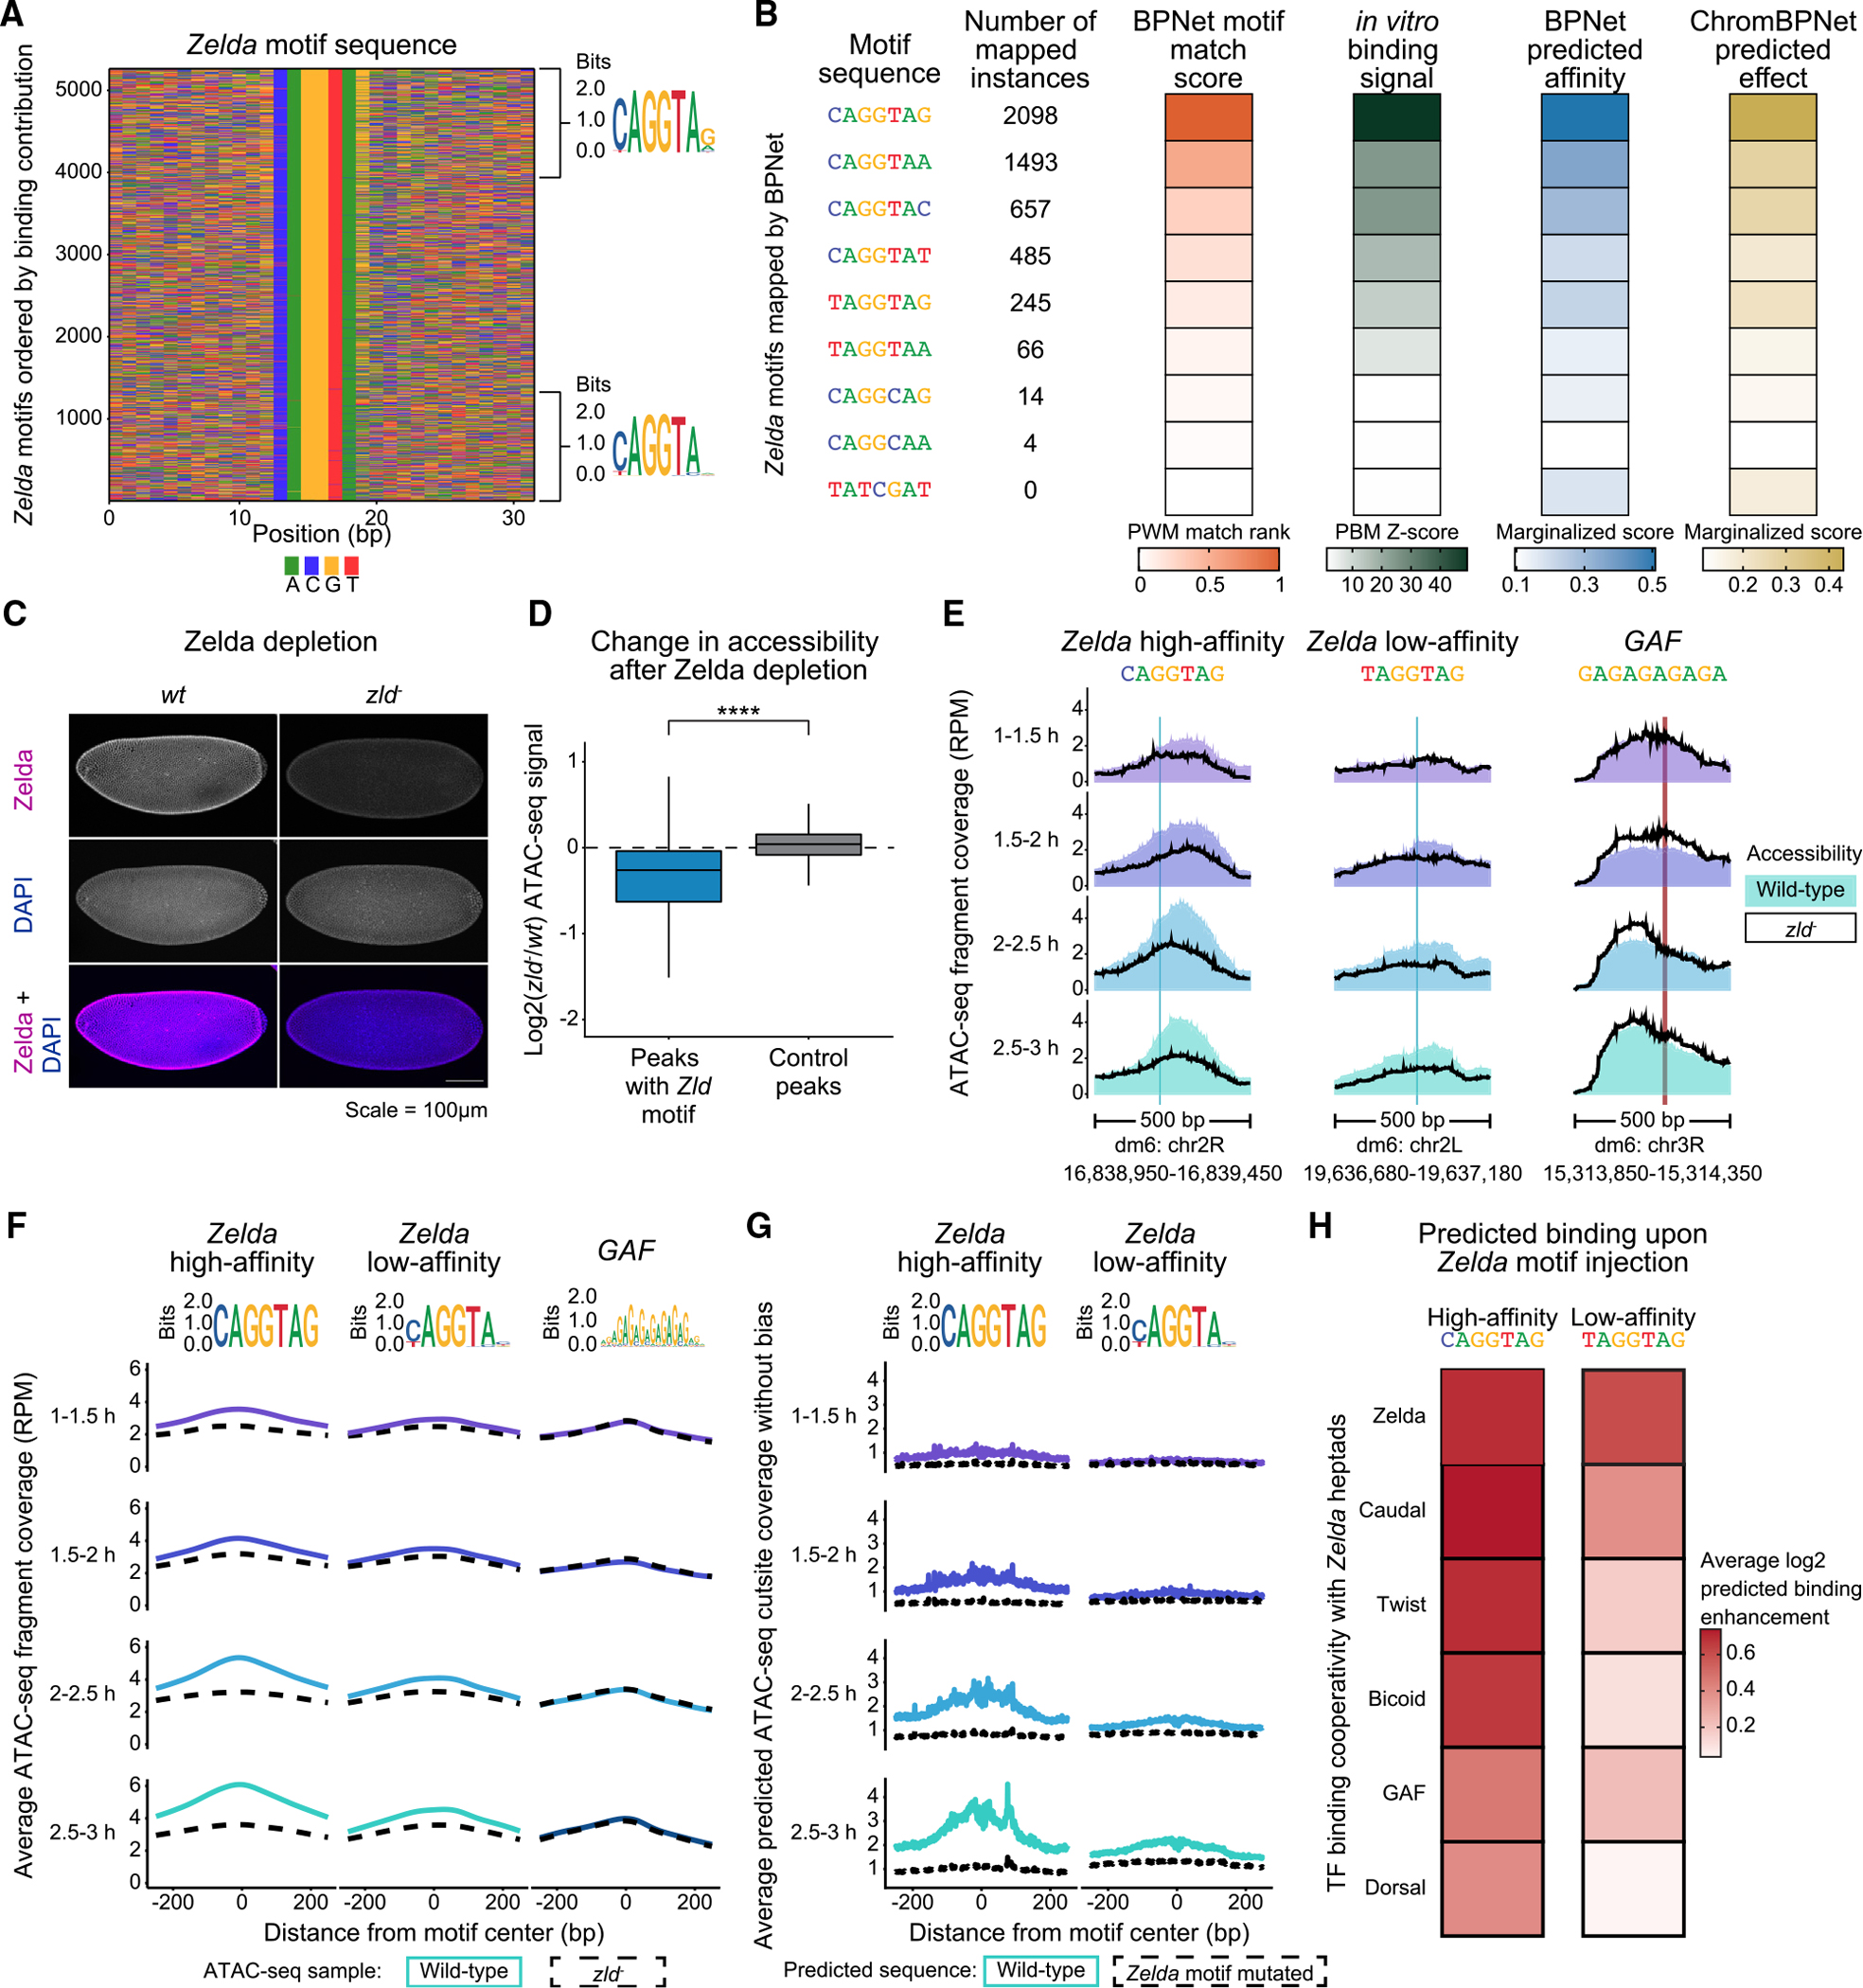
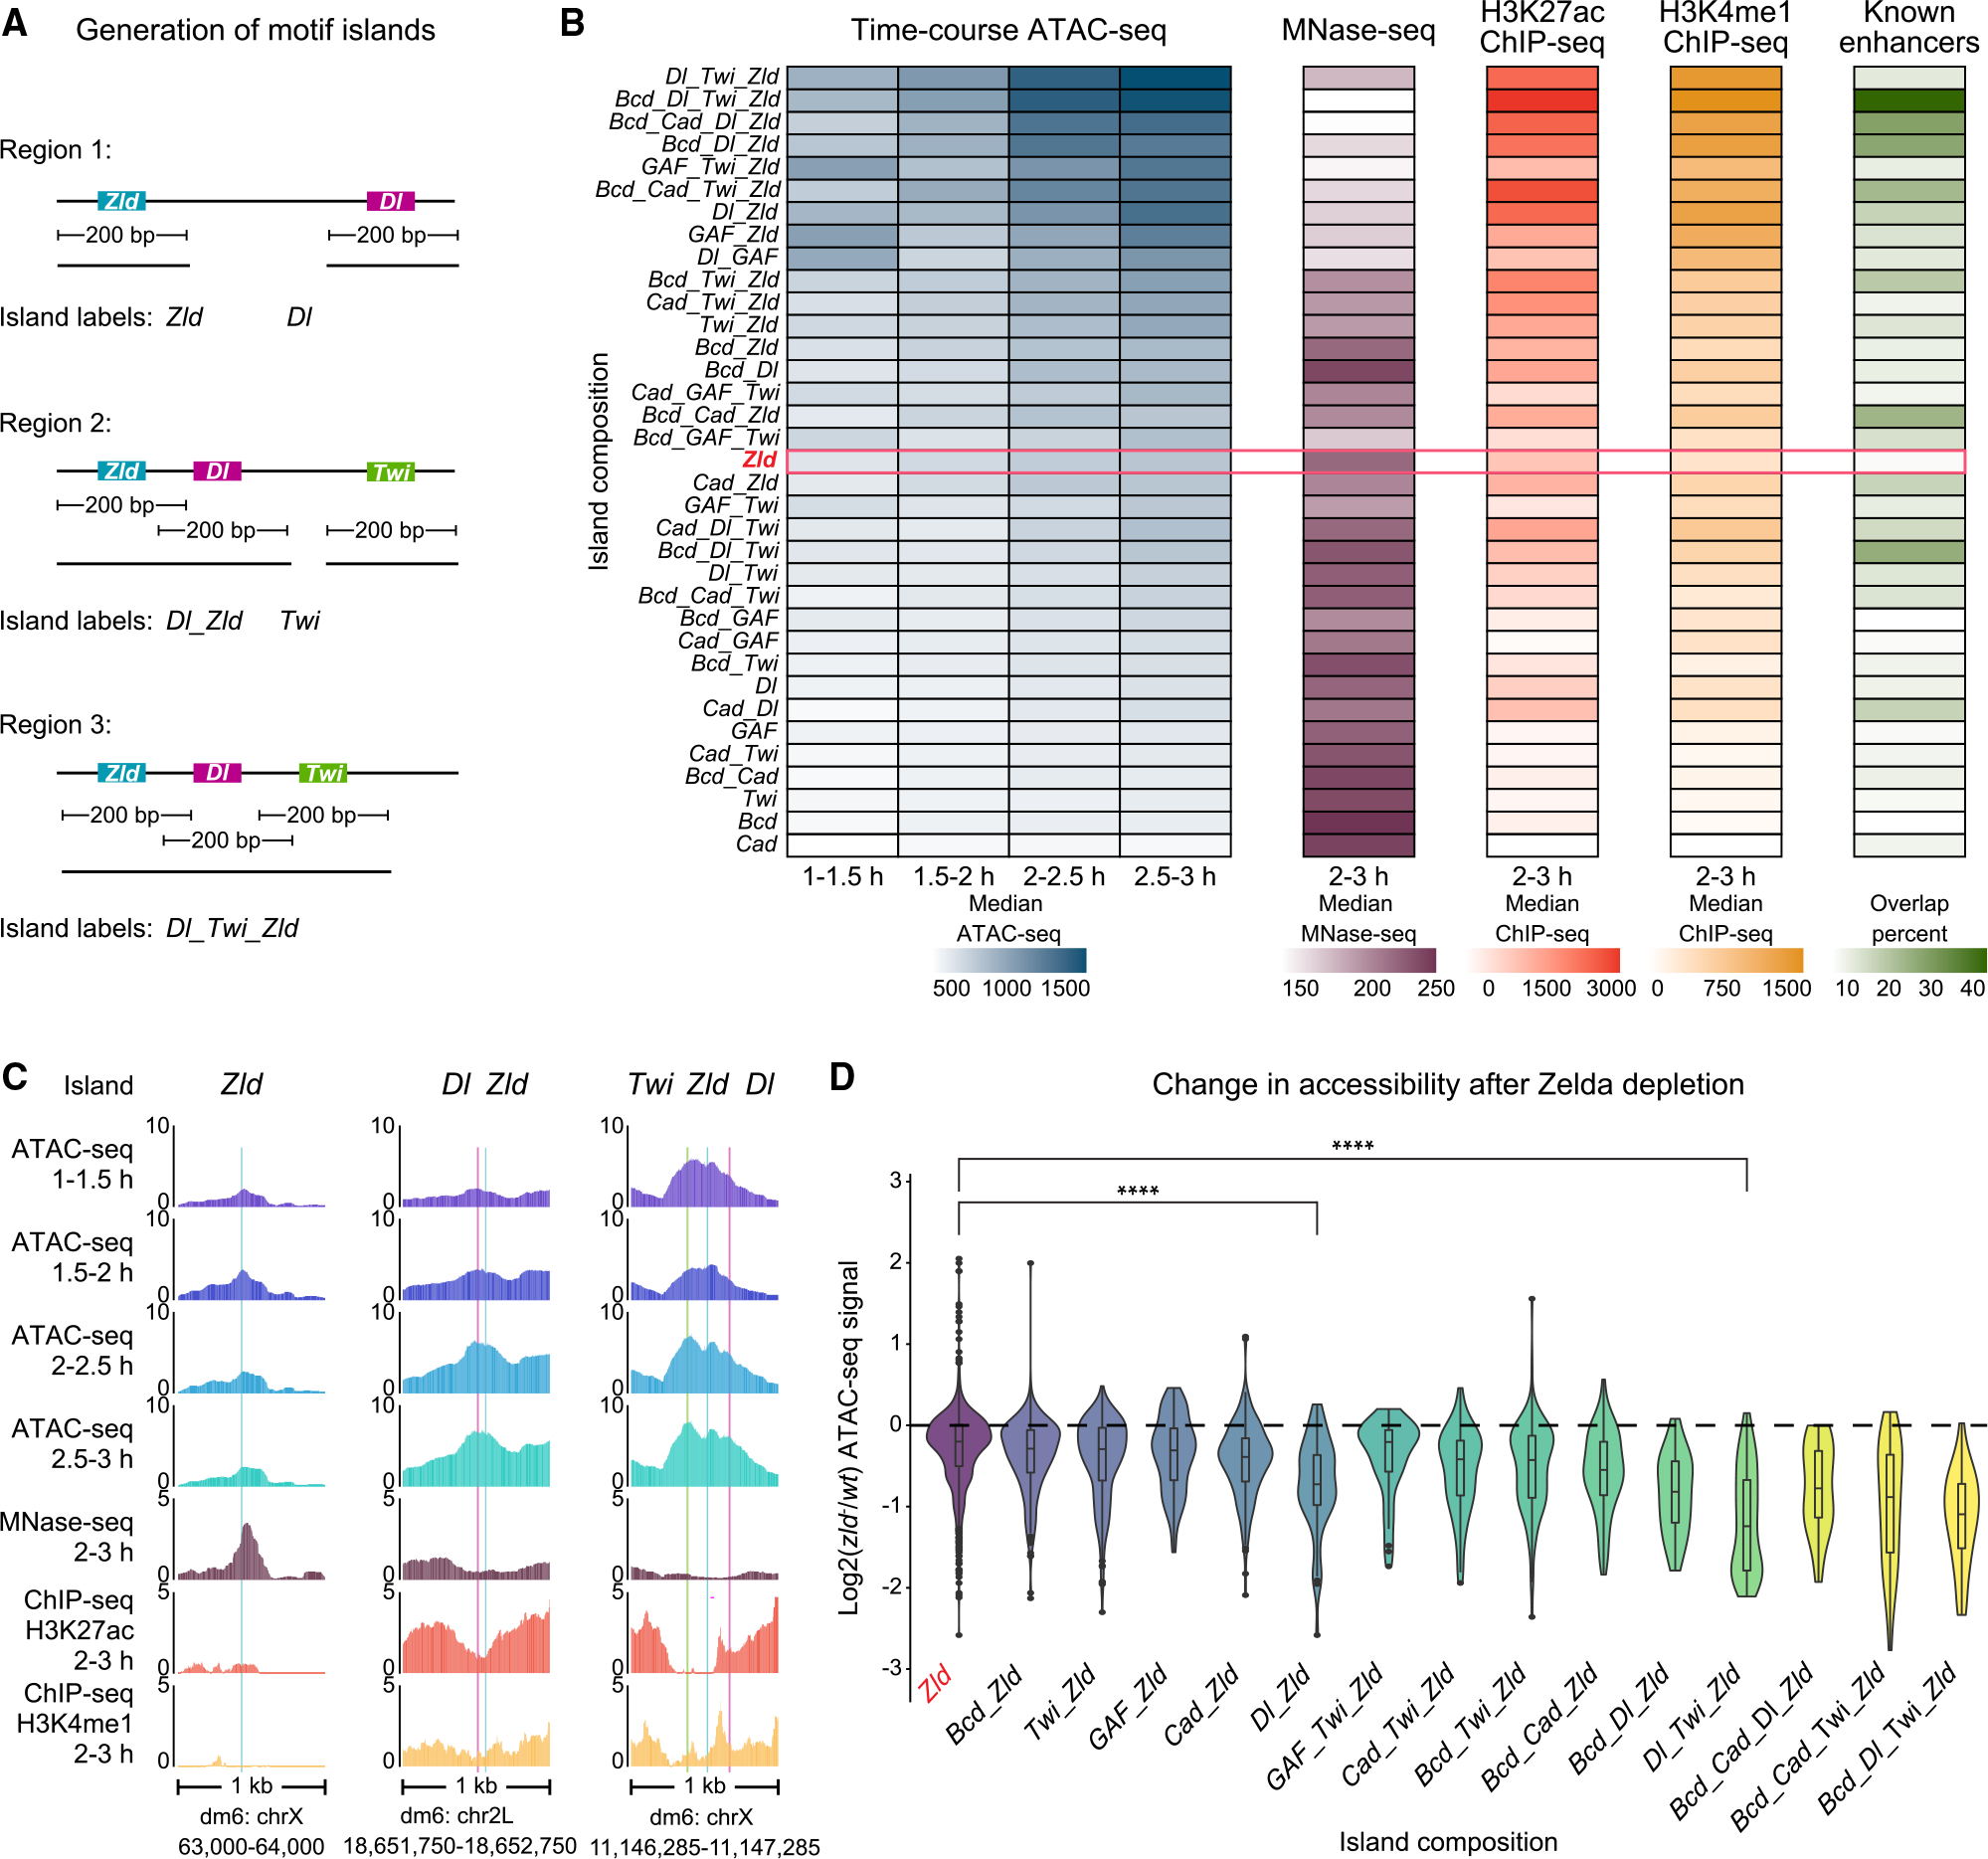
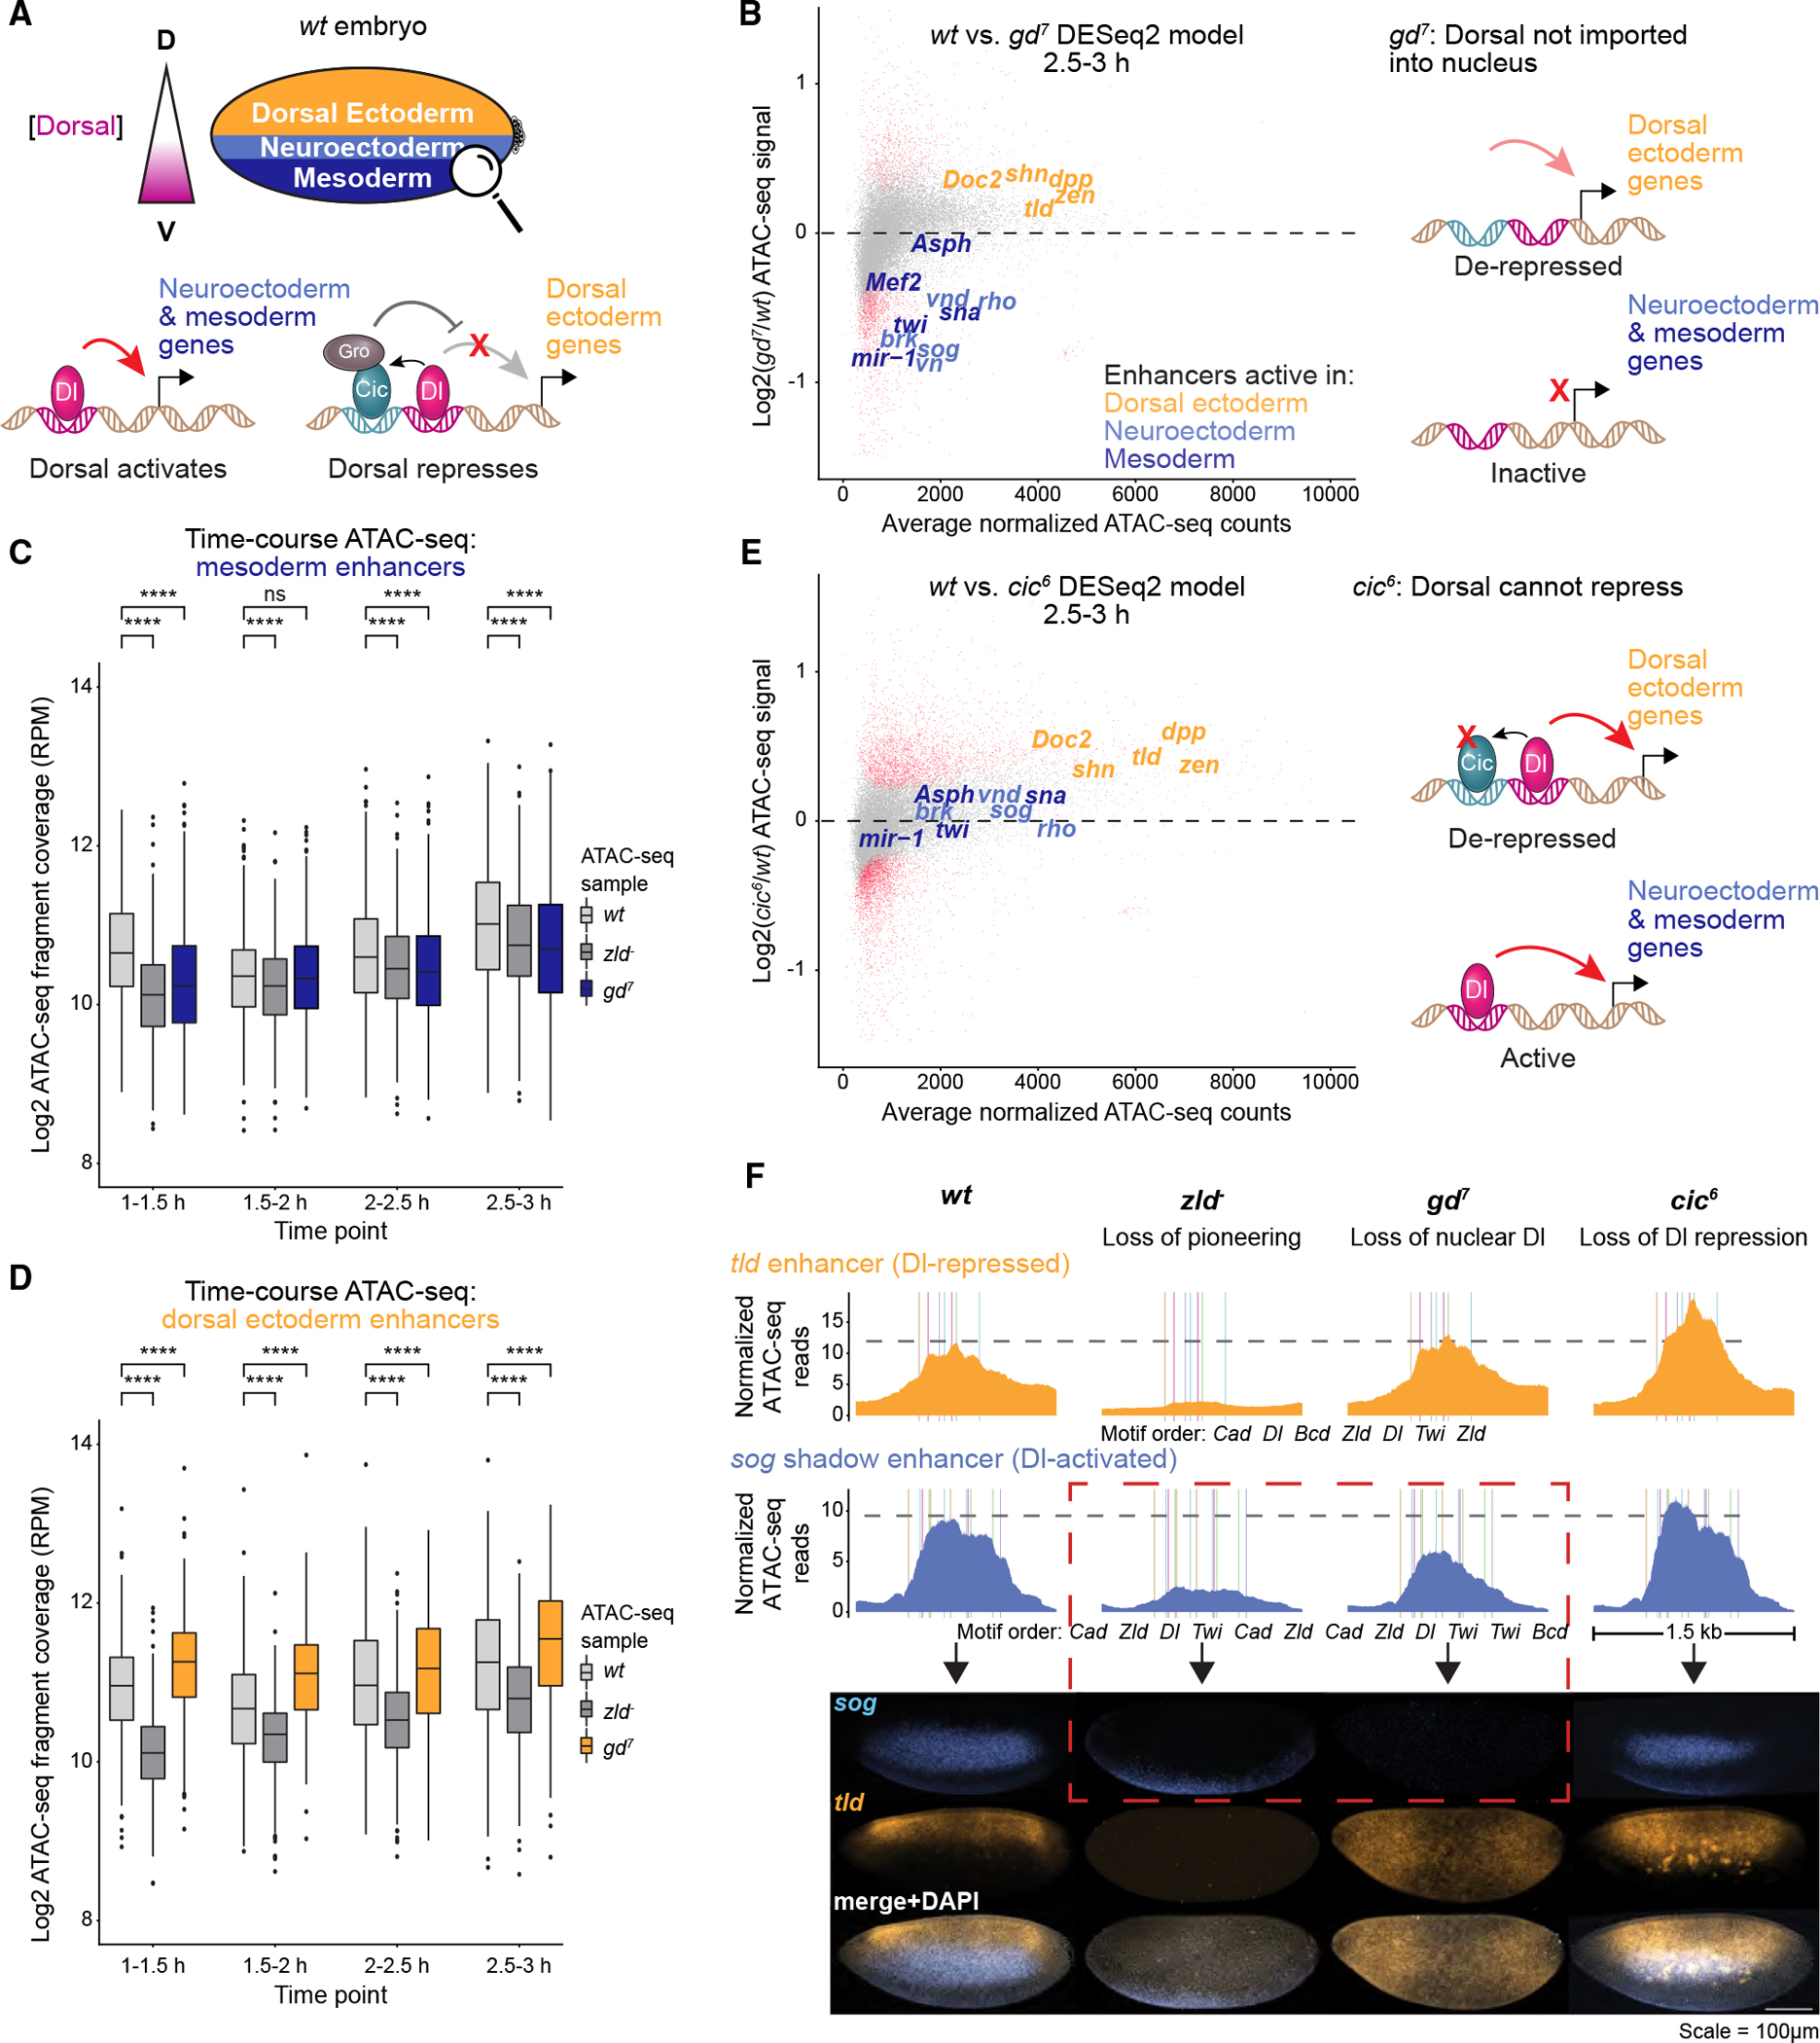
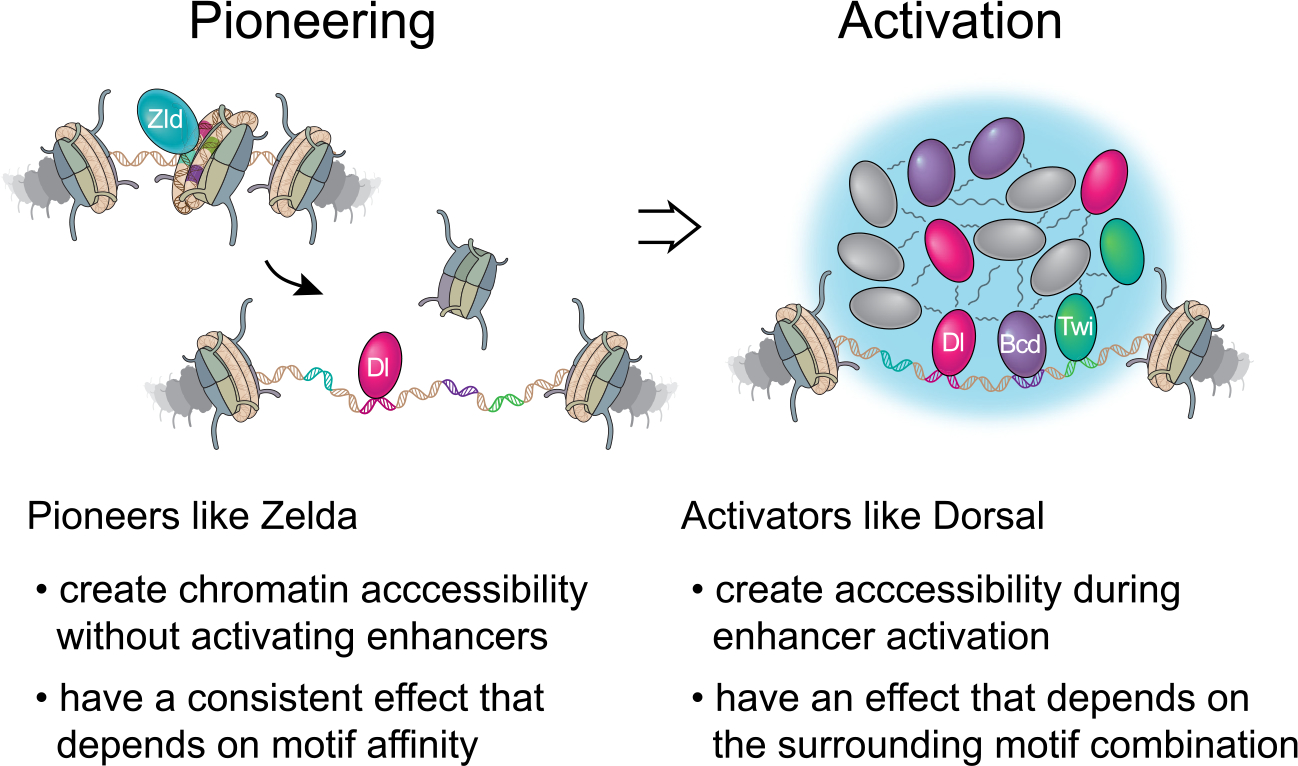
Chromatin accessibility is integral to the process by which transcription factors (TFs) read out cis-regulatory DNA sequences, but it is difficult to differentiate between TFs that drive accessibility and those that do not. Deep learning models that learn complex sequence rules provide an unprecedented opportunity to dissect this problem. Using zygotic genome activation in Drosophila as a model, we analyzed high-resolution TF binding and chromatin accessibility data with interpretable deep learning and performed genetic validation experiments. We identify a hierarchical relationship between the pioneer TF Zelda and the TFs involved in axis patterning. Zelda consistently pioneers chromatin accessibility proportional to motif affinity, whereas patterning TFs augment chromatin accessibility in sequence contexts where they mediate enhancer activation. We conclude that chromatin accessibility occurs in two tiers: one through pioneering, which makes enhancers accessible but not necessarily active, and the second when the correct combination of TFs leads to enhancer activation.

Keywords: ATAC-seq; BPNet; ChIP-nexus; Drosophila development; Zelda; chromatin accessibility; enhancers; interpretable deep learning; pioneer factors; transcription factors.


Conflict of interest statement

Declaration of interests J.Z. owns a patent on ChIP-nexus (no. 10287628). A.K. is on the scientific advisory board of PatchBio, SerImmune, AINovo, TensorBio and OpenTargets, was a consultant with Illumina, and owns shares in Illumina, Deep Genomics, Immunai, and Freenome Inc. All other authors declare no competing interests.

Figures

Figure 1.
Figure 1.. BPNet predicts a hierarchical relationship between Zelda and patterning TFs in the early Drosophila embryo
(A) ChIP-nexus produced high-resolution, strand-specific binding of Zelda (Zld), GAGA factor (GAF), Bicoid (Bcd), Caudal (Cad), Dorsal (Dl), and Twist (Twi) in stage 5 embryos. A multi-task BPNet model was trained to predict TF binding from DNA sequence. See also Figures S1A and S2A–S2B. (B) Identified motifs are shown as a frequency-based position weight matrix (PWM) and as a contribution weight matrix (CWM), which are highly similar for all TFs. See also Figure S2C. (C) Average ChIP-nexus TF binding footprints show that motifs directly bound by a TF have sharp footprints. Strand-specific data (+ strand on top; − strand at bottom) in reads per million (RPM) were averaged centered on each motif. (D) BPNet’s predictive accuracy illustrated at the sog shadow enhancer, which was withheld during training. Observed (Obs) ChIP-nexus data are shown above the BPNet-predicted (Pred) data. Motifs contributing to the predictions are found below. Additional enhancers are provided in Figure S3. (E) The average counts contribution score for all mapped motifs toward the binding of each TF reveals that the Zelda motif contributes to the binding of all TFs, but not vice versa, indicating a hierarchical relationship. Darker colors indicate that a motif (y axis) has a higher contribution score (shown on log scale) to the binding of a TF (x axis). (F) In silico injections of motifs into randomized sequences confirm that the Zelda motif is predicted to boost the binding of all TFs, while the GAF motif boosts only GAF’s binding. TF binding was predicted by BPNet when each motif was alone and when a Zelda motif (left), or a GAF motif (right), was injected at a given distance, up to 400 bp away (x axis). The average fold-change binding enhancement in the presence of Zelda/GAF is shown on the y axis. (G) When mutating a Zelda motif in the sog shadow enhancer, BPNet predicts reduced binding of all TFs, while mutating a Dorsal motif has a smaller but notable effect. Predicted binding at the wild-type sequence (red) is overlaid with the predicted binding when individual motifs are computationally mutated (gray). Blue bars highlight the mutated motifs; gray bars are all other mapped motifs. See also Figure S3.
Figure 2.
Figure 2.. ChromBPNet reveals distinct contributions from pioneers and patterning TFs in early Drosophila embryos
(A) ATAC-seq experiments were performed in four 30-min windows on hand-sorted embryos. See also Figure S1B. (B) ChromBPNet predicts bias-free chromatin accessibility at base-resolution. A bias model is first trained on ATAC-seq data at closed genomic regions to learn baseline Tn5 sequence bias, then frozen and used for training alongside a second, residual BPNet model on open ATAC-seq regions. When the bias model is removed, the residual model predicts the bias-removed ATAC-seq data. See also Figures S2D–S2H. (C) ChromBPNet accurately predicts accessibility at the sog shadow enhancer (2.5–3 h data). Experimentally generated ATAC-seq data are shown as conventional fragment coverage (first track) and Tn5 cut site coverage (second track), which closely mirrors ChromBPNet’s prediction from the combined model (third track). After removing the bias model, ChromBPNet’s predicted profile is more evenly distributed (fourth track). The counts contribution scores for each base across the enhancer (fifth track) shows spikes at BPNet-mapped motifs. Additional enhancers provided in Figures S4A–S4D. (D) ChromBPNet predicts the effect of mutating a Zelda (left), Dorsal (middle), and Twist (right) motif at the sog shadow enhancer for each time point (same motifs as in Figure 1G). Mutating the Zelda motif had the largest effect on chromatin accessibility, while the Dorsal motif mutation lowered accessibility to a lesser extent and only at later time points. See also Figures S4E–S4H. (E) Average counts contribution scores for each BPNet-mapped motif (y axis) for all time points (x axis) show that pioneering motifs contribute to chromatin accessibility at all time points, whereas patterning TF motifs have a lesser contribution that is limited to later time points. See also Figure S2I–S2K. (F) Pioneer TF motifs show a three-way correlation between binding contribution, accessibility contribution, and motif strength. Patterning TFs show much weaker, time point-specific relationships, suggesting context-dependent behavior. For each bound and accessible motif for all TFs, the binding counts contribution scores (x axis) and accessibility counts contribution scores (y axis) are plotted. The motif strength (color scale) represents the rank percentile of the PWM match scores. Pearson correlation values (r) and coefficient of determination R2 values were calculated. Red lines are shown for plots with an r > 0.3.
Figure 3.
Figure 3.. The pioneer TF Zelda reads out motif affinity to drive chromatin accessibility
(A) The Zelda-binding contributions from the BPNet model reflect the known Zelda motif affinities. Zelda motif sequences, ordered by their counts contribution scores to Zelda binding, are shown from high (top) to low (bottom). Motif logos for the highest and lowest quartiles mainly differ in the first and last base of the 7-mer sequence. See also Figure S5A. (B) The model-derived motif strengths strongly correlate with experimentally measured Zelda motif affinities. Shown for all mapped Zelda motif 7-mer sequences and a negative control (TATCGAT) are: the rank percentile of their PWM match scores (orange), the median Z scores from Zelda protein-binding microarray (PBM) experiments (green), and the marginalized effects predicted by the trained BPNet (blue) and ChromBPNet (gold). See also Figure S5B. (C) Confocal images of stage 5 embryos show strong Zelda protein depletion in zld versus wt embryos. (D) Chromatin accessibility is significantly reduced at ATAC-seq peaks containing mapped Zelda motifs. Using DESeq2, the log2-fold changes between wt and zld embryos were calculated for each peak region over time, and the median values among the four time points were plotted. Peaks containing Zelda motifs are significantly different from control peaks without Zelda motifs (Wilcoxon rank-sum test, p < 2e−16). See also Figures S1C and S5C. (E) Zelda motif strength determines the reduction in chromatin accessibility in zld embryos. Individual examples of normalized accessibility in wt (shaded profile) and zld (black line) embryos are shown at a high-affinity Zelda motif (CAGGTAG, left) and a low-affinity Zelda motif (TAGGTAG, middle), with the GAF motif (right) as a control. No other BPNet-mapped motifs are found within these regions. (F) Average chromatin accessibility profiles for wt and zld embryos show that high- and low-affinity motifs both facilitate Zelda’s pioneering, but low-affinity motifs do so to a lesser extent. Among regions that only contain a single Zelda motif, those with the 250 highest- and 250 lowest-affinity motifs were selected (summarized as motif logos). GAF motifs were used as control. Anchored on these Zelda motifs, the average profiles of normalized ATAC-seq data are shown for wt (colored lines) and zld embryos (dotted black lines). Motifs mapping to promoters were excluded, as in ChromBPNet training. See also Figures S5D–S5E. (G) Average ChromBPNet-predicted chromatin accessibility (bias-corrected cut site coverage) at the same high- and low-affinity Zelda motif regions for the wt sequences and after computationally mutating the Zelda motifs. The results confirm that ChromBPNet has learned the effects of Zelda motif affinity. (H) BPNet has also learned that low-affinity Zelda motifs boost TF binding less than high-affinity motifs. TF motifs were injected into randomized sequences with either a high-affinity Zelda motif (CAGGTAG) or a low-affinity Zelda motif (TAGGTAG) at a given distance away for up to 200 bp, and the average TF binding enhancement over no added Zelda was predicted (y axis). See also Figures S5G–S5H.
Figure 4.
Figure 4.. Patterning TFs increase chromatin accessibility in a context-dependent manner
(A) Schematic summary of motif islands. Motif islands are generated by first resizing all BPNet-mapped and bound motifs to 200 bp wide. Next, overlapping regions are merged and classified based on the motifs that compose them. See also Table S1. (B) Islands with combinations of Zelda and patterning TF motifs contain the highest chromatin accessibility, nucleosome depletion, active enhancer histone modifications, and known enhancer overlap. For each motif island type with a specific motif composition (y axis), the median normalized ATAC-seq fragment coverage, MNase-seq signal, H3K27ac ChIP-seq signal, H3K4me1 ChIP-seq signal and the overlap with enhancers active in 2–4 h AEL embryos are shown via the color scale. The red bar highlights islands that contain only Zelda motifs, and islands are ordered by total ATAC-seq signal. See also Figures S1D–S1E and S5F. (C) Individual island examples, where colored bars indicate BPNet-mapped motifs (blue = Zld, magenta = Dl, green = Twi). (D) Chromatin accessibility is most strongly reduced in zld embryos at islands containing Zelda and patterning TF motifs. Using DESeq2, log2-fold changes in ATAC-seq signal between wt and zld embryos were calculated for each island, and their median changes across the time points are shown. Islands that contain patterning TF motifs in addition to Zelda motifs show significantly more changes than those with Zelda motifs only, e.g., the difference between Zld and Dl_Zld islands (p = 8.3e−11, Wilcoxon rank-sum test) and Zld and Dl_Twi_Zld islands (p < 2.22e−16, Wilcoxon rank-sum test).
Figure 5.
Figure 5.. Patterning transcription factors increase chromatin accessibility through transcriptional activation
(A) Dorsoventral patterning in the early Drosophila embryo occurs through a nuclear concentration gradient of the Dorsal TF, which activates mesodermal and neuroectodermal target genes but represses dorsal ectodermal genes. Dorsal repression occurs through Capicua, whose binding at these regions depends on Dorsal and which recruits the co-repressor Groucho. (B) In embryos lacking nuclear Dorsal (gd7), chromatin accessibility is specifically reduced at Dorsal-activated enhancers but not at Dorsal-repressed enhancers. Differential accessibility was calculated between wt and gd7 embryos for all time points and the MA plot for the 2.5–3 h AEL time point is shown. Red dots represent statistically significant differences (false discovery rate [FDR] = 0.05). Known dorsoventral enhancers are colored by the tissue type in which they are active. See also Figures S1F and S6A–S6B. (C) Mesoderm enhancers, as characterized previously (n = 416), have significantly reduced chromatin accessibility in gd7 embryos when they are inactive (Wilcoxon rank-sum tests, four asterisks: p < 0.0001). Normalized ATAC-seq fragment coverage was calculated across 1 kb centered on each enhancer. See also Figure S6C. (D) Dorsal ectoderm enhancers (n = 380) gain chromatin accessibility in gd7 embryos where they are not repressed by Dorsal. (E) In cic6 embryos, where Capicua’s interaction with Groucho is abrogated and Dorsal can no longer repress, chromatin accessibility is increased at Dorsal-repressed enhancers. Differential accessibility analysis between wt and cic6 embryos was performed as in (B). See also Figures S1G and S6D–S6E. (F) Chromatin accessibility and target gene activation do not always correlate (dashed red box). ATAC-seq data at a Dorsal-repressed enhancer (tld) and Dorsal-activated enhancer (sog shadow) upon loss of Zelda (zld), nuclear Dorsal (gd7), and Dorsal-mediated repression (cic6) are shown on top as normalized ATAC-seq fragment coverage from the 2.5–3 h AEL time point across 1.5 kb windows: dm6 coordinates chr3R:24,748,748–24,750,248 (tld) and chrX:15,646,300–15,647,800 (sog shadow). The wt ATAC-seq maximum value is marked as a dotted gray line. Colored bars are BPNet-mapped motifs listed below. Multiplexed hybridization chain reaction experiments show sog and tld expression in stage 5 wt, zld, gd7, and cic6 mutant embryos (scale is 100 um). Note that sog expression is partially reduced upon loss of Zelda’s pioneering, but completely gone upon loss of Dorsal. Meanwhile, tld expression is ablated in the absence of Zelda but expands upon loss of Dorsal or Dorsal-mediated repression. See also Figures S6F–S6G.
Figure 6.
Figure 6.. Pioneering and enhancer activation increase chromatin accessibility
Chromatin accessibility at enhancers is established in a two-tier process that involves pioneering and activation. The pioneer Zelda bestows basal chromatin accessibility at enhancers without necessarily activating them. It does so by reading out its motif affinity on nucleosomal DNA and producing a consistent effect that is not dependent on the surrounding motif combination. The accessible DNA then allows the binding of patterning TFs such as Dorsal. Activation occurs when patterning TFs bind at high concentrations and enable the formation of hubs through multivalent weak interactions with each other and cofactors such as histone acetyltransferases. Whether or not Zelda is present in these hubs is unclear. Since enhancer activation through hubs is DNA-templated, it is inherently dependent on the motif combination within the enhancer. How enhancer activation increases chromatin accessibility further is not clear, possibly due to histone acetylation and the highly dynamic nature of hubs.

References

    1. Spitz F, and Furlong EEM (2012). Transcription factors: from enhancer binding to developmental control. Nat. Rev. Genet. 13, 613–626. 10.1038/nrg3207. - DOI - PubMed
    1. Levine M, and Davidson EH (2005). Gene regulatory networks for development. Proc. Natl. Acad. Sci. USA 102, 4936–4942. 10.1073/pnas.0408031102. - DOI - PMC - PubMed
    1. Zeitlinger J (2020). Seven myths of how transcription factors read the cis-regulatory code. Curr. Opin. Syst. Biol. 23, 22–31. 10.1016/j.coisb.2020.08.002. - DOI - PMC - PubMed
    1. Barozzi I, Simonatto M, Bonifacio S, Yang L, Rohs R, Ghisletti S, and Natoli G (2014). Coregulation of transcription factor binding and nucleosome occupancy through DNA features of mammalian enhancers. Mol. Cell 54, 844–857. 10.1016/j.molcel.2014.04.006. - DOI - PMC - PubMed
    1. Li X-Y, and Eisen MB (2018). Zelda potentiates transcription factor binding to zygotic enhancers by increasing local chromatin accessibility during early Drosophila melanogaster embryogenesis. 10.1101/380857. - DOI

Publication types

MeSH terms

LinkOut - more resources