. 2023 Aug 15;4(8):101146.
doi: 10.1016/j.xcrm.2023.101146. Epub 2023 Aug 8.

Non-invasive tumor microenvironment evaluation and treatment response prediction in gastric cancer using deep learning radiomics

Affiliations

Non-invasive tumor microenvironment evaluation and treatment response prediction in gastric cancer using deep learning radiomics

Yuming Jiang et al. Cell Rep Med. .

Abstract

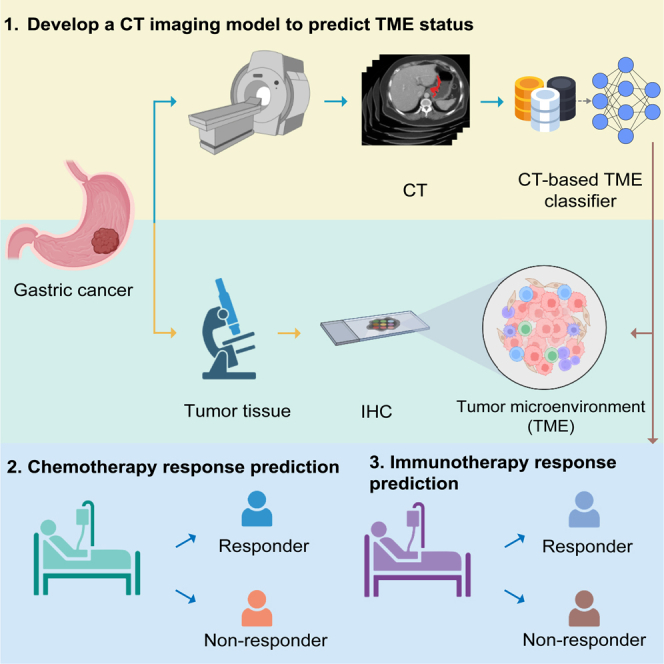
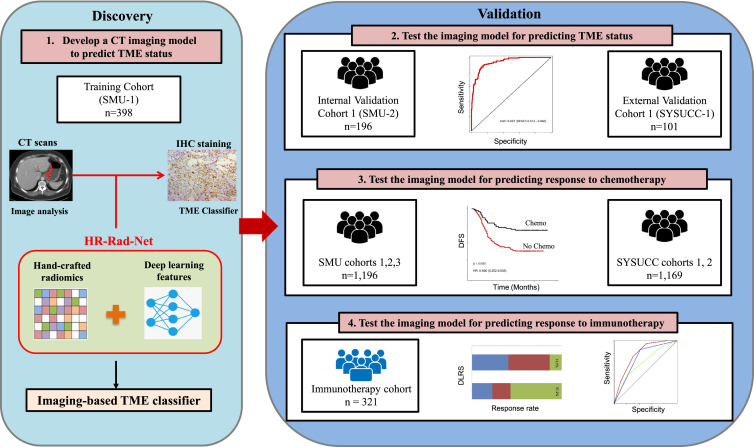
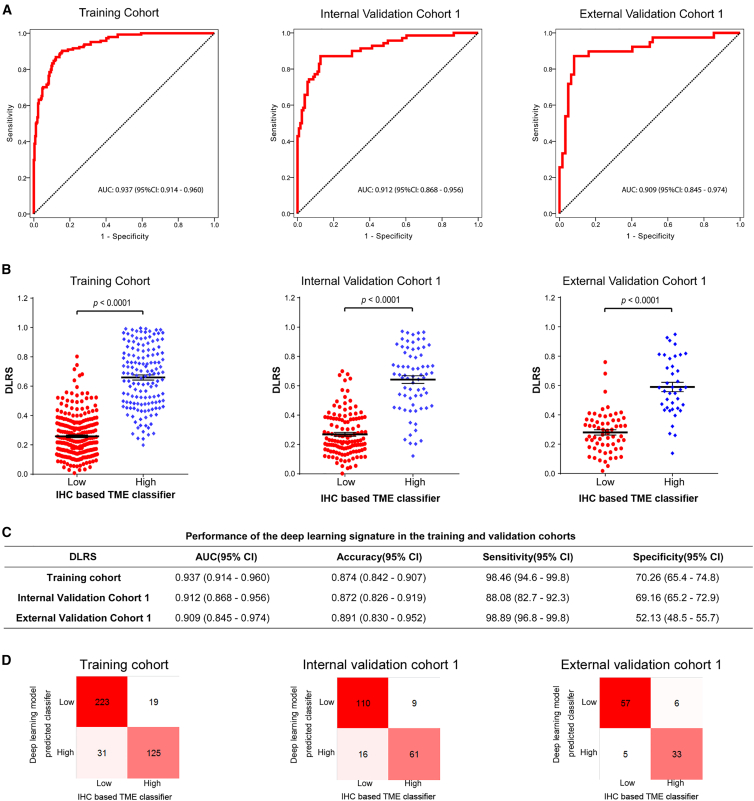
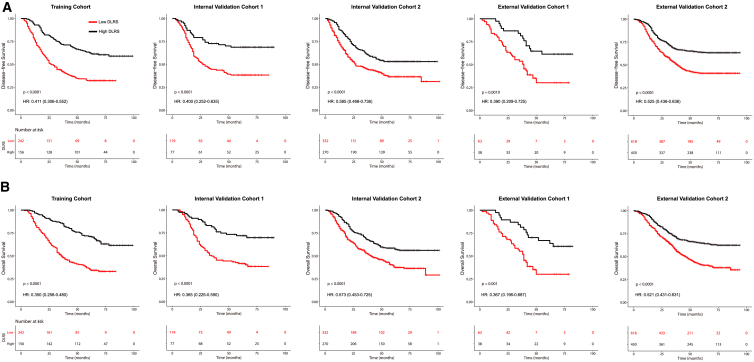
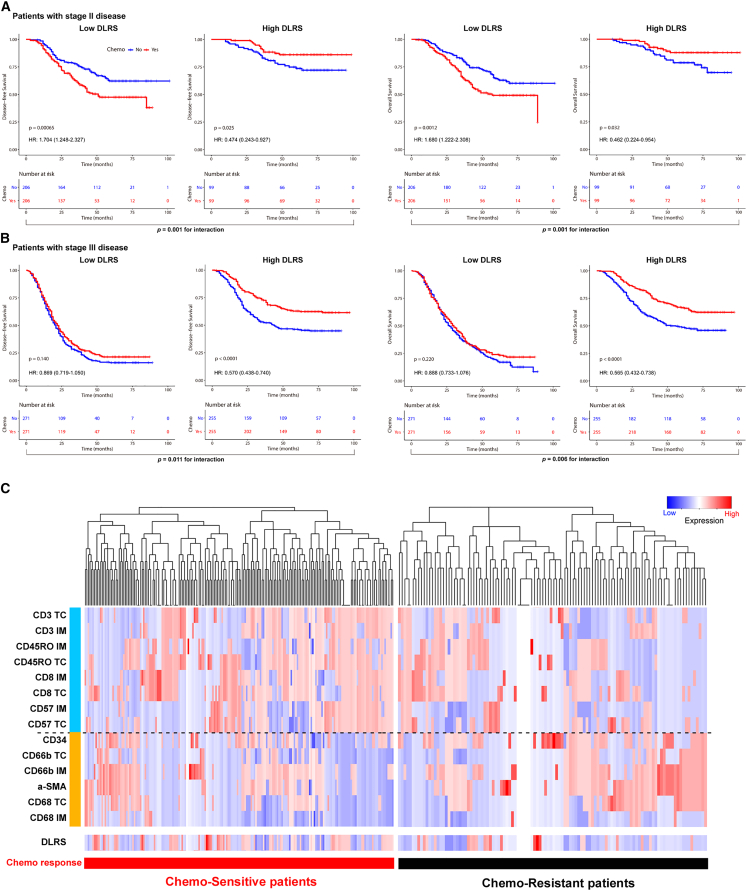
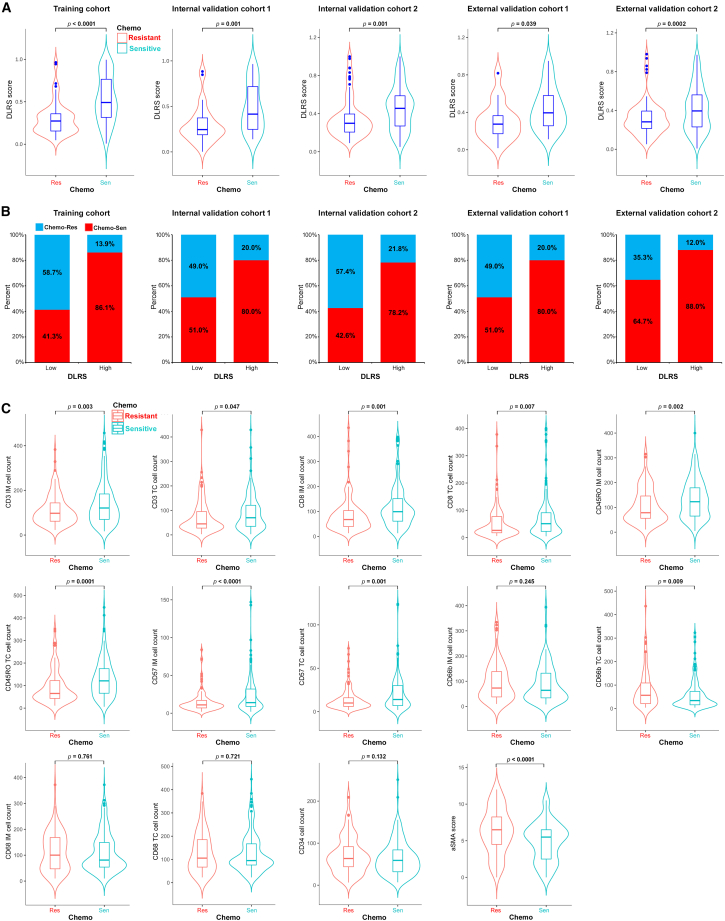
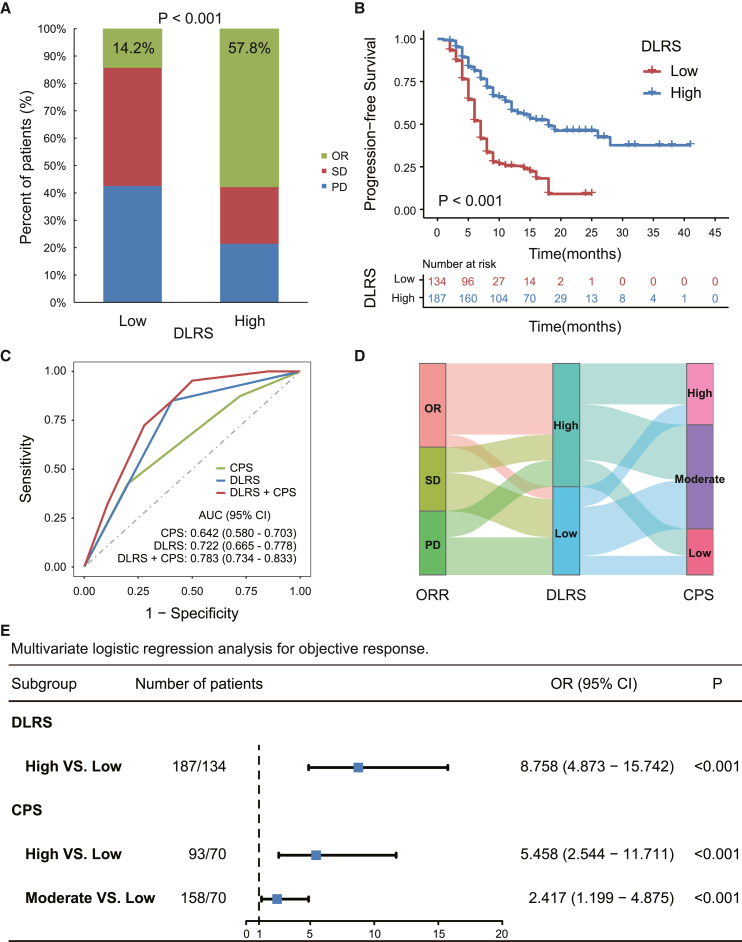
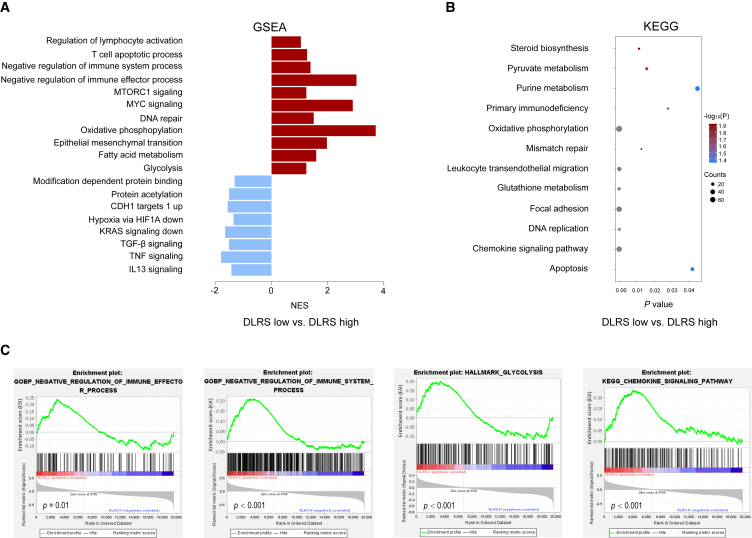
The tumor microenvironment (TME) plays a critical role in disease progression and is a key determinant of therapeutic response in cancer patients. Here, we propose a noninvasive approach to predict the TME status from radiological images by combining radiomics and deep learning analyses. Using multi-institution cohorts of 2,686 patients with gastric cancer, we show that the radiological model accurately predicted the TME status and is an independent prognostic factor beyond clinicopathologic variables. The model further predicts the benefit from adjuvant chemotherapy for patients with localized disease. In patients treated with checkpoint blockade immunotherapy, the model predicts clinical response and further improves predictive accuracy when combined with existing biomarkers. Our approach enables noninvasive assessment of the TME, which opens the door for longitudinal monitoring and tracking response to cancer therapy. Given the routine use of radiologic imaging in oncology, our approach can be extended to many other solid tumor types.

Keywords: CT image; deep learning; gastric cancer; immunotherapy; radiomics; treatment response; tumor microenvironment.


Conflict of interest statement

Declaration of interests The authors declare no competing interests.

Figures

None
Graphical abstract
Figure 1
Figure 1
Study design for the discovery and validation of a deep learning model based on CT images to assess tumor microenvironment and treatment outcomes in gastric cancer Both CT images and IHC stains were available for patients in the SMU-1 (training) cohort and the SMU-2 and SYSUCC-1 (internal and external validation) cohorts, which were used for testing the model’s accuracy for predicting tumor microenvironment status. All patients had CT and treatment outcomes available, which were used for testing the prognostic and predictive value of the model. CT, computed tomography; IHC, immunohistochemistry; SMU, Southern Medical University; SYSUCC, Sun Yat-sen University Cancer Center.
Figure 2
Figure 2
Performance of the deep learning model to assess tumor microenvironment in the training cohort, internal validation cohort 1, and external validation cohort 1 (A) Receiver operator characteristic (ROC) curves. (B) Distributions of DLRS by IHC-defined TME classifier. (C) Performance of the image signature in the training and validation cohorts. (D) Confusion matrices in the training and validation cohorts. The confusion matrices show the pairwise comparison; diagonal: number cases of correctly classified; off-diagonal: number cases of in correctly classified. AUC, area under the curves; TME, tumor microenvironment; DLRS: deep learning radiomics score.
Figure 3
Figure 3
Kaplan-Meier analyses of disease-free survival (DFS) and overall survival (OS) according to the DLRS in patients with gastric cancer (A) Disease-free survival. (B) Overall survival. Training cohort (n = 398), internal validation cohort 1 (n = 196), internal validation cohort 2 (n = 602), external validation cohort 1 (n = 101), and external validation cohort 1 (n = 1,068).
Figure 4
Figure 4
Relationship between the DLRS and DFS in matched patients who were treated with or without adjuvant chemotherapy (A) Stage II (n = 610). (B) Stage III (n = 1,052). Patients were stratified by the receipt of adjuvant chemotherapy. Statistical interaction tests were performed for the following: (left panel) predicted DLRS low vs. high and adjuvant chemotherapy: pinteraction = 0.001 and 0.011 for stage II and stage III; (right panel) predicted DLRS low vs. high and adjuvant chemotherapy: pinteraction = 0.001 and 0.006 for stage II and stage III. (C) Hierarchical tree structure classifying the stage II and III patients who received chemotherapy according to the levels of DLRS and 14 TME features: high expression (red) and low expression (green).
Figure 5
Figure 5
Relationship between the DLRS and chemotherapy response and TME characteristics (A) Violin plot showing DLRS scores in stage II and III patients resistant or sensitive to adjuvant chemotherapy. (B) Rate of clinical response (resistant, sensitive) to adjuvant chemotherapy in high- or low-DLRS score groups. (C) Violin plot showing TME features in stage II and III patients resistant or sensitive to adjuvant chemotherapy.
Figure 6
Figure 6
Relationship between the DLRS and clinical response and outcomes in patients treated with anti-PD-1 immunotherapy (A) Response rates in patients of the DLRS-high vs. -low groups. (B) Progression-free survival in patients of the DLRS high vs. low groups. (C) ROC curves of the predicted TME classes, CPS, and composite models combining TME classes and CPS for predicting immunotherapy response (n = 321); AUC: DLRS vs. CPS, p = 0.04; DLRS+CPS vs. CPS, p < 0.0001; DLRS+CPS vs. DLRS, p < 0.0001. (D) Alluvial diagram of the correspondence among patients classified according to the immunotherapy response, DLRS, and CPS in the merged immunotherapy cohorts (n = 321). (E) Forest plot for the multivariate logistic regression analysis for objective response. AUC, area under the receiver operator characteristic curve; CPS, combined positive score of PDL1 expression; OR, objective response (complete and partial response); SD, stable disease; PD, progressive disease.
Figure 7
Figure 7
Molecular correlates of the DLRS in gastric cancer (A) Bar plot shows the top enriched molecular pathways by normalized enrichment score (NES) in the DLRS-high group (blue) and the DLRS-low group (red). A positive NES score indicates the pathway is significantly enriched in the DLRS-low group, and a negative NES indicates the pathway is significantly enriched in the DLRS-high group. (B) Bubble plot shows the top enriched pathways by gene counts along with p values. (C) Examples of the enrichment plot for the molecular pathways significantly associated with the DLRS.

References

    1. Bray F., Ferlay J., Soerjomataram I., Siegel R.L., Torre L.A., Jemal A. Global cancer statistics 2018: GLOBOCAN estimates of incidence and mortality worldwide for 36 cancers in 185 countries. CA A Cancer J. Clin. 2018;68:394–424. - PubMed
    1. Jiang Y., Li T., Liang X., Hu Y., Huang L., Liao Z., Zhao L., Han Z., Zhu S., Wang M., et al. Association of Adjuvant Chemotherapy With Survival in Patients With Stage II or III Gastric Cancer. JAMA Surg. 2017;152 - PMC - PubMed
    1. Jiang Y., Zhang Q., Hu Y., Li T., Yu J., Zhao L., Ye G., Deng H., Mou T., Cai S., et al. ImmunoScore Signature: A Prognostic and Predictive Tool in Gastric Cancer. Ann. Surg. 2018;267:504–513. - PubMed
    1. Fridman W.H., Pagès F., Sautès-Fridman C., Galon J. The immune contexture in human tumours: impact on clinical outcome. Nat. Rev. Cancer. 2012;12:298–306. - PubMed
    1. Becht E., de Reyniès A., Giraldo N.A., Pilati C., Buttard B., Lacroix L., Selves J., Sautès-Fridman C., Laurent-Puig P., Fridman W.H. Immune and Stromal Classification of Colorectal Cancer Is Associated with Molecular Subtypes and Relevant for Precision Immunotherapy. Clin. Cancer Res. 2016;22:4057–4066. - PubMed

Publication types