. 2023 Sep;621(7979):610-619.
doi: 10.1038/s41586-023-06515-5. Epub 2023 Aug 9.

R-loop-dependent promoter-proximal termination ensures genome stability

Affiliations

R-loop-dependent promoter-proximal termination ensures genome stability

Congling Xu et al. Nature. 2023 Sep.

Erratum in

Abstract

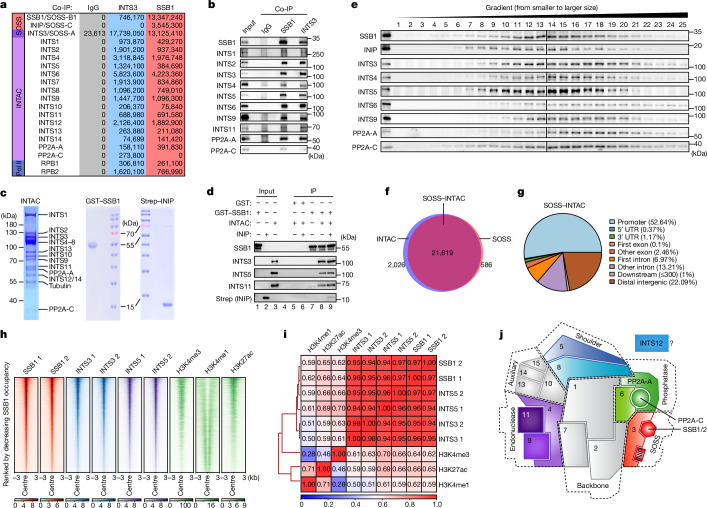
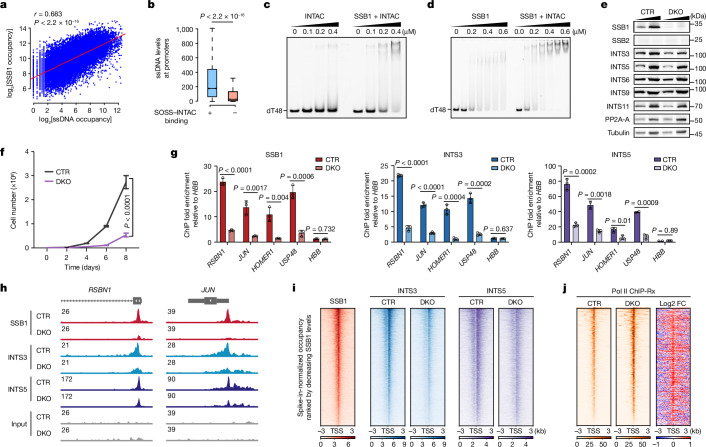
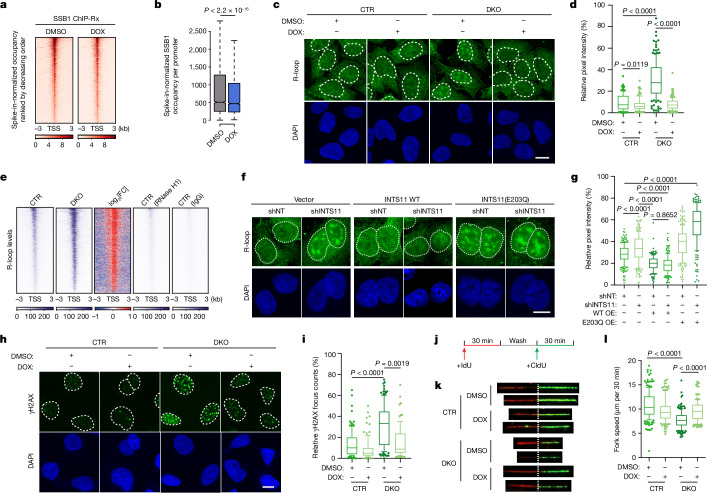
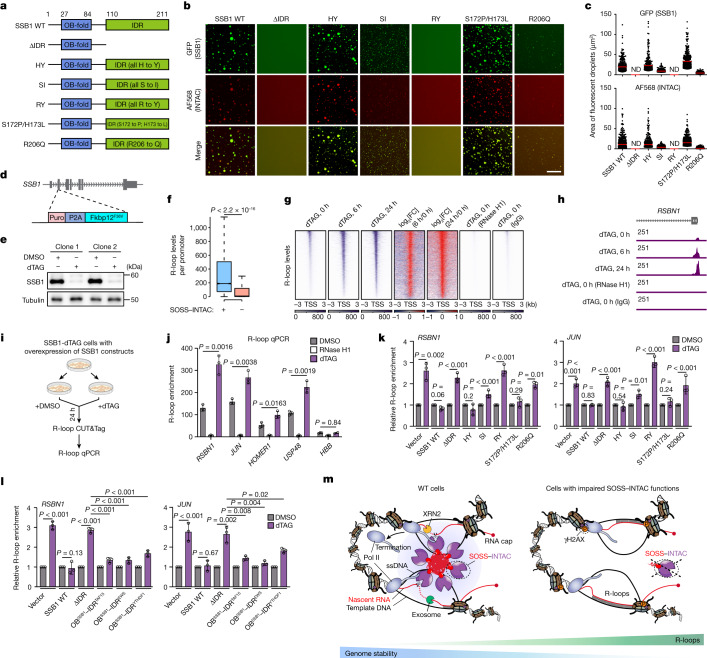
The proper regulation of transcription is essential for maintaining genome integrity and executing other downstream cellular functions1,2. Here we identify a stable association between the genome-stability regulator sensor of single-stranded DNA (SOSS)3 and the transcription regulator Integrator-PP2A (INTAC)4-6. Through SSB1-mediated recognition of single-stranded DNA, SOSS-INTAC stimulates promoter-proximal termination of transcription and attenuates R-loops associated with paused RNA polymerase II to prevent R-loop-induced genome instability. SOSS-INTAC-dependent attenuation of R-loops is enhanced by the ability of SSB1 to form liquid-like condensates. Deletion of NABP2 (encoding SSB1) or introduction of cancer-associated mutations into its intrinsically disordered region leads to a pervasive accumulation of R-loops, highlighting a genome surveillance function of SOSS-INTAC that enables timely termination of transcription at promoters to constrain R-loop accumulation and ensure genome stability.


Conflict of interest statement

The authors declare no competing interests.

Figures

Fig. 1
Fig. 1. Identification and genome-wide profiling of the SOSS–INTAC complex.
a, Mass spectrometry analyses of endogenous INTS3 and SSB1 IP using nuclear extracts. The values are intensity-based absolute quantification intensities for SOSS, INTAC and Pol II subunits. IgG was used as the binding control. b, Co-IP analysis of endogenous SSB1 and INTS3 followed by western blotting. Data represent two independent experiments. c, Coomassie staining of reconstituted human INTAC complex purified from HEK Expi293 cells, and GST-tagged human SSB1 and Strep-tagged human INIP proteins purified from E. coli. d, Immobilized GST or GST–SSB1 were incubated with purified INTAC in the presence or absence of INIP. The input and bound proteins were analysed by western blotting. Data represent two independent experiments. e, Gradient centrifugation using endogenous HEK Expi293 nuclear extracts. The fractionated samples were analysed using SDS–PAGE followed by western blotting. Data shown represent two independent experiments. f, The overlapping binding regions of INTAC (blue) and SOSS (red) in DLD-1 cells. g, The genomic distribution of SOSS–INTAC. h, ChIP–seq signals of SSB1, INTS3, INTS5, H3K4me3, H3K4me1 and H3K27ac in DLD-1 cells. The peaks are centred on the SSB1 peak summits. i, Correlation analysis for the genomic occupancy of SSB1, INTS3, INTS5, H3K27ac, H3K4me3 and H3K4me1. The numbers are Pearson correlation coefficients. The ChIP–seq results shown represent two biologically independent samples. j, Schematic of the SOSS–INTAC complex. On the basis of structural and biochemical information,,,,, the complex can be divided into six modules, including the backbone (INTS1, INTS2 and INTS7), shoulder (INTS5 and INTS8), endonuclease (INTS4, INTS9 and INTS11), phosphatase (INTS6, PP2A-A and PP2A-C), auxiliary (INTS10/13/14/15) and SOSS (INTS3, SSB1/2, INIP) modules. The structural organization of the backbone, shoulder, endonuclease and phosphatase modules is illustrated on the basis of the structure of INTAC. The organization of the SOSS module was placed according to the structures of SOSS and INTS3/6. The organization of the auxiliary module was estimated on the basis of structural and biochemical information of INTS10/13/14. The structural placement of INTS12 is currently unclear.
Fig. 2
Fig. 2. SSB1 facilitates SOSS–INTAC recruitment to chromatin.
a, The correlation between ssDNA and SSB1 levels at SOSS–INTAC-bound regions in DLD-1 cells. P values were computed using two-sided t-tests with 95% confidence intervals based on the Pearson’s product moment correlation coefficient. P < 2.2 × 10−16. n = 29,128 peaks. b, ssDNA levels at promoters with or without SOSS–INTAC binding. For the box plots, the centre line indicates the median, the top and bottom hinges indicate the first and third quartiles, respectively, and the whiskers extend to the quartiles ± 1.5 × interquartile range. P values were calculated using two-sided Wilcoxon rank-sum tests. P < 2.2 × 10−16. c,d, EMSA using Cy3-labelled oligo (dT)48 incubated with INTAC alone (left) or with SSB1–INTAC proteins (right) (c), or with SSB1 alone (left) or with SSB1–INTAC proteins (right) (d). Data represent two independent experiments. e, Western blot analysis of whole-cell extracts from CTR (control, NABP1 knockout) and DKO (NABP2/NABP1 double-knockout) DLD-1 cells. Tubulin was used as the loading control. Data represent two independent experiments. f, Growth curves of CTR and DKO DLD-1 cells. Data are mean ± s.d. n = 4 biological replicates. P values were generated using two-way analysis of variance (ANOVA) performed for day 8. g, ChIP–qPCR experiments using SSB1 (red), INTS3 (blue) and INTS5 (purple) antibodies in CTR and DKO cells. Data are mean ± s.d. n = 3 biological replicates. Statistical analysis was performed using two-tailed t-tests. P values are shown at the top of the graphs. h, Representative browser tracks showing ChIP–Rx signals of SSB1 (red), INTS3 (blue) and INTS5 (purple) in CTR and DKO cells. i, ChIP–Rx signals of SSB1, INTS3, INTS5 in CTR or DKO cells. Peaks are centred on transcription start site (TSS) of SOSS–INTAC-bound genes. j, Pol II ChIP–Rx signals on SOSS–INTAC target genes in CTR and DKO cells. Peaks are centred on the TSS and ranked by decreasing occupancy in CTR cells. FC, fold change.
Fig. 3
Fig. 3. SOSS–INTAC regulates R-loop levels.
a, SSB1 occupancy over 6 kb regions centred on the TSS of SOSS–INTAC target genes in DLD-1 cells with DOX-inducible RNase H1 expression. b, Comparison of SSB1 occupancy at SOSS–INTAC target promoters for DMSO- and DOX-treated cells. For the box plots, the centre line indicates the median, the top and bottom hinges indicate the first and third quartiles, respectively, and the whiskers extend to the quartiles ± 1.5 × interquartile range. P values were calculated using two-sided Wilcoxon rank-sum tests. P < 2.2 × 10−16. n = 10,650 promoters. c, R-loop detection in CTR and DKO cells with DOX-inducible GFP–RNASEH1 expression. Scale bar, 10 μm. d, Quantification of nuclear R-loop signals for c. P values were calculated using two-tailed unpaired t-tests. n = 110 foci from one representative experiment, which was performed twice with similar results. The centre lines indicate the median values. e, R-loop CUT&Tag signals over 6 kb regions centred on the TSS of SOSS–INTAC target genes in CTR and DKO cells. CTR cells were treated with RNase H1 protein during CUT&Tag (lane 4) or incubated with IgG (lane 5) to confirm the specificity of detected R-loop signals. f, Immunofluorescence analysis of R-loop signals in DLD-1 cells with INTS11 or non-targeting (NT) shRNA and overexpression of wild-type (WT) or catalytically dead (E203Q) INTS11 and empty vector control. Scale bar, 10 μm. g, Quantification of the nuclear R-loop signals for f. Statistical analysis was performed using two-tailed unpaired t-tests; P values are shown above the graphs. n = 180 foci from one representative experiment, which was performed twice with similar results. The centre lines indicate the median values. h, Immunostaining of γH2AX signals in CTR and DKO cells with DOX-inducible RNase H1 expression. Scale bar, 10 μm. i, Quantification of the γH2AX focus number in h. Statistical analysis was performed using two-tailed unpaired t-tests; P values are shown above the graphs. n = 90 foci from one representative experiment, which was performed twice with similar results. The centre lines indicate the median values. j, Schematic of the DNA fibre assay. Cells were sequentially pulsed with two different thymidine analogues—IdU and CIdU. k, Representative images of stretched DNA fibres. CTR and DKO cells with DOX-inducible RNase H1 expression were treated with DMSO or DOX as indicated. Red tracks, IdU; green tracks, CIdU. l, Replication fork speed was measured by IdU (red) and CIdU (green) incorporation. P values were determined using two-tailed unpaired t-tests. n = 160 fibres were measured for each group.
Fig. 4
Fig. 4. SSB1 drives the formation of SOSS–INTAC condensates.
a, Quantification of purified INTAC (all subunits) and SSB1–INTAC distribution after sucrose density-gradient centrifugation and western blotting. Five subunits were used for quantification (INTS5, INTS6, INTS11, PP2A-A and PP2A-C). b, The domain structure and the intrinsically disordered tendency of E. coli SSB (left) and human SSB1 (right). IUPred assigned scores of disordered tendencies between 0 and 1 to the sequences, and a score of higher than 0.5 indicates disorder. c, Representative images showing the relative locations of endogenous SSB1 and INTAC subunits along with the DAPI signal in DLD-1 cells. Representative curves (right) describe the distribution of relative fluorescence intensities for SSB1 (red) and INTAC subunits (green). Data represent two independent experiments. d,e, GFP–SSB1 (50 μM) was analysed using droplet formation assays with the indicated concentrations of NaCl (d), and the size of the droplets was quantified (e). Each dot represents a droplet. n = 100 foci from one representative experiment, which was performed twice with similar results. The red lines indicate the mean value in each population. f, NaCl concentrations in the GFP–SSB1 solution were changed sequentially as indicated and then examined under a fluorescence microscope. g,h, 1,6-Hex (5%) treatment disrupts droplet formation. GFP–SSB1 (50 μM) was analysed with 37.5 mM NaCl with or without 5% 1,6-Hex (g), and the size of droplets was quantified (h). Each dot represents a droplet. The red lines indicate the mean value in each population. i, Time-lapse imaging of GFP–SSB1 droplets undergoing spontaneous fusions as indicated by the arrows. j, Representative micrographs of GFP–SSB1 droplets before and after photobleaching (top). FRAP quantification of GFP–SSB1 droplets over a period of 100 s (bottom). n = 3 droplets analysed from 1 representative experiment, which was performed 3 times with similar results. k, GFP–SSB1 and Alexa Fluor 568 (AF568)-labelled INTAC (all subunits), either individually or mixed together as indicated, were analysed using a droplet formation assay and then examined under a fluorescence microscope. Scale bars, 5 μm (c, i and j), 20 μm (d, f and g) and 50 μm (k).
Fig. 5
Fig. 5. SOSS–INTAC condensation regulates R-loop levels.
a, Schematic of the SSB1 domains and SSB1 mutants. OB-fold, oligonucleotide/oligosaccharide-binding fold. b,c, Fluorescence microscopy analysis of purified GFP–SSB1 mutants mixed with Alexa-Fluor-568-labelled INTAC (all subunits) (b), and quantification of the GFP and Alexa Fluor 568 signal (c). n = 1,500 foci were analysed across two independent experiments. The red lines indicate the mean values. Scale bars, 50 μm (b). ND, not detected. d,e, Schematic of the generation of SSB1-dTAG DLD-1 cells (d) and verification of SSB1 degradation by treatment for 6 h with dTAG (100 nM) (e). f, The R-loop levels at promoters with or without SOSS–INTAC binding measured by R-loop CUT&Tag under the DMSO-treated condition in SSB1-dTAG cells. For the box plots, the centre line indicates the median, the top and bottom hinges indicate the first and third quartiles, respectively, and the whiskers extend to the quartiles ± 1.5 × interquartile range. P values were calculated using two-sided Wilcoxon rank-sum tests. g, R-loop CUT&Tag signals over 6 kb regions centred on the TSS of SOSS–INTAC target genes in SSB1-dTAG cells with dTAG time-course treatment. One sample was treated with RNase H1 protein during CUT&Tag to verify the specificity of R-loop signals. h, Representative browser tracks showing the R-loop signals in SSB1-dTAG cells with time-course dTAG treatment. i, Schematic of the R-loop CUT&Tag–qPCR workflow. j, R-loop CUT&Tag–qPCR analysis of example genes in SSB1-dTAG DLD-1 cells after 24 h treatment of DMSO or dTAG. The RNase H1 control was as shown in h. Data are mean ± s.d. n = 3 biological replicates. Statistical analysis was performed using two-tailed unpaired t-tests; P values are shown above the graphs. k, R-loop CUT&Tag–qPCR analysis of DMSO- or dTAG-treated SSB1-dTAG cells with overexpression of wild-type, mutant SSB1 or empty vector. Data are mean ± s.d. n = 3 biological replicates. Statistical analysis was performed using two-tailed unpaired t-tests; P values are shown above the graphs. l, R-loop CUT&Tag–qPCR analysis of DMSO- or dTAG-treated SSB1-dTAG cells with overexpression of wild-type SSB1 or fusion proteins comprising the N terminus of SSB1 and IDR from TAF15, EWS or YTHDF1. Data are mean ± s.d. n = 3 biological replicates. Statistical analysis was performed using two-tailed unpaired t-tests; P values are shown above the graphs. m, Working model demonstrating the proposed mechanism by which SOSS–INTAC attenuates R-loop accumulation and maintains genome stability. In wild-type cells, the SSB1 subunit of SOSS interacts with ssDNA to recruit SOSS–INTAC to promoters and drives condensate formation. RNA cleavage by SOSS–INTAC condensates permits RNA degradation by a combination of XRN2 and exosome activities, leading to premature promoter-proximal termination by RNA Pol II and R-loop attenuation. Cancer-associated mutations of SSB1 that impair condensation and disrupt SOSS–INTAC recruitment lead to the loss of premature promoter-proximal Pol II termination and aberrant accumulation of R-loops, with potential adverse consequences, such as DNA damage.
Extended Data Fig. 1
Extended Data Fig. 1. Biochemical and genomic analyses of the SOSS–INTAC complex.
(a-b) Schematic of the INTAC (a) and SOSS (b) complexes. (c) Mass spectrometry analyses of Protein A-tagged SSB1, SSB2 and INIP immunoprecipitation (IP) in DLD-1 cells. The values are intensity-based absolute quantification intensity for SOSS and INTAC subunits. (d) Flag IP in cells with overexpression of Flag-tagged INIP followed by western blotting in DLD-1 cells. IgG was used as the binding control. Data represent two independent experiments. (e) Immobilized GST or GST–SSB1 were incubated with purified INTAC in the presence or absence of INIP. The input and bound proteins were analysed by Coomassie blue staining. (f) Gradient centrifugation using nuclear extracts of HEK Expi293 cells with overexpression of SSB1 and all INTAC subunits. The fractionated samples were examined by SDS–PAGE followed by western blotting. Data represent two independent experiments. (g) Venn diagram showing the overlapping binding regions of INTS3 (blue), INTS5 (purple) and SSB1 (red) peaks in DLD-1 cells. (h) Genomic distribution of INTAC alone. (i) Heatmaps of occupancy of SSB1, INTS3, INTS5, H3K4me3, H3K4me1 and H3K27ac over 6 kb regions centred on the SOSS–INTAC peak summits divided into promoter and enhancer regions. (j) ChIP–qPCR experiments using SSB1 (red), INTS3 (blue) and INTS5 (purple) antibodies in DLD-1 cells. Due to the lack of a suitable INIP antibody for IP, Flag ChIP–qPCR was conducted in DLD-1 cells with overexpression of Flag-tagged INIP. n = 3 biological replicates.
Extended Data Fig. 2
Extended Data Fig. 2. SsDNA binding, expression pattern and functional redundancy of SSB1 and SSB2.
(a) EMSA assays using Cy3-labelled ssDNA, dsDNA and ssRNA incubated with SSB1. Data represent two independent experiments. (b) Representative browser tracks showing KAS–seq signals compared with the genomic occupancy of SOSS–INTAC subunits in DLD-1 cells. (c-d) Correlation between ssDNA levels and SSB1 occupancy over SOSS–INTAC-bound promoters (c, P < 2.2e-16, n = 11,373 peaks) and enhancers (d, P < 2.2e-16, n = 10,246 peaks). P values were computed using two-sided t-test with 95% confidence interval based on Pearson’s product moment correlation coefficient. Data represent two independent experiments. (e-f) The expression of SSB1 (e) and SSB2 (f) across tissues using GTEx database. (g) Growth curves of parental and CTR DLD-1 cells. Data are mean ± SD from 4 independent experiments. (h) Western blotting of whole-cell extracts from parental and CTR DLD-1 cells. Tubulin is a loading control. Data represent two independent experiments. (i) ChIP–qPCR experiments using SSB1 (red), INTS3 (blue) and INTS5 (purple) antibodies in parental and CTR DLD-1 cells. Values are mean ± SD (n = 3 biological replicates). (j) Growth curves of CTR and DKO cells with or without overexpression of SSB1 or SSB2. Data are mean ± SD from 4 independent experiments.
Extended Data Fig. 3
Extended Data Fig. 3. SSB1 facilitates SOSS–INTAC recruitment to induce promoter-proximal termination.
(a) Representative browser tracks showing the ChIP–Rx signals of SSB1 (red), INTS3 (blue) and INTS5 (purple) in CTR and DKO cells. (b-c) Boxplots showing the comparison of INTS3 (b) and INTS5 (c) signals at SOSS–INTAC target promoters between CTR and DKO cells. In boxplots, the centre line is the median, the top and bottom hinges correspond to the first and third quartiles, respectively, whiskers extend to quartiles ± 1.5 × interquartile range. P values were calculated using two-sided Wilcoxon rank-sum tests. P < 2.2e-16, n = 10,650 promoters. (d-e) Metaplots of INTS3 (d) and INTS5 (e) signals over 6 kb regions centred on TSS of SOSS-INTAC target genes in CTR and DKO cells. (f) EMSA assays using Cy3-labelled oligo (dT)48 incubated with purified wild-type SSB1, W55A/F78A (the mutant defective in binding ssDNA), or E97A/F98A (the mutant defective in interacting with INTS3). Data represent two independent experiments. (g) V5 Co-IP in cells overexpressed with V5-tagged wild-type SSB1, W55A/F78A, or E97A/F98A. Data represent two independent experiments. (h) ChIP–qPCR of SSB1, INTS3 and INTS5 in CTR and DKO cells with overexpression of wild-type SSB1, W55A/F78A, or E97A/F98A. Values are mean ± SD. n = 3 biological replicates. (i) Representative browser tracks showing the ChIP–Rx signals of Pol II in CTR and DKO cells. (j) Heatmaps of Pol II ChIP–Rx signals on SOSS–INTAC target genes in DLD-1 cells with control sgRNA (sgCtr) and sgRNA targeting INTS2 (INTS2-KO). The peaks are centred on TSS and ranked by decreasing occupancy in sgCtr cells. (k-l) Heatmaps of PRO–seq signals for sense (k) and antisense (l) transcripts over 400 bp regions centred on TSS of SOSS–INTAC target genes ranked by decreasing occupancy in CTR cells. (m) Boxplots showing the comparison of sense and antisense transcription levels at SOSS–INTAC-bound promoters between CTR and DKO cells. In boxplots, the centre line is the median, the top and bottom hinges correspond to the first and third quartiles, respectively, whiskers extend to quartiles ± 1.5 × interquartile range. P values were calculated using two-sided Wilcoxon rank-sum tests. P < 2.2e-16, n = 6,860 promoters for sense transcription and P < 2.2e-16, n = 5,767 promoters for antisense transcription. (n) Heatmaps showing the occupancy of Pol II phosphorylated at CTD Serine 5 (pSer5) on SOSS–INTAC target genes in CTR and DKO cells. The peaks are centred on TSS and ranked by decreasing occupancy in CTR cells. (o) Heatmaps of ATAC–seq signals on SOSS–INTAC target genes in CTR and DKO cells. The peaks are centred on TSS and ranked by decreasing occupancy in CTR cells. (p) Boxplots showing the comparison of ATAC–seq signals at SOSS–INTAC target promoters between CTR and DKO cells. In boxplots, the centre line is the median, the top and bottom hinges correspond to the first and third quartiles, respectively, whiskers extend to quartiles ± 1.5 × interquartile range. P values were calculated using two-sided Wilcoxon rank-sum tests. P < 2.2e-16, n = 10,650 promoters. (q) Representative browser tracks showing the ATAC–seq signals in CTR and DKO cells.
Extended Data Fig. 4
Extended Data Fig. 4. SOSS–INTAC recognizes R-loops.
(a) Western blotting of whole-cell extracts from DOX-inducible Flag-RNase H1 DLD-1 cells treated with DMSO or DOX. Data represent two independent experiments. (b) Representative browser tracks showing the SSB1 ChIP–Rx signals in DMSO- and DOX-treated cells with DOX-inducible RNase H1 expression. (c) SSB1 ChIP–qPCR on promoters of example genes in cells with DOX-inducible RNase H1 expression. Values are mean ± SD. n = 3 biological replicates. Statistical analysis was performed using two-tailed t-tests. P values are shown at the top of the graphs. (d) Schematic presentation of the workflow of R-loop CUT&Tag experiments. (e) R-loop CUT&Tag–qPCR in cells with DOX-inducible RNase H1 expression. DMSO-treated cells were incubated with IgG but not S9.6 (3rd lane) or treated with RNase H1 during CUT&Tag (4th lane) to confirm the specificity of detected R-loop signals. Values are mean ± SD. n = 3 biological replicates. Statistical analysis was performed using two-tailed t-tests. P values are shown at the top of the graphs. (f) Metaplots of SSB1 signals over 6 kb regions centred on TSS of SOSS–INTAC target genes in DMSO- and DOX-treated DLD-1 cells with inducible RNase H1 expression. (g) Representative browser tracks showing the INTS3 ChIP–Rx signals in DMSO- and DOX-treated DLD-1 cells with DOX-inducible RNase H1 expression. (h) INTS3 ChIP–qPCR on promoters of example genes in cells with DOX-inducible RNase H1 expression. Values are mean ± SD. n = 3 biological replicates. Statistical analysis was performed using two-tailed t-tests. P values are shown at the top of the graphs. (i) Heatmaps showing INTS3 signals over 6 kb regions centred on TSS of SOSS–INTAC target genes in DMSO- and DOX-treated cells with DOX-inducible RNase H1 expression. (j) Boxplots of INTS3 signals at promoters of SOSS–INTAC target genes in DMSO- and DOX-treated cells with DOX-inducible RNase H1 expression. In boxplots, the centre line is the median, the top and bottom hinges correspond to the first and third quartiles, respectively, whiskers extend to quartiles ± 1.5 × interquartile range. P values were calculated using two-sided Wilcoxon rank-sum tests. P < 2.2e-16, n = 10,650 promoters. (k) Metaplot of INTS3 signals over 6 kb regions centred on TSS of SOSS–INTAC target genes in DMSO- and DOX-treated cells with DOX-inducible RNase H1 expression.
Extended Data Fig. 5
Extended Data Fig. 5. SOSS–INTAC regulates cellular R-loop levels.
(a-b) IF of S9.6-based R-loop detection in CTR and DKO cells with DOX-inducible RNase H1 expression (a) and the quantification of the nuclear R-loop signals (b). Statistical analyses were performed using two-tailed unpaired t-test (n = 120 foci from one representative experiment, which has been performed twice with similar results). P values are shown at the top of the graphs. (c–d) IF of S9.6-based R-loop detection in sgCtr and INTS2-KO DLD-1 cells with DOX-inducible RNase H1 expression (c) and the quantification of the nuclear R-loop signals. Statistical analyses were performed using two-tailed unpaired t-test (n = 120 foci from one representative experiment, which has been performed twice with similar results). P values are shown at the top of the graphs. (e) Boxplots of R-loop signals at promoters of SOSS–INTAC target genes in CTR and DKO cells. CTR cells were treated with RNase H1 protein during CUT&Tag (4th lane) or incubated with IgG but not S9.6 (5th lane) to confirm the specificity of detected R-loop signals. In boxplots, the centre line is the median, the top and bottom hinges correspond to the first and third quartiles, respectively, whiskers extend to quartiles ± 1.5 × interquartile range. P values were calculated using two-sided Wilcoxon rank-sum tests. P < 2.2e-16, n = 10,650 promoters for all comparisons. (f) Representative browser tracks showing the R-loop signals in CTR and DKO cells. (g) R-loop CUT&Tag–qPCR on example genes in CTR or DKO cells. Values are mean ± SD. n = 3 biological replicates. Statistical analysis was performed using two-tailed t-tests. P values are shown at the top of the graphs. (h-i) GFP–dRNASEH1-based IF of R-loops in sgCtr and INTS2-KO DLD-1 cells with DOX-inducible RNase H1 expression (h) and the quantification of the nuclear R-loop signals. Statistical analyses were performed using two-tailed unpaired t-test (n = 110 foci from one representative experiment, which has been performed twice with similar results). P values are shown at the top of the graphs. (j) Western blotting showing INTS11 knockdown efficiency in DLD-1 cells. (k) Western blotting showing the overexpression of wild-type or catalytic-dead (E203Q) INTS11 in DLD-1 cells. (l) Heatmaps of R-loop CUT&Tag signals over 6 kb regions centred on TSS of SOSS–INTAC target genes in DLD-1 cells with INTS11 knockdown and overexpression of wild-type or E203Q INTS11. (m) R-loop CUT&Tag–qPCR on example genes in CTR or DKO cells overexpressed with empty vector, wild-type SSB1 or E97A/F98A, the mutant defective in interacting with INTS3. Values are mean ± SD. n = 3 biological replicates. Statistical analysis was performed using two-tailed t-tests. P values are shown at the top of the graphs.
Extended Data Fig. 6
Extended Data Fig. 6. Cooperation of SOSS–INTAC and RNA exonucleases.
(a-b) Quantitative reverse transcription PCR (RT–qPCR) (a) and western blotting (b) to determine the knockdown efficiency of XRN2, DIS3, EXOSC10, and MTR4 in DLD-1 cells. n = 3 biological replicates. Statistical analysis was performed using two-tailed t-tests. P values are shown at the top of the graphs. (c) R-loop CUT&Tag in CTR and DKO cells with knockdown of XRN2, DIS3, EXSOC10, and MTR4. Values are mean ± SD (n = 3 biological replicates). (d) Heatmaps showing the occupancy of XRN2, DIS3, EXOSC10, and MTR4 in CTR and DKO cells. (e) Heatmaps showing γH2AX occupancy in CTR and DKO cells. The peaks were centred on TSS of SOSS–INTAC target genes. (f-g) Immunostaining of γH2AX signal in sgCtr and INTS2-KO DLD-1 cells with DOX-inducible RNase H1 expression (f) and the quantification of the nuclear γH2AX foci number (g). Statistical analyses were performed using two-tailed unpaired t-test (n = 180 foci from one representative experiment, which has been performed twice with similar results). P values are shown at the top of the graphs. (h) Heatmaps showing γH2AX occupancy in sgCtr and INTS2-KO cells. The peaks were centred on TSS of SOSS–INTAC target genes. (i) Flow cytometry analysis following propidium iodide labelling and γH2AX staining in CTR and DKO cells. Propidium iodide signal was used to separate cells into G1, S, and G2/M phases. Values are mean ± SD (n = 3 biological replicates). Statistical analysis was performed using two-tailed t-tests. P values are shown at the top of the graphs.
Extended Data Fig. 7
Extended Data Fig. 7. Disordered tendency prediction of SOSS–INTAC and its punctum formation in cells.
(a) Gradient centrifugation using purified INTAC from HEK Expi293 cells with overexpression of all INTAC subunits. The fractionated samples were examined by SDS–PAGE followed by western blotting. Data shown represent two independent experiments. (b) Intrinsically disordered tendency of all INTAC subunits. IUPred assigned scores of disordered tendencies between 0 and 1 to the sequences, and a score of more than 0.5 indicates disorder. (c) The immunofluorescent images of SSB1 (red) and INTAC subunits (green) in wild-type and DKO cells (left) and the quantification of the relative foci counts (right, n = 150 foci from one representative experiment, which has been performed twice with similar results). Statistical analysis was performed using two-tailed t-tests. P values are shown at the top of the graphs. (d) The immunofluorescent images of SSB1 (red) and INTS11 (green) in DMSO- or dTAG-treated INTS11-dTAG DLD-1 cells (left) and the quantification of the relative foci counts (right, n = 150 foci from one representative experiment, which has been performed twice with similar results). Statistical analysis was performed using two-tailed t-tests. P values are shown at the top of the graphs.
Extended Data Fig. 8
Extended Data Fig. 8. Analysis of condensate formation capacity of SSB1 and SOSS–INTAC.
(a-b) GFP–SSB1 was analysed using droplet formation assays with indicated concentration at 37.5 mM NaCl (a) and the quantification of the size of droplets (b). Red lines indicate the mean in each population (n = 500 foci analysed across two independent experiments). (c) The establishment of the “optoDroplet” system by fusing SSB1 with mCherry-labelled Arabidopsis photoreceptor cryptochrome 2 (CRY2) in Hela cells. Representative images of SSB1–mCherry–CRY2 and empty mCherry–CRY2 vector were shown before and after light induction. (d-e) Time-lapse imaging demonstrating spontaneous fusions (d) and fissions (e), as indicated by the arrows, of SSB1 condensates in cells. (f) Representative micrographs of SSB1 puncta before and after photobleaching. (g-h) Quantification of the relative intensity of Alx568 (g) and GFP (h) per droplet for Alx568-labelled INTAC, GFP–SSB1, and the mixture of Alx568-labelled INTAC and GFP–SSB1. Red lines indicate the mean in each group (n = 500 foci analysed across two independent experiments). ND, not detected. (i-j) Different concentrations of GFP–SSB1 were mixed with Alx568-labelled INTAC and analysed using the droplet formation assay (i), followed by the quantification of the relative GFP intensity per droplet (j). Red lines indicate the mean in each group (n = 300 foci analysed across two independent experiments). (k) Recombinant wild-type or mutant GFP–SSB1 were purified from E. coli. Each protein was examined by SDS–PAGE followed by Coomassie blue staining. (l-m) Fluorescence microscopy images of purified GFP–SSB1 mutants (l). Quantification of the scale per GFP droplets is shown in (m). Red lines indicate the mean in each group. ND, not detected. (n) Analysis of amino acid enrichment for SSB1 IDR by Composition Profiler. The full-length SSB1 is used as background. (o) Diagram summarizing the mutated residues of the indicated SSB1 mutants. (p) Mutation information of SSB1/NABP2 in the COSMIC reference database. (q) EMSA assays using Cy3-labelled oligo (dT)48 incubated with wild-type SSB1, SSB1 (S172P/H173L), or SSB1 (R206Q). Data represent two independent experiments. (r) V5 Co-IP in cells overexpressed with V5-tagged wild-type SSB1, SSB1(S172P/H173L), or SSB1(R206Q) followed by western blotting of SOSS–INTAC subunits. Data represent two independent experiments.
Extended Data Fig. 9
Extended Data Fig. 9. Dynamic regulation of R-loops by SOSS–INTAC and its puncta formation in cells.
(a) Western blotting of SSB1-dTAG DLD-1 cells with time-course treatment of dTAG. Data represent two independent experiments. (b-c) Immunostaining of R-loop signals in SSB1-dTAG DLD-1 cells with time-course dTAG treatment (b). Quantification of the nuclear R-loop signals is shown in (c). Statistical analyses were performed using two-tailed unpaired t-test (n = 150 foci from one representative experiment, which has been performed twice with similar results). Statistical analysis was performed using two-tailed t-tests. P values are shown at the top of the graphs. (d-e) Immunostaining of γH2AX signal in SSB1-dTAG DLD-1 cells with time-course dTAG treatment (d). Quantification of the nuclear γH2AX foci number is shown in (e). Statistical analyses were performed using two-tailed unpaired t-test (n = 150 foci from one representative experiment, which has been performed twice with similar results). Statistical analysis was performed using two-tailed t-tests. P values are shown at the top of the graphs. (f) Boxplots of R-loop CUT&Tag signals at promoters of SOSS–INTAC target genes in SSB1-dTAG cells with time-course dTAG treatment. One sample was treated with RNase H1 protein (4th lane) or incubated with IgG but not S9.6 (5th lane) during CUT&Tag to verify the specificity of R-loop signals. In boxplots, the centre line is the median, the top and bottom hinges correspond to the first and third quartiles, respectively, whiskers extend to quartiles ± 1.5 × interquartile range. P values were calculated using two-sided Wilcoxon rank-sum tests. P values are shown at the top of the graphs, n = 10,650 promoters for all comparisons. (g) Representative browser tracks showing the R-loop signals in DMSO- or dTAG-treated SSB1-dTAG cells. (h) DMSO- or dTAG-treated SSB1-dTAG cells were overexpressed with wild-type or mutant SSB1 and analysed by western blotting. Data represent two independent experiments. (i-j) Representative images of SSB1 immunofluorescent signals in dTAG-treated SSB1-dTAG cells with overexpression of wild-type or mutant SSB1 (i). Quantification of the nuclear SSB1 foci number is shown in (j) (n = 150 foci from one representative experiment, which has been performed twice with similar results). Statistical analysis was performed using two-tailed t-tests. P values are shown at the top of the graphs. (k) The “optoDroplet” assay measuring the punctum formation ability of wild-type SSB1, ΔIDR, and cancer-derived mutants (S172P/H173L and R206Q) in Hela cells. Representative images were shown before and after light induction. (l-m) R-loop IF in dTAG-treated SSB1-dTAG cells with overexpression of wild-type SSB1 or cancer-derived mutants (l). Quantification of the nuclear R-loop signals is shown in (m) (n = 150 foci from one representative experiment, which has been performed twice with similar results). Statistical analysis was performed using two-tailed t-tests. P values are shown at the top of the graphs. (n-o) Immunostaining of γH2AX signal in dTAG-treated SSB1-dTAG cells with overexpression of wild-type SSB1 or cancer-derived mutants (n). Quantification of the nuclear γH2AX foci number is shown in (o). (n = 150 foci from one representative experiment, which has been performed twice with similar results). Statistical analysis was performed using two-tailed t-tests. P values are shown at the top of the graph.
Extended Data Fig. 10
Extended Data Fig. 10. Analysis of Pol II pausing regulated by SSB1 mutants.
(a) Pol II ChIP–qPCR at promoters (top) and gene bodies (bottom) of example genes (JUN and RASSF10 as shorter genes; RSBN1 and USP48 as longer genes) in DMSO- or dTAG-treated SSB1-dTAG cells with overexpression of wild-type or mutant SSB1. Values are mean ± SD (n = 3 biological replicates). Statistical analysis was performed using two-tailed t-tests. P values are shown at the top of the graphs. (b) Pausing index of example genes (JUN and RASSF10 as shorter genes; RSBN1 and USP48 as longer genes) in DMSO- or dTAG-treated SSB1-dTAG cells with overexpression of wild-type or mutant SSB1. Values are mean ± SD (n = 3 biological replicates). Statistical analysis was performed using two-tailed t-tests. P values are shown at the top of the graphs. (c) DMSO- or dTAG-treated SSB1-dTAG cells were overexpressed with fused proteins comprising N terminus of SSB1 and IDRs of TAF15, EWS, or YTHDF1 and followed by western blotting. Data represent three independent experiments.

Comment in

References

    1. Gomez-Gonzalez, B. & Aguilera, A. Transcription-mediated replication hindrance: a major driver of genome instability. Genes Dev.33, 1008–1026 (2019). - PMC - PubMed
    1. Hamperl, S. & Cimprich, K. A. Conflict resolution in the genome: how transcription and replication make it work. Cell167, 1455–1467 (2016). - PMC - PubMed
    1. Huang, J., Gong, Z., Ghosal, G. & Chen, J. SOSS complexes participate in the maintenance of genomic stability. Mol. Cell35, 384–393 (2009). - PMC - PubMed
    1. Zheng, H. et al. Identification of Integrator-PP2A complex (INTAC), an RNA polymerase II phosphatase. Science370, eabb5872 (2020). - PubMed
    1. Huang, K. L. et al. Integrator recruits protein phosphatase 2A to prevent pause release and facilitate transcription termination. Mol. Cell80, 345–358 (2020). - PMC - PubMed

Publication types

MeSH terms