. 2023 Nov:114:22-45.
doi: 10.1016/j.bbi.2023.08.004. Epub 2023 Aug 7.

Traumatic brain injury-induced inflammatory changes in the olfactory bulb disrupt neuronal networks leading to olfactory dysfunction

Affiliations

Traumatic brain injury-induced inflammatory changes in the olfactory bulb disrupt neuronal networks leading to olfactory dysfunction

Xiang Liu et al. Brain Behav Immun. 2023 Nov.

Abstract

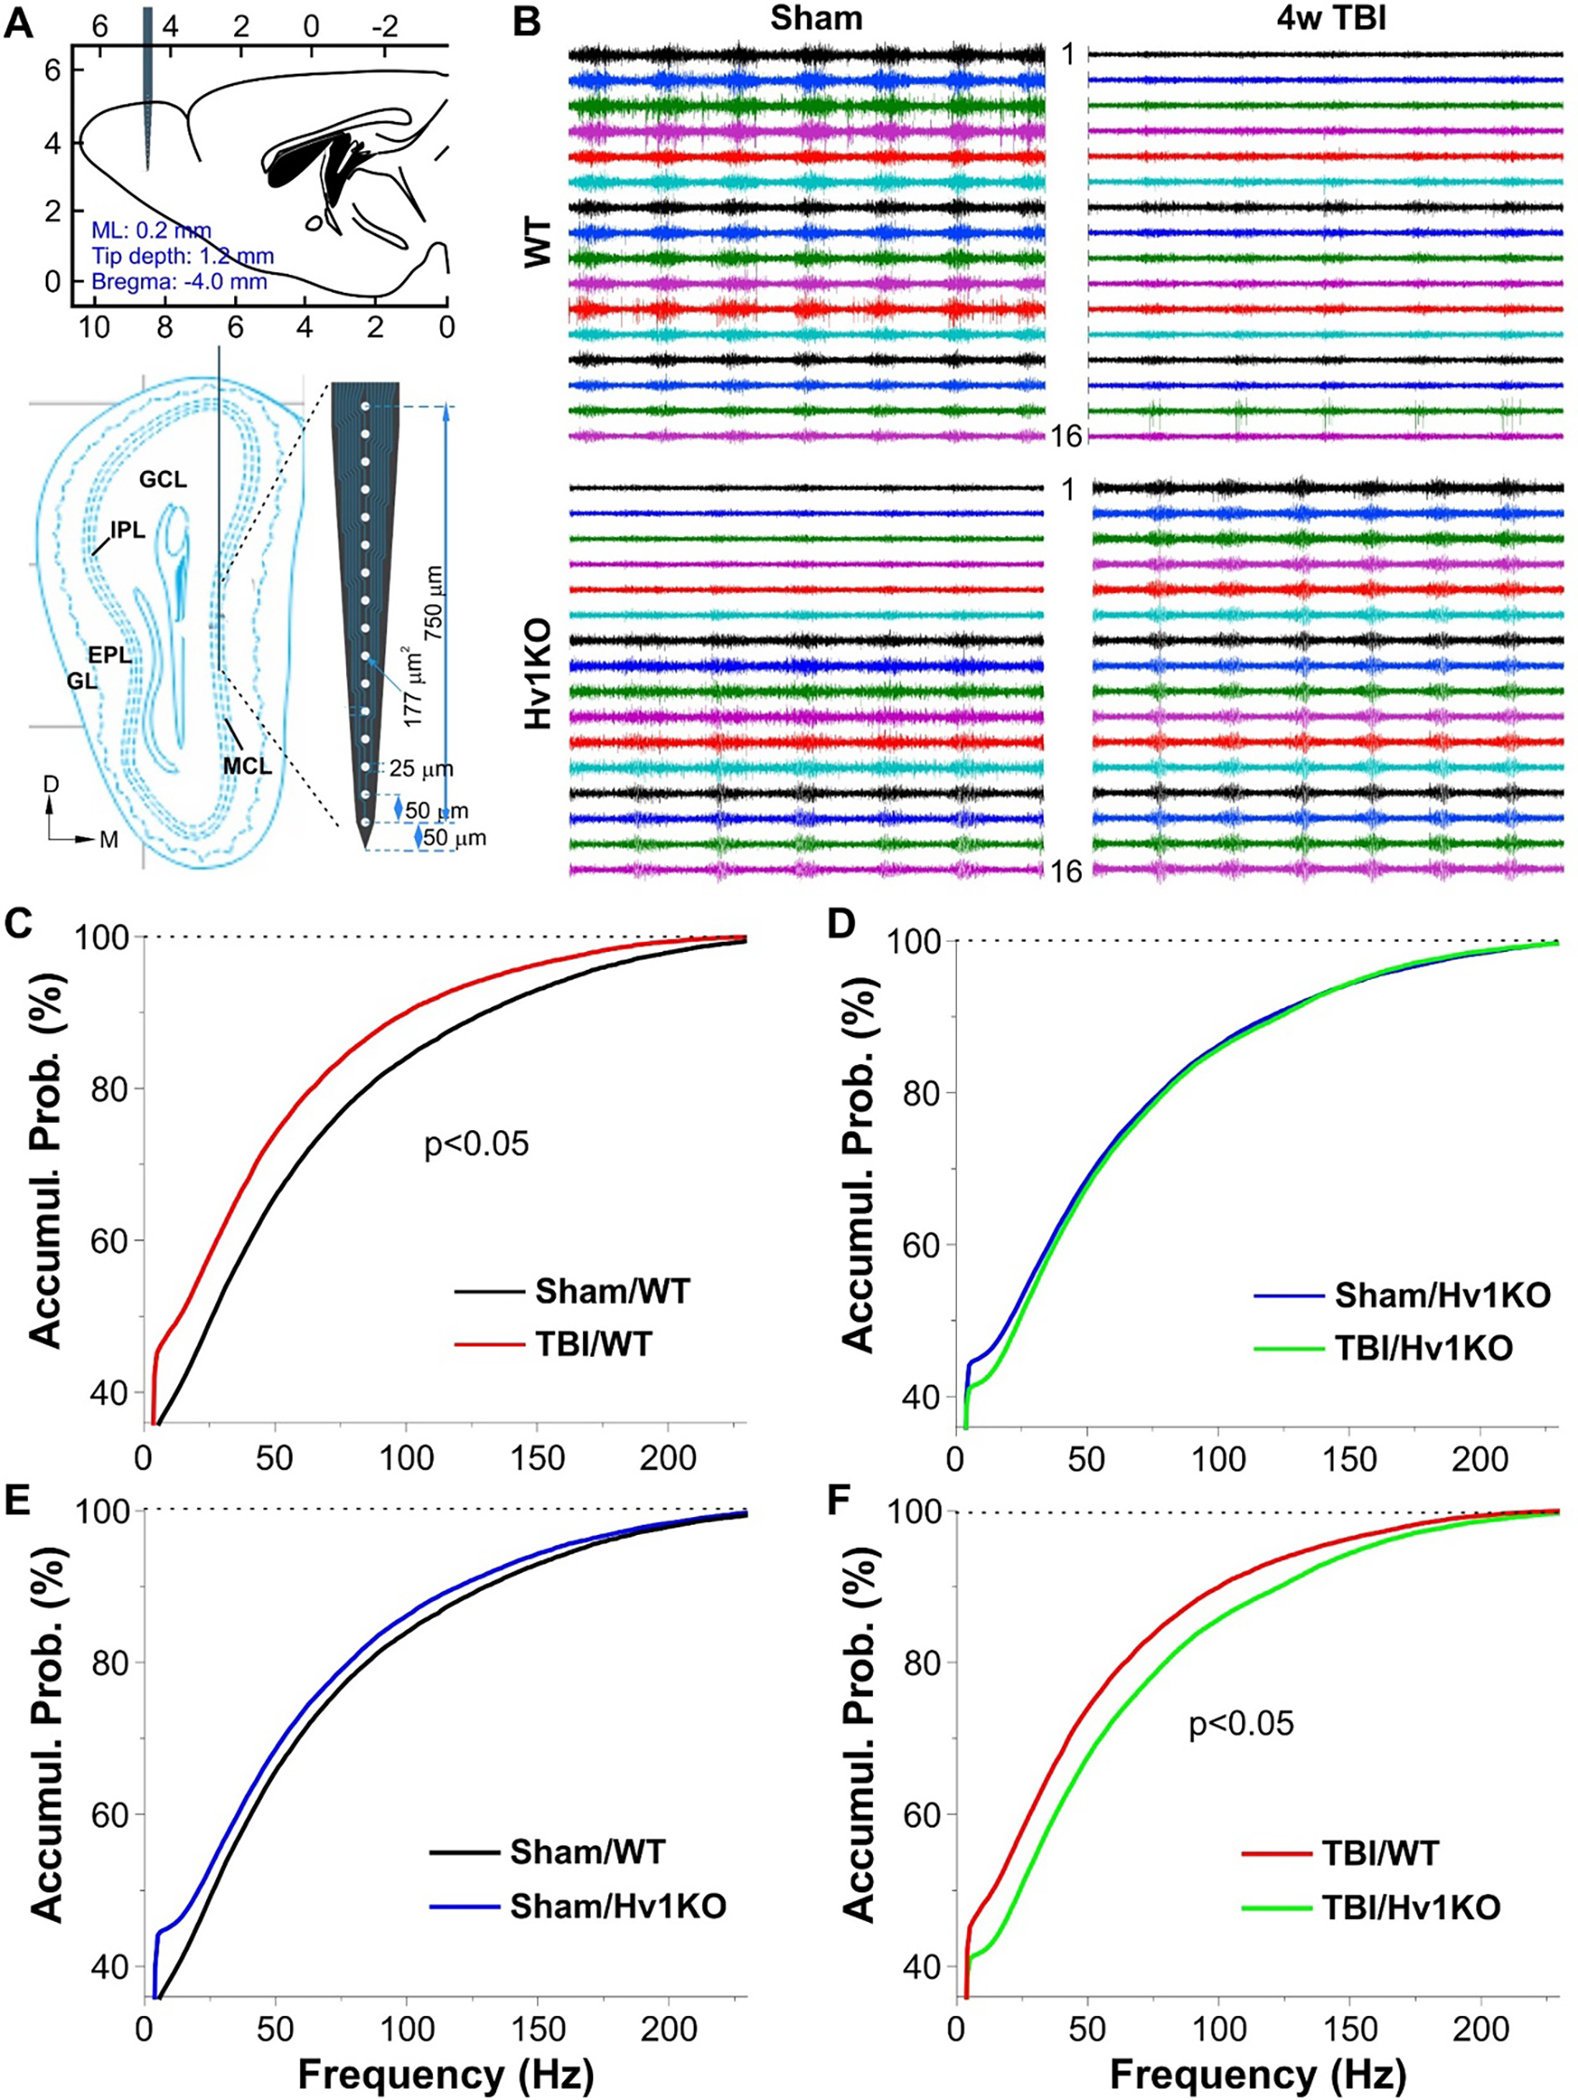
Approximately 20-68% of traumatic brain injury (TBI) patients exhibit trauma-associated olfactory deficits (OD) which can compromise not only the quality of life but also cognitive and neuropsychiatric functions. However, few studies to date have examined the impact of experimental TBI on OD. The present study examined inflammation and neuronal dysfunction in the olfactory bulb (OB) and the underlying mechanisms associated with OD in male mice using a controlled cortical impact (CCI) model. TBI caused a rapid inflammatory response in the OB as early as 24 h post-injury, including elevated mRNA levels of proinflammatory cytokines, increased numbers of microglia and infiltrating myeloid cells, and increased IL1β and IL6 production in these cells. These changes were sustained for up to 90 days after TBI. Moreover, we observed significant upregulation of the voltage-gated proton channel Hv1 and NOX2 expression levels, which were predominantly localized in microglia/macrophages and accompanied by increased reactive oxygen species production. In vivo OB neuronal firing activities showed early neuronal hyperexcitation and later hypo-neuronal activity in both glomerular layer and mitral cell layer after TBI, which were improved in the absence of Hv1. In a battery of olfactory behavioral tests, WT/TBI mice displayed significant OD. In contrast, neither Hv1 KO/TBI nor NOX2 KO/TBI mice showed robust OD. Finally, seven days of intranasal delivery of a NOX2 inhibitor (NOX2ds-tat) ameliorated post-traumatic OD. Collectively, these findings highlight the importance of OB neuronal networks and its role in TBI-mediated OD. Thus, targeting Hv1/NOX2 may be a potential intervention for improving post-traumatic anosmia.

Keywords: Hv1; NOX2; Neuroinflammation; Olfactory dysfunction; Traumatic brain injury.


Conflict of interest statement

Declaration of Competing Interest The authors declare that they have no known competing financial interests or personal relationships that could have appeared to influence the work reported in this paper.

Figures

Figure 1.
Figure 1.. TBI induces inflammatory changes and activates microglia/macrophages in the olfactory bulb (OB).
(A-D) Quantitative real-time PCR revealed significant higher levels of pro-inflammatory [TNFα, IL6, CXCL2 (MIP2), IL1β] and anti-inflammatory (Arg1, IL10) cytokines in the OB at 1d (A-B) and 3d (C-D) after TBI compared to Sham mice. N=10–12 (A-B) and 9–12 mice (C-D). Mann Whitney test. (E-F) Representative IHC images of Iba-1, CD16/32, F4/80, and CD68 staining (red) and quantification of the positive cells in the glomerular layer (GL) of the OB at 1d after TBI. N=4 mice/group. Two-tailed unpaired t-test. Scale bar=100 μm. *p<0.05, **p<0.01, ***p<0.001, ****p<0.0001 vs. sham. MCL: mitral cells layer.
Figure 2.
Figure 2.. TBI causes microglial activation and macrophages infiltration in the OB.
Young adult male C57BL/6 mice were subjected to TBI and flow cytometry was used to examine OB microglia and macrophages at 1d or 90d post-injury. (A) Representative contour plots (A, left panels) and quantification (A, right panels) of CD45intCD11b+ microglia and CD45hiCD11b+ monocytes in OB at 1d after TBI. (B) Representative density plots and quantification of F4/80+/CD11b+ cells in the OB. (C-F) Representative histograms and quantification of IL1β and IL6 in microglia (C-D) and myeloid cells (E-F). (G-I) Representative histograms, dot plots, and quantification of granularity [side scatter (SSC), G], IL-6 (H), and TNF (I) in microglia in OB at 90d after TBI. N=6 (A-F) and 4–7 (G-I) mice/group. Two-tailed unpaired t-test. *p<0.05, **p<0.01, ***p<0.001 vs. sham. FMO: fluorescence minus one.
Figure 3.
Figure 3.. TBI upregulates NOX2 expression by activated microglia and monocytes in the OB at 1d post-injury.
(A-B) Representative histograms and quantification of NOX2 in CD45intCD11b+ microglia and CD45hiCD11b+ monocytes in the OB. N=6 mice/group. Two-tailed unpaired t-test. (C-D) Representative IHC images of NOX2 (green) and Iba-1 (red) and quantification of the positive cells in the glomerular layer (GL) of the OB. (E-H) Representative IHC images and quantification of NOX2/CD68, NOX2/CD16/32, NOX2/F4/80, NOX2/8-OHG positive cells in the GL of the OB. **p<0.01, ***p<0.001 vs. sham. N=4 mice/group. Two-tailed unpaired t-test. Scale bar=100 μm.
Figure 4.
Figure 4.. NOX2 and Hv1 signaling are upregulated in the OB after acute brain injury.
(A-B) Representative IHC images of Hv1 (red) and NOX2 (green) and quantification of the positive cells in the glomerular layer (GL) of the OB at 24h post-injury. N = 4 mice/group. *p<0.05, vs. sham. Two-tailed unpaired t-test. Scale bar= 100 μm. (C) qPCR analysis showed significantly increased mRNA levels of hvcn1 (Hv1) and cybb (NOX2) in the OB at 3d after TBI. N=9–12 mice/group. *p<0.05, ***p<0.001 vs. sham. Two-tailed unpaired t-test. (D) qPCR analysis showed robust increased mRNA levels of hvcn1 in both NOX2 knock out (KO) and WT mice in the injured cortex at 3d after TBI. N=9 mice/group. ***p<0.001 vs. sham. Two-way ANOVA followed by Tukey’s multiple comparison.
Figure 5.
Figure 5.. TBI effects on neuronal spiking activities in the OB glomerular layer of anesthetized mice at the 7 days post-injury.
(A) Schematic drawings showing the recording setup with a 16-channel inserted into the glomerular layer (GL) on the OB medial side. Top: lateral view; bottom: coronal section of the OB at the plane 4.3 mm away from the Bregma. (B) Typical traces comparing TBI effects of spike activities detected by 16 channels between Sham and 7d TBI groups in WT mice (top) or Hv1KO mice (bottom). (C-F) Line graphs presenting cumulative probability (cumul. prob.) vs instant inter-spike frequency to compare between Sham/WT and TBI/WT groups (C, N=5 mice/group), Sham/Hv1KO (N=4 mice) and TBI/Hv1KO (N=5 mice) groups (D), Sham/WT and Sham/Hv1KO groups (E), and TBI/WT and TBI/Hv1KO groups (F).
Figure 6.
Figure 6.. TBI effects on LFP oscillatory activities at low-frequencies in the OB glomerular layer of anesthetized mice at the 7 days post-injury.
(A) Typical traces comparing TBI effects of LFP oscillatory activities detected by 16 channels between Sham and 7d TBI groups in WT mice (top) or Hv1KO mice (bottom). (B-E) Line graphs presenting cumulative probability (cumul. prob.) vs instant inter-spike frequency to compare between Sham/WT and TBI/WT groups (B, N=5 mice/group), Sham/Hv1KO (N=4 mice) and TBI/Hv1KO (N=5 mice) groups (C), Sham/WT and Sham/Hv1KO groups (D), and TBI/WT and TBI/Hv1KO groups (E). *p<0.05, **p<0.01, ***p<0.001, two-way ANOVA test.
Figure 7.
Figure 7.. TBI effects on neuronal spiking activities in the mitral cell layer of anesthetized mice at the 7 days post-injury.
(A) Schematic drawings showing the recording setup with a 16-channel inserted into the mitral cell layer (MCL) on the OB medial side. Top: lateral view; bottom: coronal section of the OB at the plane 4.3 mm away from the Bregma. (B) Typical traces comparing TBI effects of spike activities detected by 16 channels between Sham and 7d TBI groups in WT mice (top) or Hv1KO mice (bottom). (C-F) Line graphs presenting cumulative probability (cumul. prob.) vs instant inter-spike frequency to compare between Sham/WT and TBI/WT groups (C, N=5 mice/group), Sham/Hv1KO (N=4 mice) and TBI/Hv1KO (N=5 mice) groups (D), Sham/WT and sham/Hv1KO groups (E), and TBI/WT and TBI/Hv1KO groups (F).
Figure 8.
Figure 8.. TBI effects on LFP oscillatory activities at high-frequencies in the OB mitral cell layer of anesthetized mice at the 7 days post-injury.
(A) Typical traces comparing TBI effects of LFP oscillatory activities detected by 16 channels between sham and 7d TBI groups in WT mice (top) or Hv1KO mice (bottom). (B-E) Line graphs presenting cumulative probability (cumul. prob.) vs instant inter-spike frequencies ranging 30–200 Hz to compare between Sham/WT and TBI/WT groups (B, N=5 mice/group), Sham/Hv1KO (N=4 mice) and TBI/Hv1KO (N=5 mice) groups (C), Sham/WT and Sham/Hv1KO groups (D), and TBI/WT and TBI/Hv1KO groups (E). *p<0.05, **p<0.01, ***p<0.001, two-way ANOVA test.
Figure 9.
Figure 9.. TBI effects on neuronal spiking activities in the mitral cell layer of anesthetized mice at the 4 weeks post-injury.
(A) Schematic drawings showing the recording setup with a 16-channel inserted into the mitral cell layer (MCL) on the OB medial side. Top: lateral view; bottom: coronal section of the OB at the plane 4.3 mm away from the Bregma. (B) Typical traces comparing TBI effects of spike activities detected by 16 channels between Sham and 4w TBI groups in WT mice (top) or Hv1KO mice (bottom). (C-F) Line graphs presenting cumulative probability (cumul. prob.) vs instant inter-spike frequency to compare between Sham/WT and TBI/WT groups (C, N=5 mice/group), Sham/Hv1KO (N=5 mice) and TBI/Hv1KO (N=4 mice) groups (D), Sham/WT and Sham/Hv1KO groups (E), and TBI/WT and TBI/Hv1KO groups (F).
Figure 10.
Figure 10.. TBI effects on LFP oscillatory activities at low-frequencies in the OB mitral cell layer of anesthetized mice at 4 weeks post-injury.
(A) Typical traces comparing TBI effects of LFP oscillatory activities detected by 16 channels between sham and TBI groups in WT mice (top) or Hv1KO mice (bottom). (B-E) Line graphs presenting cumulative probability (cumul. prob.) vs instant inter-spike frequencies ranging 0–12 Hz (top) to compare between Sham/WT and TBI/WT groups (B, N=5 mice/group), Sham/Hv1KO (N=5 mice) and TBI/Hv1KO (N=4 mice) groups (C), Sham/WT and Sham/Hv1KO groups (D), and TBI/WT and TBI/Hv1KO groups (E). Middle and bottom graphs are blown-up of the corresponding top ones to highlight the differences. *p<0.05, **p<0.01, ***p<0.001, two-way ANOVA test.
Figure 11.
Figure 11.. TBI effects on LFP oscillatory activities at high-frequencies in the OB mitral cell layer of anesthetized mice at 4 weeks post-injury.
(A-D) Line graphs presenting cumulative probability (cumul. prob.) vs instant inter-spike frequencies (12–30 Hz) to compare between Sham/WT and TBI/WT groups (A, N=5 mice/group), Sham/Hv1KO (N=5 mice) and TBI/Hv1KO (N=4 mice) groups (B), Sham/WT and sham/Hv1KO groups (C), and TBI/WT and TBI/Hv1KO groups (D). Middle and bottom graphs are blown-up of the corresponding top ones to highlight the differences. (E-H) Line graphs presenting cumulative probability (cumul. prob.) vs instant inter-spike frequencies (30–200 Hz) to compare between Sham/WT and TBI/WT groups (E, N=5 mice/group), Sham/Hv1KO (N=5 mice) and TBI/Hv1KO (N=4 mice) groups (F), Sham/WT and Sham/Hv1KO groups (G), and TBI/WT and TBI/Hv1KO groups (H). *p<0.05, **p<0.01, ***p<0.001, two-way ANOVA test.
Figure 12.
Figure 12.. TBI significantly reduces synaptic density of the glomerular layer (GL) in the OB at 7d and 4w post-injury.
(A) Representative presynaptic marker Bassoon images of the OB from Sham and 7d TBI groups. (B) Quantification of the fluorescent intensity in the GL of the OB at 7d post-injury. N=4 mice/group. (C) Quantification of the synaptic puncta density in the GL area where the electrophysiological recording was made at 7d post-injury. N=4 mice/group. (D) Representative presynaptic marker Bassoon images of the OB from Sham and 4w TBI groups. (E-F) Quantification of the fluorescent intensity and the synaptic puncta in the OB GL at 4w post-injury. N=6 mice/group. *p<0.05, **p<0.01, ***p<0.001 vs. sham; #p<0.05 vs. TBI/WT. Two-way ANOVA followed by Tukey’s multiple comparison. Scale bar=500 μm (A, D) and 30 μm (inserts).
Figure 13.
Figure 13.. TBI causes olfactory dysfunction which is diminished in the absence of Hv1.
(A) Buried food test was performed in both Hv1 KO and WT mice at 5 weeks after TBI. N=11–17 mice/group. ***p<0.001 vs. Sham/WT; #p<0.05 vs. TBI/WT. Two-way ANOVA followed by Tukey’s multiple comparison. (B-E) Two-bottle discrimination test of various concentration of isovaleric acid (IVA) at 6 weeks after TBI. 80% mice in Sham/WT group showed positive responses to high concentration of isovaleric acid (IVA, 10−3 M) within 1 min, 100% mice respond within 2 min. However, WT/TBI mice showed delayed positive responses (only 20% mice within 1 min, 85% in 2 min). In response to lower concentration of IVA (10−6 M), 30% mice in sham/WT group showed positive within 1 min, 90% in 2 min. But no mice in WT/TBI group showed positive in 1 min, 13% in 2 min. WT/TBI mice displayed significant impairment of olfactory function in each test compared with sham mice. In contrast, Hv1 KO/TBI mice displayed significant better performance in these tests, indicating improved olfactory function. (F) Buried food test at 24 weeks post-injury. N=11–13 mice/group. ***p<0.001 vs. Sham/WT; ###p<0.001 vs. TBI/WT. Two-way ANOVA followed by Tukey’s multiple comparison. (G-K) Two-bottle discrimination test of various concentration of isovaleric acid at 26 weeks post-injury. In response to lower concentration of IVA (10−5 M), % of mice in each group with latency less than 2 min are shown in K [N=10 (Sham/WT), 6 (Sham/Hv1 KO), 3 (TBI/WT), and 8 (TBI/Hv1 KO)]. ***p<0.001 vs. Sham/WT; #p<0.05 vs. TBI/WT. Two-way ANOVA followed by Tukey’s multiple comparison.
Figure 14.
Figure 14.. NOX2 activation contributes to OB dysfunction after TBI.
(A-B) The buried food and odor memory tests were performed in both NOX2 KO and WT mice subjected to CCI. N=8–12 mice/group. **p<0.01, ***p<0.001 vs. Sham/WT; #p<0.05, ##p<0.01 vs. TBI/WT. Two-way ANOVA followed by Tukey’s multiple comparison. (C-G) Intranasal delivery of NOX2 inhibitor (NOX2ds-tat, 1.4 mg/kg/day, twice/day) for 7 days after TBI reserved post-traumatic olfactory dysfunction evaluated in buried food test at 24 days post-injury and two-bottle discrimination test at 28 days post-injury. N=7–12 mice/group. ***p<0.001 vs. Sham/Veh; ##p<0.01 vs. TBI/Veh. Two-way ANOVA followed by Tukey’s multiple comparison.
Figure 15.
Figure 15.. Hv1/NOX2-mediated proinflammatory changes in the olfactory bulb (OB) disrupt OB neuronal circuits leading to poorer olfactory function after traumatic brain injury (TBI).
TBI induced microglia/macrophages-related neuroinflammation in the glomerular layer (GL) of the OB, accompanied by upregulation of Hv1/NOX2. OB neuronal firing activities indicate that TBI induced early neuronal hyperexcitation and later hypo-neuronal activity and disrupted network function in the OB which were improved in the Hv1 KO mice. TBI significantly reduces synaptic density of the glomerular layer (GL) in the OB which was improved in the Hv1 KO mice at chronic time-point. Genetically or pharmacologically manipulating Hv1/NOX2 signaling can improve TBI-mediated olfactory dysfunction. MCL: mitral cells layer; EPL: external plexiform layer; NOX2: The nicotinamide adenine dinucleotide phosphate oxidase 2.

References

    1. Abais JM, Zhang C, Xia M, Liu Q, Gehr TW, Boini KM, Li PL, 2013. NADPH oxidase-mediated triggering of inflammasome activation in mouse podocytes and glomeruli during hyperhomocysteinemia. Antioxidants & redox signaling 18, 1537–1548. - PMC - PubMed
    1. Alves J, Petrosyan A, Magalhaes R, 2014. Olfactory dysfunction in dementia. World J Clin Cases 2, 661–667. - PMC - PubMed
    1. Ashwell K, 1991. The distribution of microglia and cell death in the fetal rat forebrain. Brain Res Dev Brain Res 58, 1–12. - PubMed
    1. Bakker K, Catroppa C, Anderson V, 2014. Olfactory dysfunction in pediatric traumatic brain injury: a systematic review. J Neurotrauma 31, 308–314. - PubMed
    1. Basser PJ, Mattiello J, LeBihan D, 1994. MR diffusion tensor spectroscopy and imaging. Biophys J 66, 259–267. - PMC - PubMed

Publication types