Review
. 2023 Nov:114:144-153.
doi: 10.1016/j.bbi.2023.08.002. Epub 2023 Aug 7.

Machine learning models of plasma proteomic data predict mood in chronic stroke and tie it to aberrant peripheral immune responses

Affiliations
Review

Machine learning models of plasma proteomic data predict mood in chronic stroke and tie it to aberrant peripheral immune responses

Neda H Bidoki et al. Brain Behav Immun. 2023 Nov.

Abstract

Post-stroke depression is common, long-lasting and associated with severe morbidity and death, but mechanisms are not well-understood. We used a broad proteomics panel and developed a machine learning algorithm to determine whether plasma protein data can predict mood in people with chronic stroke, and to identify proteins and pathways associated with mood. We used Olink to measure 1,196 plasma proteins in 85 participants aged 25 and older who were between 5 months and 9 years after ischemic stroke. Mood was assessed with the Stroke Impact Scale mood questionnaire (SIS3). Machine learning multivariable regression models were constructed to estimate SIS3 using proteomics data, age, and time since stroke. We also dichotomized participants into better mood (SIS3 > 63) or worse mood (SIS3 ≤ 63) and analyzed candidate proteins. Machine learning models verified that there is indeed a relationship between plasma proteomic data and mood in chronic stroke, with the most accurate prediction of mood occurring when we add age and time since stroke. At the individual protein level, no single protein or set of proteins predicts mood. But by using univariate analyses of the proteins most highly associated with mood we produced a model of chronic post-stroke depression. We utilized the fact that this list contained many proteins that are also implicated in major depression. Also, over 80% of immune proteins that correlate with mood were higher with worse mood, implicating a broadly overactive immune system in chronic post-stroke depression. Finally, we used a comprehensive literature review of major depression and acute post-stroke depression. We propose that in chronic post-stroke depression there is over-activation of the immune response that then triggers changes in serotonin activity and neuronal plasticity leading to depressed mood.

Keywords: Biomarker; Depression; Machine learning; Proteomics; Proximity extension assay; Stroke.


Conflict of interest statement

Declaration of Competing Interest The authors declare that they have no known competing financial interests or personal relationships that could have appeared to influence the work reported in this paper.

Figures

Figure 1:
Figure 1:. Clinical workflow and feature correlations.
A) Eighty-five people with acute ischemic stroke participated in this study. Plasma was obtained between 5 months and 9 years following stroke onset, and at the same time participants completed the Stroke Impact Scale (SIS). Plasma samples were processed by Olink Proteomics, and subsequent data was analyzed. B) Clinical data were incorporated into a correlation network to visualize the relationship between them, where edges reflect a Spearman correlation coefficient of ≥ 0.1. The network is visualized using a layout calculated by the tSNE algorithm. Teal circles represent the -log10(p value) of clinical features that are significantly associated with the proteomics data, with larger circles representing more significant associations. SIS surveys contained the following missing values: 13 SIS1, 1 SIS5, 1 SIS6, 10 SIS7, 1 SIS8. C) A correlation network was generated to display the relationships between individual proteins and SIS3. Each node represents an individual protein, and node size reflects the correlation coefficient between a given protein and SIS3 score. Node color represents the -log10 p-value of the relationship with SIS3 using a Spearman test, and edges reflect a correlation coefficient of ≥ 0.1 between nodes. SIS=Stroke Impact Scale.
Figure 2:
Figure 2:. Machine learning models of SIS3 score.
A machine learning model was generated to determine whether Olink proteomics data (1,011 total proteins) can be used to estimate SIS3. Additional clinical features of subject age, and time since stroke were incorporated to improve the model. Bar height shows the -log10(p value) (Pearson test) of the correlation between the model outcome and measured SIS3. The dashed line represents p = 0.05.
Figure 3:
Figure 3:. Comparison of the predictive models of post-stroke depression using limited sets of proteins.
The predictive power of the model for the estimation of SIS3 is highest when using data from all 1,011 proteins, along with the clinical features of participant age and time since stroke. The statistical power is reduced when only the subset of 180 proteins that are significantly correlated with SIS3 (p < 0.05) are incorporated in the model. Bar height shows the -log10(p value) (Pearson test) of the correlation between the model outcome and measured SIS3. The dashed line represents p = 0.05.
Figure 4.
Figure 4.. Biological groupings of proteins modulated in people with chronic post-stroke depression.
Proteins that are significantly correlated (p < 0.05) with SIS3 score based on a Spearman correlation analysis are organized by their biological function, denoted in black. Proteins in blue are negatively correlated with SIS3 score, which means that expression is higher in people who report worse mood. Proteins in green are positively correlated with SIS3 score, and expression is lower with worse mood. A black arrowhead denotes proteins that have been previously associated with depression with or without stroke, based on a literature review, and a red star denotes proteins that are most highly correlated with SIS3 (ρ > │0.3│).
Figure 5.
Figure 5.. Normalized plasma expression of proteins of interest.
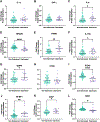
Participants were dichotomized by SIS3 score into better mood (SIS3 > 63) or worse mood (SIS3 ≤ 63). Plasma levels of the proinflammatory cytokines A) IL-1β, B) TNF-α, C) IL-6, or other immune-modulating proteins D) HPGDS, E) TRIM5 and F) IL-1RA are expressed as fold change relative to protein levels in people with better mood. Additionally, proteins which modulate serotonin activity G) QDPR, H) KYNU or I) ITGAV, or proteins involved in neuronal plasticity: J) 4E-BP1, K) GDNF and L) NRP1 are also displayed as median +/− interquartile range. Statistically significant differences are indicated as *p<0.05; **p<0.01; ***p<0.001; ****p<0.0001 based on results from a Student’s t test.
Figure 6.
Figure 6.. Proposed model of chronic post-stroke depression.

References

    1. Virani SS, Alonso A, Benjamin EJ, et al. Heart Disease and Stroke Statistics-2020 Update: A Report From the American Heart Association. Circulation. 2020;141(9):e139–e596. - PubMed
    1. Ferrari F, Villa RF. The Neurobiology of Depression: an Integrated Overview from Biological Theories to Clinical Evidence. Mol Neurobiol. 2017;54(7):4847–4865. - PubMed
    1. Ayerbe L, Ayis S, Wolfe CDA, Rudd AG. Natural history, predictors and outcomes of depression after stroke: systematic review and meta-analysis. Br J Psychiatry. 2013;202(1):14–21. - PubMed
    1. Towfighi A, Ovbiagele B, El Husseini N, et al. Poststroke Depression: A Scientific Statement for Healthcare Professionals From the American Heart Association/American Stroke Association. Stroke. 2017;48(2):e30–e43. - PubMed
    1. Richards D. Prevalence and clinical course of depression: a review. Clin Psychol Rev. 2011;31(7):1117–1125. - PubMed

Publication types