. 2023 Aug 9;13(1):12949.
doi: 10.1038/s41598-023-39795-y.

Exploring adaptation responses of maize to climate change scenarios in southern central Rift Valley of Ethiopia

Affiliations

Exploring adaptation responses of maize to climate change scenarios in southern central Rift Valley of Ethiopia

Daniel Markos et al. Sci Rep. .

Abstract

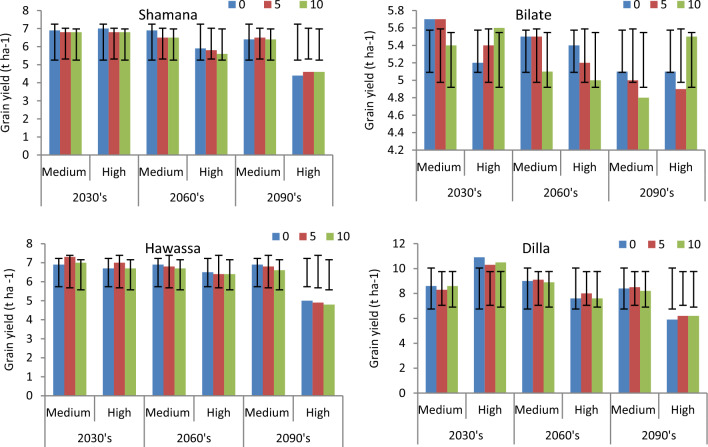
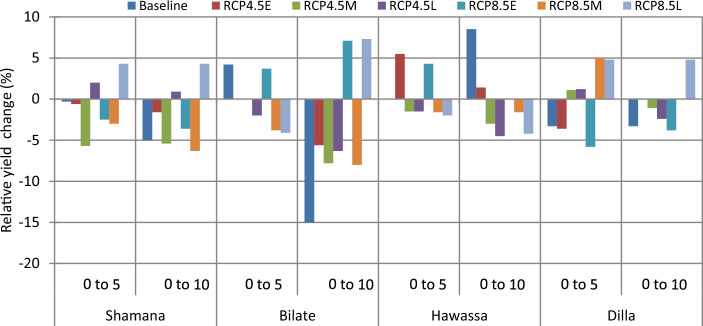
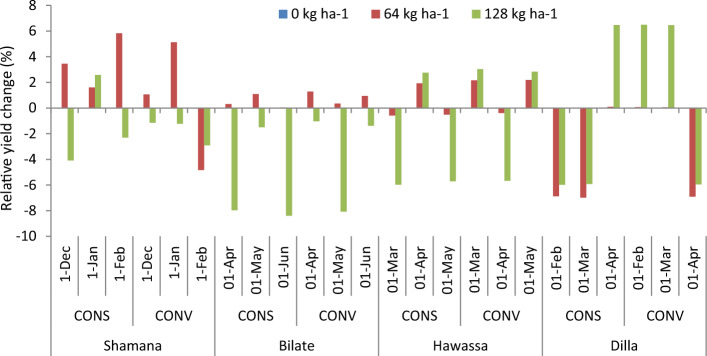
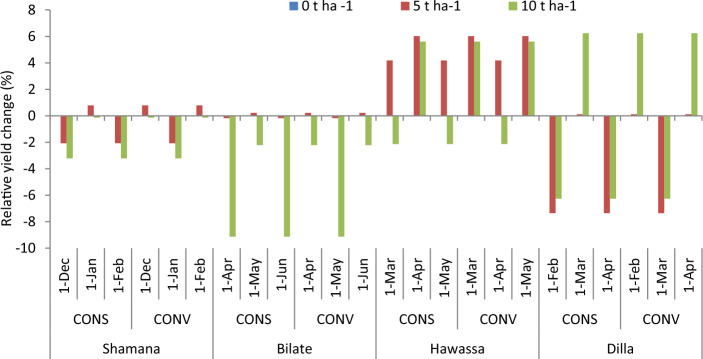
In this study, we assessed responses of adaptation options to possible climate change scenarios on maize growth and yield by using projections of 20 coupled ensemble climate models under two representative concentration pathways (RCPs) 4.5 and 8.5 by means of a DSSAT model. Growth and yield simulations were made across present and future climate conditions using the hybrid maize variety (Shone). Subsequently, simulated yields were compared with farmer' average and on-farm trial yields. Results showed that on-farm trial yield (5.1-7.3 t ha-1) lay in between farmers' average yield (2.9-5 t ha-1) and water-limited potential yield (6.3-10.6 t ha-1). Maize yields achieved in farmers' fields are projected to decline towards mid-century and further towards the end of the century regardless of the adaptation options compared with baseline in low potential clusters. Results of a combination of adaptation options including February planting, use of 64 kg ha-1 N and conservation tillage provided yield advantage of 5.8% over the 30 cm till under medium GHGs emission scenario during mid-century period at Shamana. Mulching with 5 t ha-1 was projected to produce a 4-5% yield advantage in the Hawassa cluster during the mid-century period regardless of changes in tillage or planting window. Under a high GHGs emission scenario, over 13.4% yield advantage was projected in the Bilate cluster due to conservation tillage and June planting during the mid-century period. In the Dilla cluster, the use of 10 t ha-1 mulch, conservation tillage and early planting (February) would result in a 1.8% yield advantage compared with the control either in medium or high GHGs emission scenarios. Thus, the most promising and least risky practices among simulated strategies were the use of nitrogen and mulching in combination with tillage or planting date adjustment. However, adaptation options remained least promising and highly risky if not integrated with mulching or nitrogen use. Hence, the negative impacts of future climate change and subsequent yield gaps would be reduced by optimizing the application of nitrogen, mulch and their interaction with planting date and tillage in high and low potential areas of maize production.


Conflict of interest statement

The authors declare no competing interests.

Figures

Figure 1
Figure 1
The study area map with the four distinct clusters (Map of the study area with four clusters was created by using free version of QGIS version 3.32, https://www.qgis.org/en/site/forusers/download.html/).
Figure 2
Figure 2
Box and Whisker plot of average farmers’ yield (t ha−1) across the four clusters.
Figure 3
Figure 3
Change in grain yield (%) of shone variety in response to conservation tillage relative to traditional tillage during early, mid and late-century across baseline, RCP 4.5 and 8.5 emission scenario at Shamana, Bilate, Hawassa and Dilla clusters, southern central Ethiopia.
Figure 4
Figure 4
Maize yields (t ha−1) and error bars with standard deviation due to change in tillage practices under medium and high GHGs during early, mid and late century period across Shamana, Bilate, Hawassa and Dilla clusters.
Figure 5
Figure 5
Change in grain yield (%) of shone variety in response to planting date relative to control during early, mid and late-century across baseline, RCP 4.5 and 8.5 emission scenario at Shamana, Bilate, Hawassa and Dilla clusters, southern central Ethiopia.
Figure 6
Figure 6
Maize yields (t ha−1) and error bars with standard deviation due to change in planting date under medium and high GHGs during early, mid and late century period across Shamana, Bilate, Hawassa and Dilla clusters.
Figure 7
Figure 7
Change in grain yield (%) of shone variety in response to nitrogen application relative to control during early, mid and late-century across baseline, RCP 4.5 and 8.5 emission scenario at Shamana, Bilate, Hawassa and Dilla clusters, southern central Ethiopia.
Figure 8
Figure 8
Maize yields (t ha−1) and error bars with standard deviation due to change in nitrogen rate under medium and high GHGs during early, mid and late century period across Shamana, Bilate, Hawassa and Dilla clusters.
Figure 9
Figure 9
Maize yields (t ha−1) and error bars with standard deviation due to change in mulching rate under medium and high GHGs during early, mid and late century period across Shamana, Bilate, Hawassa and Dilla clusters.
Figure 10
Figure 10
Change in grain yield (%) of shone variety in response to mulching relative to control during early, mid and late-century across baseline, RCP 4.5 and 8.5 emission scenario at Shamana, Bilate, Hawassa and Dilla clusters, southern central Ethiopia.
Figure 11
Figure 11
Percentage yield change from baseline in response to nitrogen, tillage and planting dates during mid-century across medium GHGs emission scenario for Shamana, Bilate, Hawassa and Dilla clusters.
Figure 12
Figure 12
Percentage yield change from baseline in response to mulching, tillage and planting dates during mid-century across medium GHGs emission scenario for Shamana, Bilate, Hawassa and Dilla clusters.
Figure 13
Figure 13
Percentage yield change from baseline in response to nitrogen, tillage and planting dates during mid-century across medium GHGs emission scenario for Shamana, Bilate, Hawassa and Dilla clusters.
Figure 14
Figure 14
Percentage yield change of maize from baseline in response to mulching, tilage and planting dates during mid-century across medium GHGs emission scenario for Shamana, Bilate, Hawassa and Dilla clusters.

References

    1. Food and Agriculture Organization of the United Nations (FAO). Food loss analysis: Causes and solutions—case study on the maize value chain in the Federal Democratic Republic of Ethiopia. Rome 46 (2018).
    1. Lobell DB, Schlenker W, Costa-Roberts J. Climate trends and global crop production since 1980. Science. 2011;333:616–620. doi: 10.1126/science.1204531. - DOI - PubMed
    1. Liu Z, Yang X, Lin X, Hubbard KG, Lv S, Wang J. Maize yield gaps caused by non-controllable, agronomic, and socioeconomic factors in a changing climate of Northeast China. Sci. Total Environ. 2016;541:756–764. doi: 10.1016/j.scitotenv.2015.08.145. - DOI - PubMed
    1. Bruinsma J. World Agriculture: Towards 2015/2030: An FAO Perspective. Earthscan; 2003.
    1. Food and Agriculture Organization of the United Nations (FAO). World agriculture towards 2030/2050: The 2012 revision (2022).

Publication types